


- Portada
- volume 16 (2012)
- numéro 1
- How to count elephants in West African savannahs? Synthesis and comparison of main gamecount methods


Vista(s): 6772 (49 ULiège)
Descargar(s): 385 (5 ULiège)

How to count elephants in West African savannahs? Synthesis and comparison of main gamecount methods

Notes de la rédaction
Received on November 26, 2010; accepted on November 7, 2011
Résumé
Comment compter les éléphants dans les savanes d'Afrique de l'Ouest ? Synthèse et comparaison des principales méthodes de comptage de la faune. La comparaison de plusieurs méthodes de comptage d’éléphants – comptage aérien par échantillon, comptage aérien total et comptage pédestre – est présentée à travers des études de cas d’inventaires effectués au Burkina Faso, Bénin et Niger. Nous les avons comparées en termes d’effort et de cout pour inventorier une zone (efficacité d’échantillonnage), d’efficacité dans la collecte des données (efficacité de détection), ainsi qu’en termes d’exactitude et de précision. Les comptages aériens par échantillon sont moins efficaces en termes d’échantillonnage et de détection et produisent des estimations peu précises et inexactes lors de comptage de population d’éléphants < 0,5 éléphant·km-2. La précision peut partiellement être améliorée par une stratification. Les comptages pédestres produisent les meilleures efficacités d’échantillonnage et de détection, mais le nombre de données est souvent insuffisant pour produire des estimations fiables. En conséquence, les auteurs ne fournissent pas de résultats pour l’éléphant. Le comptage aérien total est une méthode couteuse en valeur absolue qui requiert une logistique importante ; de plus, aucune mesure de l’erreur n’est possible. Le comptage aérien total fournit cependant une relativement bonne efficacité d’échantillonnage et de détection, ainsi que des estimations relativement exactes appréciées par les gestionnaires si les recommandations techniques sont respectées. Le comptage aérien total pourrait être recommandé pour compter les populations d’éléphants de savane d’Afrique de l’Ouest tous les 3 à 5 ans pour minimiser les couts de comptage.
Abstract
The comparison of some elephants count methods – aerial sampling count, aerial total count and direct foot count – has been presented through surveys’ study cases implemented in Benin, Burkina Faso and Niger. We compare them in terms of effort and cost to survey an area (sampling efficiency), efficiency in data collection (detection efficiency) as well as accuracy and precision. Aerial sampling count returns low sampling and detection efficiency and very low precision and accuracy figures when counting elephants populations below 0.5 elephant·km-2. Precision can partly be improved by stratification. Direct foot count returns the best sampling and detection efficiency but insufficient data number to produce reliable estimates. Therefore some authors often produced no results for elephants. Aerial total count is a costly method in absolute value. It requires important logistic and no measure of error is possible. However it provides relatively good sampling and detection efficiency as well as relatively accurate figures appreciated by wildlife managers if technical requirements are respected. Aerial total count could be recommended to survey small population of West African elephants each 3 to 5 years to minimize yearly count costs.
Tabla de contenidos
1. Introduction
1West African elephants (Loxodonta africana) are characterized by generally small and isolated populations (Roth et al., 1991; Bouché et al., 2004a; Bouché et al., 2011); in consequence many elephants populations are vulnerable or endangered (Bouché et al., 2011) and their abundance has to be monitored (Blanc et al., 2007).
2Small and often clumped populations carry stochastic variability that imposes large statistical challenges when wishing to define population sizes and trends. The count of small populations returns low precise estimates (Jachmann, 2001; Barnes, 2002; Ferreira et al., 2009). Therefore, as a small population drops, it is unlikely to detect changes in numbers until the population is well on the way to extinction (Taylor et al., 1993 ; Barnes, 2002). In consequence, the selection of the most appropriate method is a critical issue.
3The human demographic pressure surrounding West African protected areas is high. It becomes almost inevitable for elephants to come across human settlements without confining their movements to the protected areas’ limits (Barnes, 1999; Clerici et al., 2007; Bouché et al., 2011). When elephants do roam beyond the limits of protected areas, they often damage crops and raid fruit trees (Nakande et al., 2007). Several elephants populations use to roam across unprotected areas increasing human-elephant conflicts (Barnes, 1999; Bouché et al., 2004a; Bouché et al., 2011). Elephants distributions and movement information are thus important to manage and secure the elephants range as well as mitigate conflicts (Blanc et al., 2007).
4Elephants populations are counted for six decades in African savannahs. Whereas several methods exist, only in a very few cases different elephants counting methods were compared (Jachmann, 1991; Jachmann, 2001; Whitehouse et al., 2001; Jachmann, 2002; Gaidet-Drapier et al., 2006). The aim of this paper is to present different elephants count methods used in West Africa, to compare the most used through study cases and to help to select the most appropriate one according to the habitat and the small elephants population densities living in West African savannahs.
2. Elephants total count methods
2.1. Aerial total count
5Aerial total count consists to scan the entire study area from high wing aircraft or helicopter along flight lines sufficiently close to theoretically count all elephants in (Douglas-Hamilton, 1996). The sum of elephants counted represents the population’s size. To do this, the study area is divided in blocks. Each of them is scanned by an aircraft in few hours (generally during cooler’s hours of the day) (Norton-Griffiths, 1978; Douglas-Hamilton, 1996; Bouché et al., 2004c; Bouché et al., 2004d; Craig, 2004). In each block parallel flight lines are drawn. Flight line interval is fixed between 0.5 to 1 km according to the visibility and the habitat crossed at the discretion of the crew. Each flight line is extended 2 km beyond the block limit to overlap the neighboring ones. The overlap count gives an estimate of the number of animals missing in the block and minimize the effect of herds crossing over block boundaries (Norton-Griffiths, 1978). Flight height ranges between 200 and 400 feet according to the visibility conditions. The aircraft crew is composed by a pilot in charge of navigation, a front seat observer in charge of data recording and photographs, and rear seat observers in charge of spotting and counting the animals. Each herd or single individuals as well as their location are recorded.
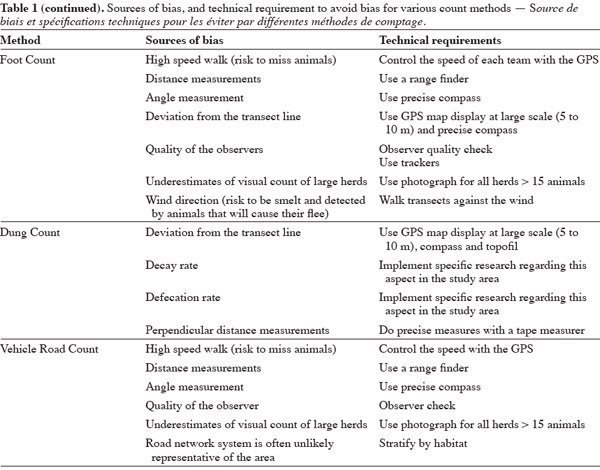
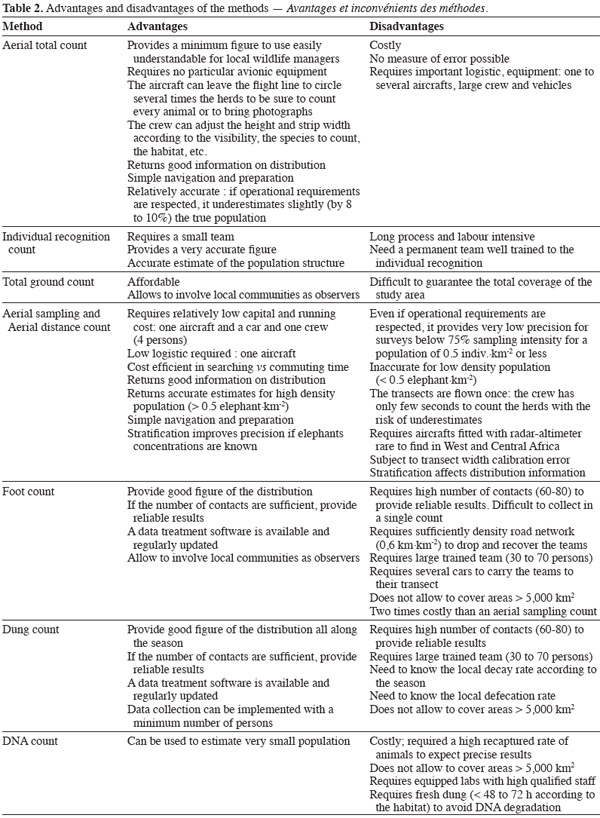
6After each day flight and once the survey completed, the survey coordinator is in charge to discriminate all double counts. Within each block, some elephants double counts are easily detected by the crew during count. Inter-blocks double counts must be discriminated. To do so, the front seat observer records herds’ composition (age and adults’ sex) as well as GPS location. Numeric photography is used to count large herds (> 15 elephants). The sum of elephants counted (excluding double counts) gives the total number of the study area. In reality it is unlikely that all individuals and herds could be detected by the observers, therefore aerial total count provides a minimum estimate (Norton-Griffiths, 1978; Douglas-Hamilton, 1996; Bouché et al., 2004c; Bouché et al., 2004d) (Tables 1 and 2).

7Aerial total counts are implemented to count particular species from which the expecting results should be better than aerial sampling count (Norton-Griffiths, 1978). Targeted species should be gregarious and conspicuous at 100 m of height. They should represent important species on the recreative, economic or the habitat impact points of view. They are generally highly mobile. The aerial total count is therefore useful if the whole ecosystem is taken into account (Norton-Griffiths, 1978; Douglas-Hamilton, 1996; Bouché et al., 2004c; Bouché et al., 2004d).
2.2. Individual recognition count
8Individual recognition consists to build an individual identification database where each elephant of a population is individually identified by the combination of his physical characteristics (sex, body, ears and tusks’ shape, scars, etc.) (Douglas-Hamilton, 1972; Moss, 1996). No statistic is required. The sum of elephants recorded in the database represents the population’s size. A small team of observers in charge of the database’s building and update can achieve this (Tables 1 and 2).
2.3. Total ground count
9Total ground count consists, on very small study area, to divide it into blocks. Survey teams (one per block) travel blocks simultaneously to detect and count precisely each herd (Ouédraogo et al., 2009). The sum of animals counted gives the population’s size. The precise count and record of each group’s composition and location helps to discriminate double-counted herds and to eliminate it from the final figure. Possible sources of bias and solutions are presented (Tables 1 and 2).
3. Elephants sample count methods
3.1. Aerial strip sampling count
10Aerial sampling count consists to fly with a minimum four-seater high wing aircraft along parallel transects randomly or systematically distributed across the study area (Pennycuick et al., 1972; Norton-Griffiths, 1978). Transects must be placed along the ecological gradient, e.g. from river to dry savannah, means cutting across ecological zones (Norton-Griffiths, 1978; Craig, 2004). Stratification can be used if density is not homogenous across the study area. Transects must be flown at constant height and speed. Elephants are counted by two rear seat observers into strip samples (= sampling units) each situated on each side of the aircraft. The strip samples are materialized by two streamers fixed perpendicularly to wing struts and parallel to the aircraft’s fuselage (Norton-Griffiths, 1978). The distance between streamers is commonly chosen to define a 200 to 250 m width strip at a fly height of 91 m above the ground. The more the strip is large, the more animals are missed or underestimated (Bell et al., 1973). Only animals seen between the streamers will be counted (Norton-Griffiths, 1978 ; Mbugua, 1996). Height control is an important issue. Aircraft must fly at a constant height during the survey. For a given strip width, the more the aircraft flies high, the more the strip width will be large and inversely the more the aircraft flies low, the more the strip width will be narrow (Mbugua, 1996). The commonly used flight height is 300 feet (91 m) above the ground level (a.g.l.). The flight height is controlled by a radar-altimeter (Norton-Griffiths, 1978), laser range finder (Bouché, 2002) or shadow-meter device (Pennycuick, 1973; Norton-Griffiths, 1978). The front seat observer records the height each 30 seconds to take into account the height variation (and therefore the strip width variation) in the result as well as elephants location (thanks to a GPS) and numbers. Numeric photography is used to count large herds (> 15 elephants).
11Knowing the sampling strip width and the transects’ length, it is possible to calculate the sampling area’s size. Data treatment is performed using the Jolly method 1 or 2 (Norton-Griffiths, 1978). Possible sources of bias and solutions, advantages and disadvantages are presented (Tables 1 and 2).
3.2. Line transect methods
12Line transect regroups methods that consists to count directly elephants or elephants dung along transects distributed randomly or systematically across the study area (Buckland et al., 1993). Each time an animal/dung or a group of animals is detected, the observer records the herds’ radial distance to himself (sighting distance) with a laser range-finder or by pacing and use a compass to bearing the herd (sighting angle). Each measure is made to the geographical centre of each herd. From sighting distance and angles, the perpendicular distance for each observation can be calculated (Jachmann, 1996; Jachmann, 2001). For dung count, each dung or dung groups’ perpendicular distance from the transect line is measured with a tape-measurer. Three assumptions are critical to achieve reliable estimates of density from line transect count:
13– animals or dung on the line are detected with certainty (probability of 100% or 1);
14– animals or dung are detected at their initial location;
15– measurements are exact (Buckland et al., 1993).
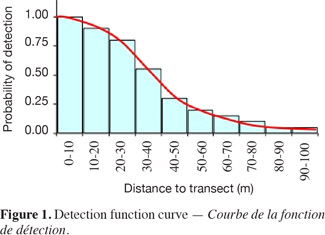
16The probability to observe an animal or a group of animals or dung from the line transect declines when the animal or dung's distance from the transect increases (Buckland et al., 1993; Jachmann, 2001). The frequency graphic of grouped perpendicular distances will show the probability of detecting a group of animals at a particular distance to the transect line. Mathematically the function represented by a curve that links the probability of animal’s detection and the perpendicular distance to transect is called detection function (Figure 1) (Buckland et al., 1993; Jachmann, 2001). The detection function is not only function of animal’s distance to transect but also of the vegetation density, the group size, the conspicuousness of the species, the behavior of the species, and the size of the animal (Buckland et al., 1993; Jachmann, 2001).
17The true detection function is not known. Several detection functions’ models are tested. The one that better fits the field data distribution is finally selected. Models are rather complicated and a specific software named DISTANCE (Buckland et al., 1993) is designed for such task. Large number of data are required (60 to 80 contacts) to reach an acceptable precision (CV of 15 to 30%). Several count sessions of the same study area can be combined to enlarge the data pool (Buckland et al., 1993). However this is only possible if the population is not statistically different from one count to another (Jachmann, 2001).
18Aerial distance count. Aerial distance count consists to count directly elephants along transects distributed randomly or systematically across the study area along the ecological gradient (Buckland et al., 1993). Instead of measuring perpendicular distances of each group encountered, animals are counted into several parallel strips on each side of the aircraft (Buckland et al., 1993). Two sets of streamers are fixed perpendicularly on each wing strut and parallel to the aircraft fuselage (Buckland et al., 1993). As for the aerial sampling count, the spaces between streamers are calibrated in order to define given strip widths at a given height. Stratification can be used if density is not homogenous across the study area. This survey provides grouped data. It is thus not necessary for the observer to record exact perpendicular distances. According to the line-transect theory, the distribution of animals’ observations along transect will be more grouped in the strip closer to the transect than the farer ones (Buckland et al., 1993). The crew members’ tasks during flight are close to those of aerial sampling count. Possible sources of bias and solutions, advantages and disadvantages are presented in tables 1 and 2.
19Foot count. Foot count consists in counting elephants directly along ground line-transects distributed randomly or systematically across the study area (Buckland et al., 1993). An alternative is the recce transect which consists to join one point to another one trough the easiest way. This method is often used in forest to collect data between two transects; however it is rarely used in savannah where the teams’ transport is done by vehicle along roads.
20Foot count is implemented by several teams (9 to 20). A team leader and 2 observers compose each team. The team leader is in charge of the navigation along the transect line (thanks to a compass and a GPS) and the data recording (thanks to a compass and a GPS and a laser rangefinder). He must pay attention to take measurements to the geographical centre of each herd. The two observers are in charge of spotting and counting animals. The team walks in line along transects. Surveys are implemented during the cooler’s hours of the day (generally early in the morning) when animals are more visible and active. When the hot hours of the day are coming, animals trend to hide in the shade and are therefore less visible.
21Transects must be both oriented along the ecological gradient and in the dominant wind direction. Stratification can be used if density is not homogenous across the study area. Teams must walk against the wind (according to observation made by Bouché). If not, the animals that they are supposed to count can smell them and fly away before they are in visual contact. Animals (especially herbivores) use wind to alert other herds situated downstream of the wind. This will result in a very low number of contacts. U or square shape transect must therefore be avoided.
22It is imperative that team’s speed does not exceed 3 kph (according to observation made by Bouché). The more the walk is speedy, the more the probability to miss animals is important. Transects length should not exceed 9 to 10 km per day per team. This allows to each team to walk the transect between 6 and 9 am before the hot hours of the day. Longer transects will induce the non-respect of speed limits and the increasing of the observers’ fatigue especially during several continuous days, or sometimes, successive weeks of count.
23A sufficiently dense road network (0.6 km·km-2) is required. It allows to drop and recover teams by vehicle at the beginning and at the end of the transect. The road network should be designed in such a way that the roads’ intervals do not exceed 9 to 10 km, that corresponds roughly to a transect length. Possible sources of bias and solutions, advantages and disadvantages are presented in tables 1 and 2.
24Dung count. Dung count uses the line-transect principles to count elephant dung (Buckland et al., 1993; Barnes, 1996). This task is implemented by field teams composed by 2 to 5 persons each. The team walks in line along randomly and systematically placed transects, located along the ecological gradient, thanks to a compass and a GPS. The team leader in charge of the navigation carries a topofil. Each time a dung is observed in a strip of 6 to 10 m on each side of the transect, the perpendicular distance between the topofil’s line and the geographical centre of the group of dung is measured precisely thanks to a tape-measurer and the dung age is estimated (Barnes, 1996). From dung count data, the calculation of specific decay and defecation rates are required to give an elephants estimate (Barnes, 1996). Possible sources of bias and solutions, advantages and disadvantages are presented in tables 1 and 2.
25Vehicle road count. Vehicle road count uses the line-transect count method and DISTANCE data analysis (Buckland et al., 1993). Instead of following a transect, the car drives along defined road circuits. This method is implemented by a team of several persons in a car driving at constant speed (Cornélis, 2000; Jachmann, 2001; Bouché et al., 2004b; Gaidet-Drapier et al., 2006). A sufficiently dense road network (0.6 km·km-2) (Jachmann, 2001) is required to have the chance to cross most of the habitats of the survey area as possible (Jachmann, 2001). Possible sources of bias and solutions are presented in table 1.
3.3. DNA count
26It consists to collect DNA samples from fresh dung along randomly distributed transect. The analysis consists in applying a capture recapture method (Krebs, 1999) from the DNA samples to estimate the elephants population size (Eggert et al., 2003). A team is required to collect dung samples in the field; these are sent to the laboratory for DNA extraction and analysis. Possible sources of advantages and disadvantages are presented in table 2.
4. Study cases
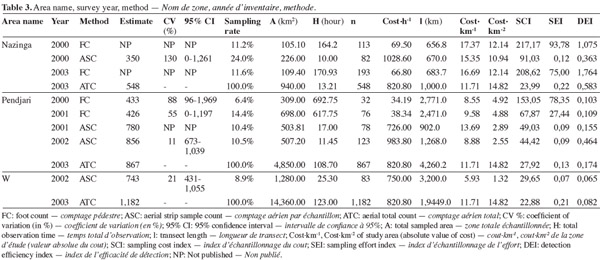
27Nazinga Game Ranch (Burkina Faso), Pendjari National Park (Benin), W Regional Park (Benin, Burkina Faso and Niger) (Figure 2) experienced aerial strip sample, aerial total and foot counts.
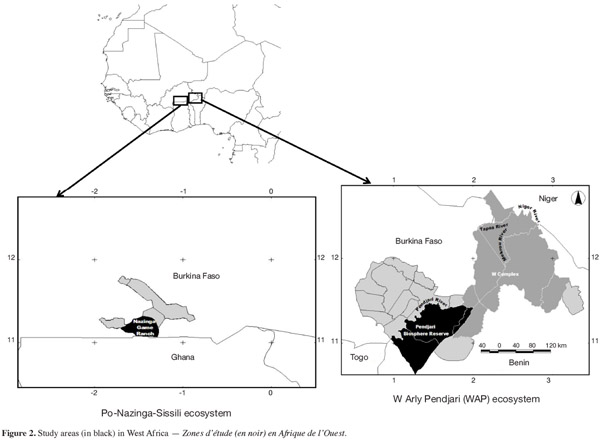
28Nazinga Game Ranch is part of the Po Nazinga Sissili ecosystem in the south of Burkina Faso. It covers 940 km2. It benefits of more than 30 years of continuous ecological monitoring (Bouché, 2007a). These last decades, Nazinga Game Ranch appears more and more as a conservation island surrounded by cultivations (Bouché et al., 2004d; Bouché, 2007a). If some elephants use to roam outside the Nazinga Game Ranch, this phenomenon seems quite limited these last years (Bouché 2007a; Bouché, 2007b). Wildlife is mainly concentrated for several years to some parts of the Nazinga Game Ranch (Bouché et al., 2004d; Bouché, 2007a). Elephant migration is a reduced phenomenon especially during the dry season because Nazinga Game Ranch concentrates the main permanent water points (Bouché, 2007a). The period 2000-2003 targeted, is characterized by the quasi-simultaneous implementation of several counting methods (Bouché, 2007a). Rainfall volume was equivalent in 2000 and 2003 (around 800 mm) (Hien et al., 2003), therefore the elephants population is expected to be equivalent in size in 2000 and 2003.
29The Pendjari Biosphere Reserve is part of the 30,000 km2 W-Arly-Pendjari (WAP) ecosystem. Pendjari Biosphere Reserve covers 4,850 km2 (Figure 2). It was surveyed several times since the 1980’s (Sinsin, 2000). Since 2000, aerial sample and aerial total counts (Sinsin, 2001; Rouamba, 2002a; Bouché et al., 2004c ) and several foot counts (Sinsin, 2000; Sinsin, 2001) have been implemented each year at the same period. The total count follows strictly the technical requirements to limit biases as much as possible (Table 1). The 2000-2003 period will be taken into consideration for the purpose of this paper. Each year, at the end of the dry season, animals from the Western part of the WAP ecosystem (Figure 2) migrated to the Pendjari River that contains the last water resources of this part of the WAP ecosystem (Bouché et al., 2004c). Between 2000 and 2003, rains show irregular pattern from 650 mm in 2002 up to 1,000 mm in 2000 and 2003. In 2002 rains appear very late (late July). In contrast, in 2003 first rains occur early (in April just before the survey). It is likely that late rains in 2002 favor the concentration of elephants in the Pendjari Biosphere Reserve during the survey period, while early rains in 2003 have probably favored the elephants dispersal.
30W complex covers 14,360 km2 and is part of the WAP ecosystem (Figure 2). W complex is shared between Benin, Burkina Faso and Niger. Only two recent surveys have been carried out in W complex at the same period of the year at one year of interval. The first survey was an aerial sample count (Rouamba et al., 2002b) and the other one was an aerial total count (Bouché et al., 2004c). This count follows strictly the technical requirements to limit bias (Table 1). No foot count was implemented in W Park due to the very large area and the weak road density at that time. In 2002 the first rains occured later (end of July) while in 2003 the first rains occurred in April during the survey period. If in 2002 the main part of elephants concentration occur along the main river system (Mekrou and Tapoa rivers), in 2003 the first rains were still not sufficiently intense to favor the elephants dispersal. Except for very few other water points, Mekrou (located in the centre of the W complex), Tapoa and Niger (both located North of the W complex) rivers are the single sources of permanent water in a radius of 50 km and more (Lungren et al., 2005). Migration from other areas of the ecosystem between the two surveys is unlikely. W complex’s elephants in 2003 showed a distribution equivalent to the one observed in 2002 (Rouamba et al., 2002b; Bouché et al., 2004c). Radio-tracking data confirm that W complex’s elephants do circular circuits inside W Park and do not seem to mix with the elephants from other parts of the ecosystem (Ipavec et al., 2007). We assume therefore that there was no major immigration between the two years.
5. Elephant counting method's comparison
31For the purpose of this paper only aerial strip sample, aerial total and foot counts will be compared because they are the commonest methods used to count West African savannah’s elephants in particular, and other wildlife species in general (Blanc et al., 2007). The single available elephants count’s datasets in the subregion have been recorded using these count methods.
32Individual reconnaissance is an effective and accurate method (Table 2) but labor-intensive (Moss, 1996; Whitehouse et al., 2001). It requires long observation’s period by a same team to create a reliable database. This efficient method was unfortunately never used in West African savannahs.
33Total ground count and vehicle road count have been implemented very occasionally in some areas of West Africa (Jachmann, 1991; Bouché, 2007a; Ouédraogo et al., 2009). We have thus not a comparative basis for all areas. The main sources of biases in total ground count are from failing to search the whole area and failing to spot animals (Tables 1 and 2). Vehicle road counts are open to bias because the road networks are not randomly designed and therefore unlikely to be representative of an area if the road network is not dense enough (Tables 1 and 2) (Norton-Griffiths, 1978).
34Aerial distance-sampling count was never used in West Africa. It suffers from violating one of the most important hypotheses of distance sampling theory: all objects (or animals) along transect should be detected with the probability of 1 (Buckland et al., 1993) (Table 1). During aerial distance count, animals located on the transect line have a great probability to be missed by the observers. These ones can only reasonably observe animals on both sides of the aircraft, at few dozen to hundred meters away from the transect line, but cannot look at the transect line just behind the fuselage. In order to record animals located along the transect line, a camera fixed on the aircraft’s belly can be used. Otherwise, the DISTANCE software allows to treat data with a probability below 1 to see animal on the transect (Buckland et al., 1993) (Table 2).
35Contrary to forest area where dung count is the most used method (Barnes, 1996; Barnes, 2002), it has almost never been implemented in savannahs (Jachmann, 1991; Bouché 2007a). Dung count requires the calculation of the decay and defecation rates prior to estimate elephants population (Barnes, 1996) (Tables 1 and 2). These parameters have been rarely studied and estimated in savannahs (Jachmann, 1991). They represent a source of uncertainty that will be combined to these of the DISTANCE’s result, without the possibility to assess the global uncertainty. However, dung count is a very good tool to assess the elephants distribution and relative abundance (by dung abundance) along the seasons (Table 2) (Barnes, 2002). Dung counts have proven to be efficient to detect population changes (Barnes, 2002). However this method cannot be implemented on very large areas.
36DNA count was used for very small forest elephant population count (Eggert et al., 2003) but never in West African savannahs. It necessitates a specialized team and equipped laboratories to analyze the DNA that are not quite common in the study area. The mark recapture method is also labor-intensive. The rate of recaptured must be high (50%) to expect precise results (Krebs, 1999). This method cannot be implemented on very large areas.
5.1. Comparison criteria
37The comparison method has been implemented for each site following the criteria defined by Gaidet-Drapier et al. (2006). In addition accuracy and precision have been discussed.
38Sampling Effort Index. A Sampling Effort Index (SEI) was calculated as the number of human-hours required to sample 1 km2. We used the surveyed area as the unit of analysis and calculated it for each survey:
39SEI = H x P/A
40where H is the observation period (hours), P the number of people involved to monitor the area, and A the sampled area (km2).
41Sampling Costs Index. We calculated a cost per hour or per km for each sampling method used. All costs were expressed in Euro (€). Estimates were obtained on the basis of observer’s allowance, trip, equipment and logistic costs (fuel, equipment maintenance). The allowance for a team leader involved in foot counts was 15 € per day, and 3.8 € per day for the local driver and observers. For the aerial surveys, fees were 30 € per day for experienced technicians, 150 € per day for the pilot and 300 € per day count + 15 days for reporting at the same rate for a consultant. Trip costs were calculated from fees of 0.6 € per km for a car and 300 € per hour for an aircraft. We generated a sampling costs index (SCI) for each survey:
42SCI = (H x hour cost rate + l x km cost rate)/A
43where H is the transect observation time (hours), l the transect length (km) and A the sampled area (km2). We summed the costs per hour and per kilometer to account for the fact that costs are estimated independently on either the distance covered or the time spent basis (Gaidet-Drapier et al., 2006).
44Detection Efficiency Index. The detection efficiency index (DEI) is defined here as the average number of animals observed within the area covered during counts. For every censuses, we had access to the number of individuals counted. To compare the foot and aerial counts, we used an animal detection efficiency index based on the number of individuals of elephants (Gaidet-Drapier et al., 2006). We used the sampled area to calculate an elephant detection efficiency index (DEI):
45DEI = n/A x R
46where n is the total number of elephants or counted, A the surveyed area (km2) and R the number of replicates. For the cases discussed here the value of R was equal to 1 because each successive survey using the same method followed various sampling plan and intensity. Therefore we did not consider them as replicates.
47Accuracy and precision. Accuracy and precision produced by each method will be discussed with reference to the literature (Norton-Griffiths, 1978; Whitehouse et al., 2001; Ferreira et al., 2009).
6. Discussion
6.1. Sampling Cost Index
48Sample cost index (SCI) is far more important for foot count than for aerial counts (Table 3) despite a cost per hour and per km far lower (Table 3). However the areas sampled by foot counts are small. Aerial total counts show generally the highest cost per hour and highest absolute cost (cost·km-2) (Table 3), but the important survey effort in time (H) or in km (l) provides a moderate SCI (Table 3). The cost per hour and per km is quite important for aerial sample counts (Table 3). This is due to the low number of flight hours (H) or km (l) invested in comparison to the volume of money invested.
6.2. Sampling Effort Index
49The sampling effort index (SEI) is far more important for foot counts than any other methods. However the effort is intensive on very small sampling area (A). Despite the effort invested, foot counts did not provide sufficient important dataset to provide reliable estimates (Sinsin, 2000; Sinsin, 2001; Hien et al., 2003). Aerial total count showed a higher SEI than aerial sampling count (Table 3).
6.3. Detection Efficiency Index
50Detection effort index is generally more important for foot counts. Aerial total counts show a higher DEI than aerial sampling counts except for Pendjari (Table 3). The change in weather conditions and elephant densities explain the relatively low DEI in 2003.
6.4. Accuracy
51Aerial total counts provide a minimum estimate that is known to underestimate the true population (Norton-Griffiths, 1978; Whitehouse et al., 2001). However if the technical requirements are respected (Table 1), the magnitude of the underestimate is slightly: about 8 to 10% (Norton-Griffiths, 1978; Whitehouse et al., 2001).
52Classic 20% sampling rate’s aerial counts return accurate estimates when counting population at density of 0.5 elephant·km-2 and above (Ferreira et al., 2009). For elephants populations living at densities below 0.5 animals·km-2 (like it is the case in West Africa), 20% sampling rate’s aerial sampling counts provide inaccurate results (Ferreira et al., 2009). In our examples (Table 3), aerial sampling counts provide estimates 36% lower than aerial total counts for both W and Nazinga (Table 3). Weather conditions variability influenced strongly Pendjari elephants distribution in 2001, 2002 and 2003. The early rains occurred in Pendjari in 2003 favored elephants dispersion while the 2001 and 2002’s late rains favored their concentration. This explains why the 2003 Pendjari total count estimate (867 elephants) was equivalent to the 2001 and 2002 aerial sampling counts’ estimates (respectively 780 and 856 elephants), while the aerial total counts for the other study cases provided higher results than aerial sampling counts. The low data number recorded during foot counts did not allow to return reliable estimates (Table 3). The foot count’s estimates were far below from those of aerial surveys.
6.5. Precision
53Aerial total counts cannot provide any measure of error (Table 3). If the population is 0.5 animals·km-2 aerial strip sample counts return very poor precision if the sampling intensity is below 75% (Ferreira et al., 2009). However West African elephants population lived in density far below 0.5 animals·km-2 (Bouché et al., 2011). An important sampling intensity (75% and more) requires a survey effort equivalent to an aerial total count and is therefore also costly (Norton-Griffiths, 1978). Precision can be improved using stratification (Norton-Griffiths, 1978; Craig, 2004). However often for financial reasons, the time interval between two successive counts is sometimes so long that the population distribution may have changed. Reconnaissance flights are therefore requested prior to stratify but it generates additional costs too.
54To produce reliable results, foot counts dataset’s size should be of 60-80 contacts (Buckland et al., 1993). Unfortunately no area in West Africa returns the minimum number of direct contacts required by DISTANCE (Buckland et al., 1993) at a reasonable sampling rate (systematic survey plan with 1.5 to 2 km transect interval). Accordingly many of the elephants foot counts’ data are not analyzed (Hien et al., 2003). Foot count is also quite a costly count but far slower (15 to 40 km2 covered per day vs 100 to 250 km2 per hour for aerial counts) (Table 3). Foot counts must be dedicated to small size areas up to 5,000 km2 if a road network of 0.6 to 1 km·km-2 exists.
55For Nazinga, 2003’s aerial total count, result was included in the 2000’s aerial sampling count result’s confidence interval (Table 3). The same has been recorded for the Pendjari counts. Two thousand three aerial total count’s result was included in the 2000 and 2001’s foot counts and 2002 aerial sampling count’s confidence intervals (Table 3). However for W complex, 2003 total count’s result exceeded 2002 aerial sampling confidence interval (Table 3).
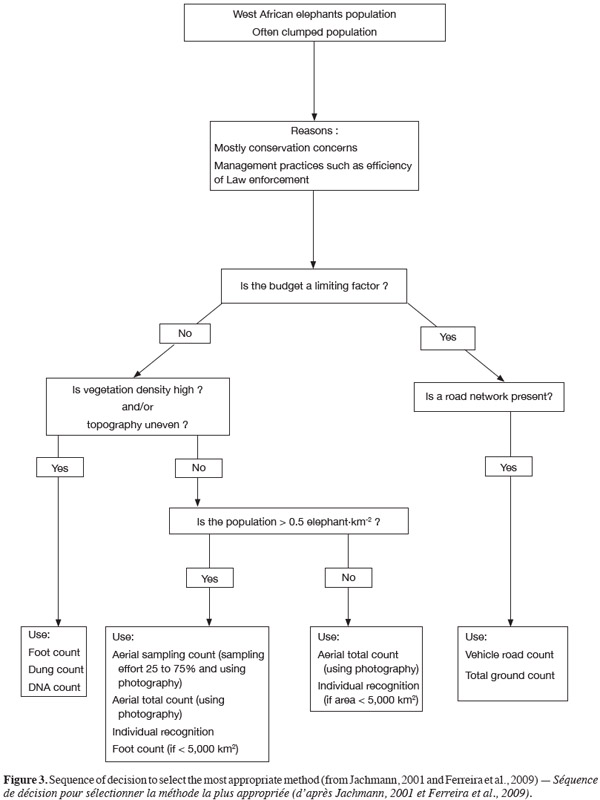
56We suggest a sequence of decisions to help design surveys (Figure 3). This sequence makes use of existing information as well as the level of financial resources and habitat and objectives of a survey. After defining the reasons for which such count should be implemented, the user must respond to one question at each step. From the answer to the question (by yes or no), this figure will guide the user to the next one. The figure helps the user to choose the most appropriate method for his study area taking into account the available resources, the habitat, and the global elephant density (from previous surveys).
7. Conclusion
57In large West African savannahs with a predominantly open vegetation and a flat landscape, aerial surveys will remain the best alternative to count elephants (Jachmann, 1991). Despite the undeniable advantages (cost, easy navigation, low logistic, etc.), classic 20% sampling effort’s aerial sampling counts of small elephant population (< 0.5 elephant·km-2) return low precision and accuracy figure (Table 3) rarely appreciated by local wildlife managers. Precision can be improved using stratification. However to reach a precision equivalent to a 95% confidence interval of 10% of the estimate, it will require an effort, thus a cost, equivalent to those of an aerial total count (Norton-Griffiths, 1978). On the other hand, very few aircrafts are fitted with radar-altimeter in West Africa. Therefore the flight height’s bias cannot be assessed. In the West African context, aerial sampling appears quite poorly adequate to count low-density elephant populations. As the low densities population drop, it is unlikely to detect changes in numbers before several years or decades (Ferreira et al., 2009). In the same time these populations could collapse (Bouché et al., 2011).
58Despite the impossibility to measure error and high cost in absolute value, aerial total count returns relatively accurate results if the technical requirements are respected (Table 1). However elephant has a low rate of increase (Ferreira et al., 2009). Elephant counts can reasonably be implemented each 3 to 5 years to minimize yearly costs and anticipate logistic issues. Aerial total counts’ results are appreciated by local wildlife manager. It gives them a clear figure to bring decisions and to implement various management options.
59Foot count is a useful method if it could be expected a sufficient dataset (60 to 80 observations minimum) from a single count to produce a reliable estimate. Unfortunately this never occurred in West Africa. The combination of several yearly surveys in land-locked areas (no migration) such as Nazinga Game Ranch could help to produce precise results. This method should be recommended only to small areas (< 5,000 km2).
60Acknowledgements
61The authors would like to thank the Benin, Burkina Faso and Niger authorities for their authorization to conduct surveys. Surveys led by the author were implemented through CITES-MIKE Program and funded by European Union and the Kingdom of Belgium.
Bibliographie
Barnes R.F.W., 1996. Estimating forest elephant abundance by dung counts. In: Kangwana K., ed. Studying elephants. Technical handbook no 7. Nairobi: African Wildlife Foundation, 38-48.
Barnes R.F.W., 1999. Is there a future for elephants in West Africa? Mammals Rev., 29, 175-199.
Barnes R.F.W., 2002. The problem of trend detection posed by small elephant populations in West Africa. Afr. J. Ecol., 40, 179-185.
Bell R.H.V., Grimsdell J.J.R, Van Lavieren S.P. & Sayer J.A., 1973. Census of the Kafue Lechwe by aerial stratified sampling. Afr. J. Ecol., 11, 55-74.
Blanc J.J. et al., 2007. African elephant status report 2007: an update from the African elephant database. Gland, Switzerland: IUCN/SSC African Elephant Specialist Group.
Bouché Ph., 2002. Elephant survey in Mole National Park. Report of the aerial survey. Ouagadougou: CITES-MIKE, Wildlife Division Ghana.
Bouché Ph. & Lungren C.G., 2004a. Les petites populations d’éléphant du Burkina Faso. Statut, distribution et déplacement. Pachyderm, 37, 85-91.
Bouché Ph. & Renkens D., 2004b. Suivi de la faune de la zone cynégétique de Konkombouri. Décembre-Mai 2004. Rapport n°PMZCK/2004/02. Ouagadougou : Burkina Safari Club.
Bouché Ph., Lungren C.G., Hien B. & Omondi P., 2004c. Recensement aérien total de l’écosystème W-Arly-Pendjari-Oti-Mandouri-Kéran (WAPOK). Bénin, Burkina Faso, Niger, Togo : CITES-MIKE, ECOPAS, PAUCOF.
Bouché Ph., Lungren C.G. & Hien B., 2004d. Recensement aérien total de l’écosystème Po Nazinga Sissili (PONASI). Ouagadougou : Ministère de l’Environnement et du Cadre de Vie, CITES-MIKE.
Bouché Ph., 2007a. III. Les éléphants du Ranch de Gibier de Nazinga. In : Delvingt W. & Vermeulen C., eds. Nazinga. Gembloux, Belgique : Les Presses Agronomiques de Gembloux, 259-268.
Bouché Ph., 2007b. Northern Ghana elephant survey. Pachyderm, 42, 58-69.
Bouché Ph. et al., 2011. Will elephants soon disappear from West African savannahs? PloS ONE, 6(6), e20619, doi:10.1371/journal.pone.0020619.
Buckland S.T., Anderson D.R., Burnham K.P. & Laake J.L., 1993. Distance sampling: estimating abundance of biological populations. London: Chapman and Hall.
Clerici N. et al., 2007. Increased isolation of two Biosphere Reserves and surrounding protected areas (WAP ecological complex, West Africa). J. Nat. Cons., 15, 26-40.
Cornélis D., 2000. Analyse du monitoring écologique et cynégétique des populations des principaux ongulés au Ranch de Gibier de Nazinga (Burkina Faso). Mémoire DEA : Faculté universitaire des Sciences agronomiques de Gembloux (Belgique).
Craig C.G., 2004. Aerial survey standards for the MIKE Programme. Nairobi: CITES-MIKE.
Douglas Hamilton I., 1972. On the ecology and behaviour of the African elephant. PhD thesis: University of Oxford (United Kingdom).
Douglas-Hamilton I., 1996. Counting elephants from the air – Total counts. In: Kangwana K., ed. Studying elephants. Technical handbook no 7. Nairobi: African Wildlife Foundation, 28-37.
Eggert L.S., Eggert J.A. & Woodruff D.S., 2003. Estimating population sizes for elusive animals: the forest elephants of Kakum National Park, Ghana. Mol. Ecol., 12(6), 1389-1402.
Ferreira S.M. & van Aarde R.J., 2009. Aerial survey intensity as a determinant of estimates of African elephant population sizes and trends. S. Afr. J. Wildl. Res., 39(2), 181-191.
Gaidet-Drapier N. et al., 2006. Cost and efficiency of large mammal census techniques: comparison of methods for a participatory approach in a communal area, Zimbabwe. Biodivers. Cons., 15, 735-754.
Hien B., Doamba B. & Ouedraogo A., 2003. Rapport du recensement pédestre des mammifères diurnes au Ranch de Gibier de Nazinga. Ouagadougou : Ministère de l’Environnement et du Cadre de Vie.
Ipavec A. et al., 2007. Elephant movement in W Regional Park, Western Africa. Pachyderm, 43, 36-42.
Jachmann H., 1991. Evaluation of four survey methods for estimating elephant densities. Afr. J. Ecol., 29, 188-195.
Jachmann H., 1996. Direct counts of elephant from the ground. In: Kangwana K., ed. Studying elephants. Technical handbook no 7. Nairobi: African Wildlife Foundation, 49-56.
Jachmann H., 2001. Estimating abundance of African wildlife: an aid to adaptive management. Boston, USA: Kluwer Academic Publishers.
Jachmann H., 2002. Comparison of aerial counts with ground counts for large African herbivores. J. Appl. Ecol., 39, 841-852.
Krebs C.J., 1999. Ecological methodology. 2nd ed. Menlo Park, CA, USA: Adison Wesley Longman.
Lungren C.G & Bouché Ph., 2005. Schéma général d’aménagement pour la sécurisation des habitats et des parcours de la faune du Parc Régional du W. Bénin, Burkina Faso, Niger: ECOPAS, UE.
Mbugua S., 1996. Counting elephants from the air – Sample counts. In: Kangwana K., ed. Studying elephants. Technical handbook no 7. Nairobi: African Wildlife Foundation, 21-27.
Moss C.J., 1996. Getting to know a population. In: Kangwana K., ed. Studying elephants. Technical handbook no 7. Nairobi: African Wildlife Foundation, 58-74.
Nakandé A., Belem A.M.G., Nianogo A.J. & Jost C., 2007. Conflits hommes-éléphants dans la Réserve Partielle de Pama, Burkina Faso. Pachyderm, 42, 81-91.
Norton-Griffiths M., 1978. Counting animals. 2nd ed. Technical handbook no 1. Nairobi: African Wildlife Foundation.
Ouédraogo M. et al., 2009. Estimation des effectifs des populations d’éléphants (Loxodonta africana) par la méthode d’inventaire pédestre total au ranch de Nazinga (Burkina Faso). Pachyderm, 45, 57-66.
Pennycuick C.J., 1973. The shadowmeter: a simple device for controlling an aircraft’s height above the ground. E. Afr. Wildl. J., 11(1), 109-112.
Pennycuick C.J. & Western D., 1972. An investigation of some source of bias in aerial transect sampling of large mammal populations. E. Afr. Wildl. J., 10(1), 175-191.
Roth H.H. & Douglas-Hamilton I., 1991. Distribution and status of elephants in West Africa. Mammalia, 55(4), 489-527.
Rouamba P. & Hien B., 2002a. Recensement aérien de la faune sauvage dans la Réserve de la Biosphère de la Pendjari. Cotonou : Ministère du Développement Rural, CENAGREF.
Rouamba P. & Hien B., 2002b. Recensement aérien de la faune sauvage dans l’Ecosystème le Parc transfrontalier du « W ». République du Bénin, Burkina Faso, République du Niger Programme Régional Parc – W (ECOPAS) ; FED.
Sinsin B., 2000. Dénombrement de la faune dans la Réserve de la Biosphère de la Pendjari. Avril 2000. Cotonou: PCGPN, CENAGREF, GTZ.
Sinsin B., 2001. Dénombrement de la faune dans la Réserve de la Biosphère de la Pendjari. Avril 2001. Cotonou: PCGPN, CENAGREF, GTZ.
Taylor B.L. & Gerrodette T., 1993. The uses of statistical power in conservation biology: the vaquita and the Northern spotted owl. Conserv. Biol., 7, 489-500.
Whitehouse A.M., Hall-Martin A.J. & Knight M.H., 2001. A comparison of methods used to count the elephant population of the Addo Elephant National Park, South Africa. Afr. J. Ecol., 39, 140-145.
Para citar este artículo
Acerca de: Philippe Bouché
Univ. Liège - Gembloux Agro-Bio-Tech. Unité de Gestion des Ressources Forestières et des Milieux naturels. Passage des Déportés, 2. B-5030 Gembloux (Belgium). E-mail : ph_bouche@yahoo.com
Acerca de: Philippe Lejeune
Univ. Liège - Gembloux Agro-Bio-Tech. Unité de Gestion des Ressources Forestières et des Milieux naturels. Passage des Déportés, 2. B-5030 Gembloux (Belgium.
Acerca de: Cédric Vermeulen
Univ. Liège - Gembloux Agro-Bio-Tech. Unité de Gestion des Ressources Forestières et des Milieux naturels. Passage des Déportés, 2. B-5030 Gembloux (Belgium).
