1 Introduction
Ti21S is a metastable β titanium alloy that has wide use in the aviation industry. It exhibits high strength, good resistance to corrosion, and good performance at high temperature. Sheet forming process is commonly used in the manufacturing of many components in aerospace [1]. The onset of necking during forming is usually described by the Forming Limit Curve (FLC). This curve is a standard method to characterize the formability of sheet metals and is used to avoid the failure of materials while the manufacturing process [2][3]. The experimental determination of forming limit curves is complex and two tests are generally performed: out-of-plane stretching such as Nakazima test [4] and in-plane stretching such as Marciniak test [5]. M-K model is also presented as an analytical method to calculate the forming limit curves [6].
The processing of materials can affect the mechanical properties, and then modify the forming limit curve through the change of microstructure. The mechanical anisotropy is also proved to have a main influence on formability [7]. As an example, cross rolling reduces the anisotropy and then improves the formability of pure titanium [8]. β titanium alloys show good formability in the solution heat treated and quenched state, but it is reduced after aging because of α phase precipitation that improves the strength and reduces the ductility [9]. Data about FLC of β titanium alloys are scarcely reported [10] while this knowledge is crucial to predict the forming of such alloys. The link between FLC and microstructure was also never investigated in β titanium alloys.
This work aims to study the formability of the Ti21S alloy with two different microstructures obtained after different heat treatments. Tensile tests on two different microstructures and several directions from the rolling one are then conducted to obtain mechanical properties, including the Lankford coefficients. A numerical M-K model is used to predict forming limit points from the results of tensile tests. Then the complete predicting FLC can be plotted after calibrating the M-K model to investigate the effect of microstructure.
2 Experimental procedure
The as-received Ti21S rolled plate has a composition of Ti-15Mo-2.7Nb-3Al-0.2Si (wt. %) and a thickness of 0.8 mm. A solution treatment at 900°C (above β transus temperature) for 30 min, followed by water quenching is first performed. An aging treatment in the α+β domain at 650°C for 8 hours followed by furnace cooling is made for some of the solution treated pieces. Tensile specimens with a central gauge of 45×5 mm2 are machined for these 2 conditions (Fig. 1 a): solution treated and quenched state (Ti21S ST) and solution treated and aged state (Ti21S STA). In order to investigate the effect of anisotropy, tensile specimens are cut along the rolling direction (L) and the transverse direction (T). Specimens are labeled with the tensile orientation followed by their heat treatment condition (Ti21S L,ST and Ti21S T,ST as examples). Supplemental specimens cut with an angle of 45° to the rolling direction of the Ti21S ST condition are also tested in order to calculate anisotropy yield stress ratios. For each condition, 3 to 5 specimens are tested in order to ensure the representativeness of results. Tensile tests are carried out on INSTRON-3345 testing machine at room temperature with an initial strain rate of 10-3s-1. A random pattern is spayed on the surface of the sample and a camera is set for filming this specimen surface during the tensile test in order to calculate in-plane deformations (Fig. 1).
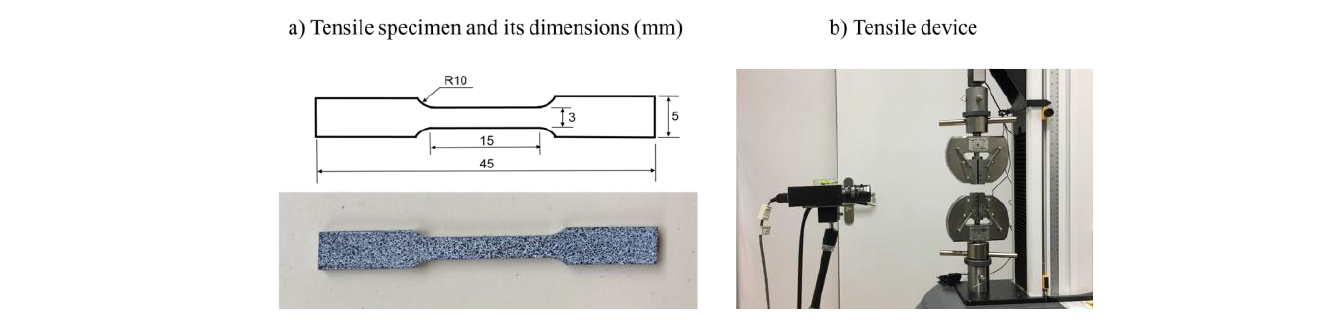
Fig. 1 Tensile specimens and device.
Uniaxial tensile tests are also used to determine one forming limit point on the forming limit diagram. In order to precisely measure the deformation, Digital Image Correlation (DIC) is conducted on the tensile specimens with the GOM software. The evolution of deformation in three sections (Fig. 2 a), along the longitudinal direction of the specimens, can be plotted just before rupture. Due to the necking, a rising part on the curve is observed. Just after, rupture happens at the position with the highest major deformation. Two inner boundary points A and B (Fig. 2 b) are defined according to the position of the necking zone. Besides, the width (Wl and Wr) of two fit windows needs to be adjusted. Then, an inverse parabola of a quadratic equation is used to fit the points in the two fit windows. The highest point on the inverse parabola gives the limit major strain ε1. The corresponding limit minor strain ε2 is calculated by following the strain path in the necking zone. For each specimen, the average forming limit strains are calculated with the three sections. By this method, a limit point can be added to the forming limit diagram.
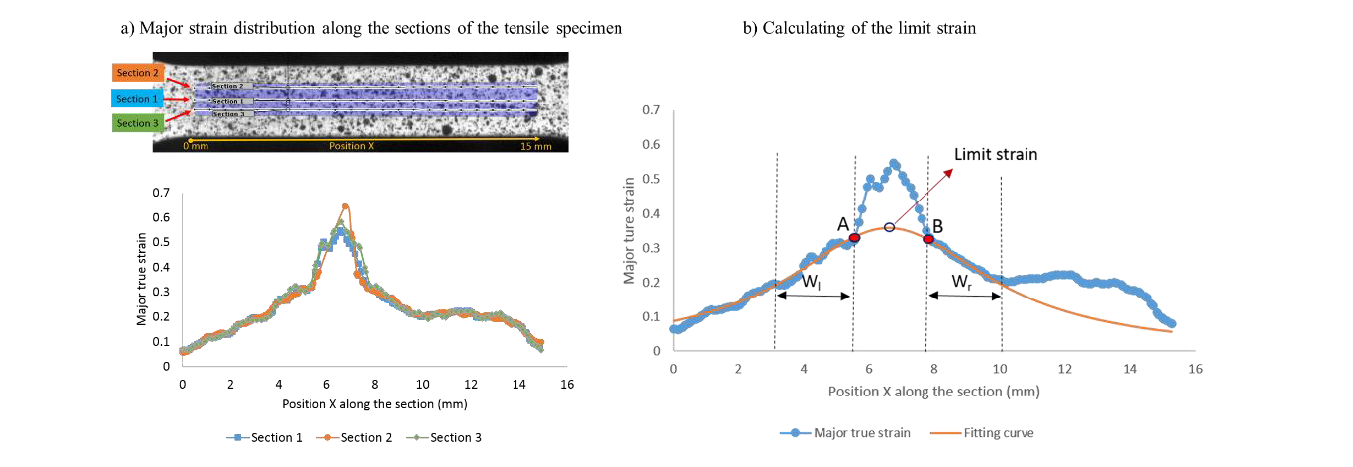
Fig. 2 Method of detecting forming limit point.
Lankford coefficients (rθ) are also evaluated by the DIC method. 5 points along the previous sections are chosen. Strain components ε1 and ε2 along longitudinal and transverse directions are calculated. These Lankford coefficients are calculated over a range of about 50% to 75% of εmax (Fig. 3 a). Incompressibility equation (ε1 + ε2 + ε3 = 0) is used to calculate the strain component ε3 through the specimen thickness. Then, the curve ε2 versus ε3 can be plotted for each point as shown in Fig. 3 b where an average over the 5 chosen points has been performed. The slope of the fitting line of the average curve ε2 versus ε3 is the r value (Fig. 3 b). This method significantly reduces the noise when the deformation is small. Values of r0 , r45 , r90 are calculated through the tensile specimens with the angle of 0°, 45°, and 90° to the rolling direction.
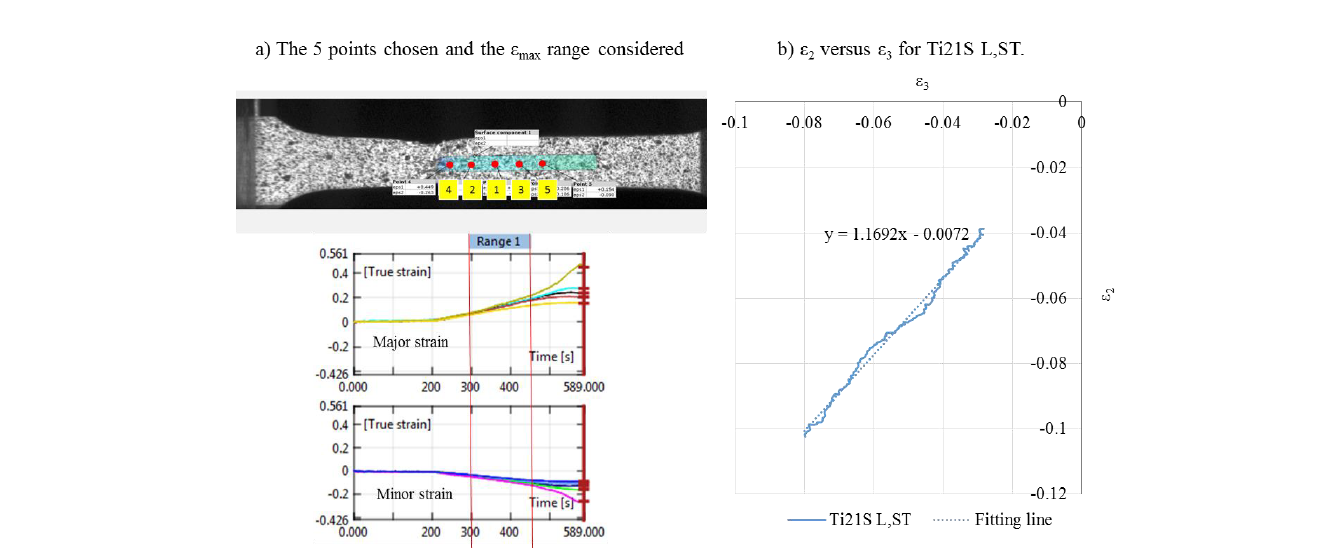
Fig. 3 Method of calculating r value.
3 Results and discussions
3.1 Mechanical properties
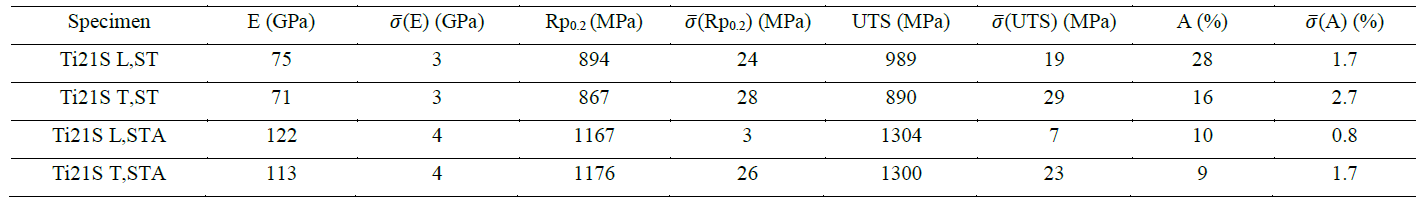
The comparison of tensile curves of Ti21S ST and Ti21S STA along L and T directions is shown in Fig. 4. The Young's modulus (E), Yield Strength (Rp0.2), Ultimate Tensile Strength (UTS), Elongation (A), and their Standard deviations (σ̅) are summarized in Table. 1.
For Ti21S ST specimens, each value along L direction is higher than along T direction, except for the Young's modulus, which is nearly the same for both directions. On the contrary, Ti21S STA specimens do not show this phenomenon. This observation highlights an anisotropy in mechanical properties for the ST condition.
After the aging process, Ti21S STA specimens show an increased tensile strength compared to the Ti21S ST condition. The ultimate tensile strength is increased from 989 MPa to 1304 MPa (L), or from 890 MPa to 1300 MPa (T). Young's modulus also increased evidently. But the elongation of Ti21S STA is less than 10%, while Ti21S ST has 16% and 27%. The images of fractured specimens in Fig. 4 show that there is merely no necking near the crack for STA specimens, while few necking appears in ST specimens. The cracks are also perpendicular to the rolling direction for STA specimens. All these features of STA specimens are due to the well-known hardening effect and fragilizing effect of α phase precipitation [11].
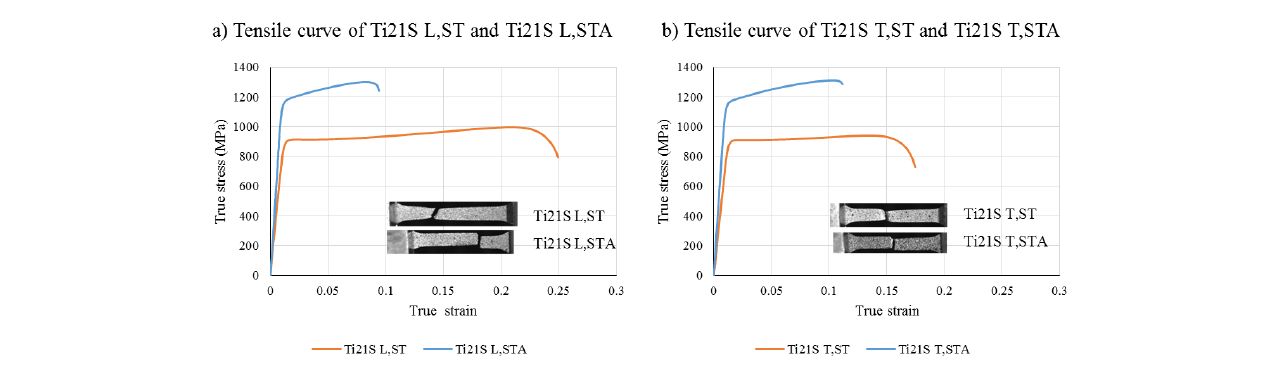
Fig. 4 Comparison of tensile curves; insets show typical specimens after fracture for each condition.
Table. 1 Young's modulus (E), Yield Strength (Rp0.2), Ultimate Tensile Strength (UTS), Elongation (A) and their Standard deviation (σ̅) of Ti21S ST and Ti21S STA.
In order to characterize more precisely the mechanical anisotropy of the Ti21S ST material, r-values are calculated and are shown in Table. 2. The r-value at 45° is lower than the others and r90 is slightly higher than r0.
Table. 2 The r-values of Ti21S ST.

3.2 Formability
The result of forming limit points of Ti21S ST and Ti21S STA are plotted in Fig. 5. The formability of specimens strained along transverse direction (T) is lower than that along the rolling direction (L) no matter Ti21S ST or Ti21S STA. There is a huge difference between the formability of Ti21S ST and Ti21S STA. The low tensile strength and large elongation lead to high formability. The Ti21S STA has excellent tensile strength while has poor elongation, as well as poor formability.
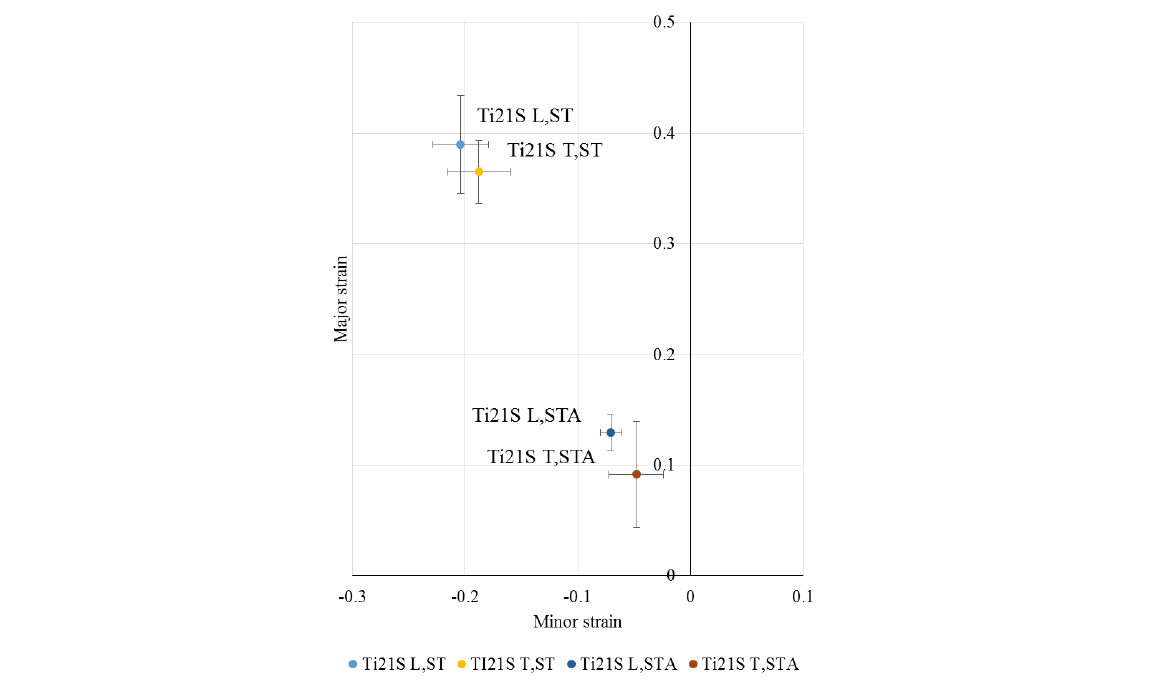
Fig. 5 The forming limit points of Ti21S alloy at various conditions.
3.3 Simulation
A finite element (FE) model of the M-K analytical model is built with the ABAQUS software by referring to the model proposed by Zhang [12]. As shown Fig. 6 a, the concept of the M-K model is based on a sheet with an initial thickness e0a (zone a) in which is defined an imperfection materialized by a central groove located symmetrically in the sheet thickness. The thickness of the sheet at the groove (zone b) is noted e0b. Here, the direction of the groove is kept perpendicular to the direction of the major strain (direction 1, Fig. 6 a). The initial imperfection factor is defined as f0 =e0b/e0a. Different displacements (u,v) are applied on the boundaries, respectively along the directions 1 and 2, for simulating different strain paths.

Fig. 6 M-K model applied in simulation to predict the forming limit curve of Ti21S alloy.
Fig. 6 b shows the dimensions of the FE model used in this study. For reasons of symmetry, only one eighth of the model is defined. The model is meshed by hexahedral elements with an approximate global size of 2 mm. The influence of the groove orientation on the predictive left hand side of the forming limit diagram is not considered in this study. Influence of anisotropy on the results remains very low for this material.
The Ludwick law is chosen to model the hardening behavior of the Ti21S [13]:

Where σ̅ is the equivalent stress, ε̅ is equivalent plastic strain. σ0, K, n are material parameters calibrated from the experimental curve σ̅ = f (ε̅) obtained from a uniaxial tensile test for the considered conditions (Fig. 4 a). Table 3 presents the values of these material parameters for Ti21S L,ST and Ti21S L,STA. The choice of the hardening law, especially the value of the slope near the necking limit strains, can have an influence on the predictive results. The predictive hardening behavior with the Ludwick’s law is very good for moderate and high strains.
Table. 3 Parameters of Ludwick’s hardening law for Ti21S L,ST and Ti21S L,STA.

For Ti21S STA, an isotropic von-Mises yield criterion is assumed, while for Ti21S ST, an anisotropic quadratic yield criterion (Hill48) is considered:

Where σij is the stress components, F, G, H, L, M, and N are the material parameters defined by anisotropy parameters R11, R12, R22, R13, R23 and R33. These values are calculated from Lankford coefficients rθ through the formulations below when assuming R11 = R13 = R23 = 1 :

Then the anisotropy parameters calculated of Ti21S ST are: R11=1, R12=1.17, R22=1.03, R13=1, R23=1 and R33=1.04.
The imperfection factor f0, is calibrated in order to predict the forming limit point corresponding to the experimental one obtained from the uniaxial tensile test for each material. Then the whole FLC can be predicted with a constant imperfection factor f0 for Ti21S ST and for Ti21S STA. The results are shown in Fig. 7 for the different conditions.
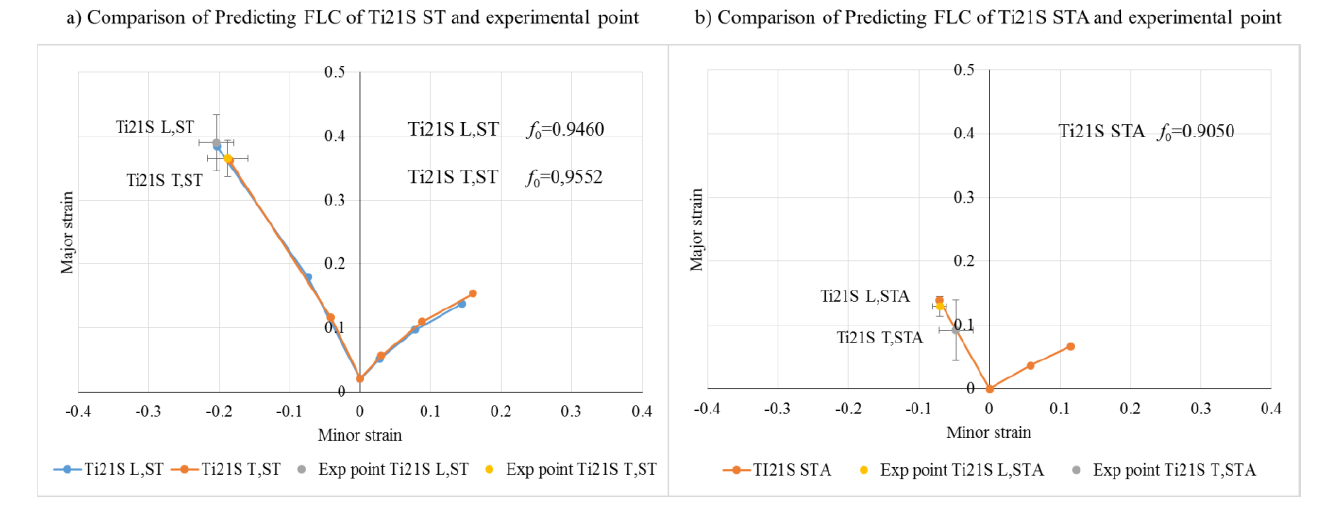
Fig. 7 The predicting FLC and the experimental point of Ti21S ST and Ti21S STA conditions.
With this method, f0 values obtained for Ti21S L,ST , Ti21S T,ST and Ti21S STA are respectively 0.9460, 0.9552 and 0.9050. Each value of f0 represents the feature of the corresponding microstructure. It can be considered as a parameter of the material. The comparison of f0 values of ST and STA conditions (Fig. 7 a and Fig. 7 b) shows that solution treatment state (Ti21S ST) leads to a larger imperfection factor f0 (less defects) than aged state (Ti21S STA). The calibration of the imperfection on the longitudinal (Ti21S L,ST) and transverse (Ti21S T,ST) directions leads to fairly close imperfection factors (0.946 and 0.9552). These values are consistent with the experimental values of the limit strains (slightly higher formability for the longitudinal direction compared to the transverse one). On the right part of FLC, a smaller f0 reduces the formability. For all the predictions, the formability of the plane strain state is very low.
3.4 Fracture analysis
SEM observations are conducted on the fracture surface of tensile specimens for each condition. Fractographies of Ti21S ST (L and T) specimens show a fracture with a flat surface with large size dimples (Fig. 8 a and b), showing a transgranular fracture. Fractographies of Ti21S STA specimens conversely show very small and shallow dimples with some visible grains (Fig. 8 c and d). The fracture is then intergranular in Ti21S STA specimens. That is why STA specimens have a lower ductility. This change in fracture mechanism after ageing treatment is clearly due to the precipitation of α phase.
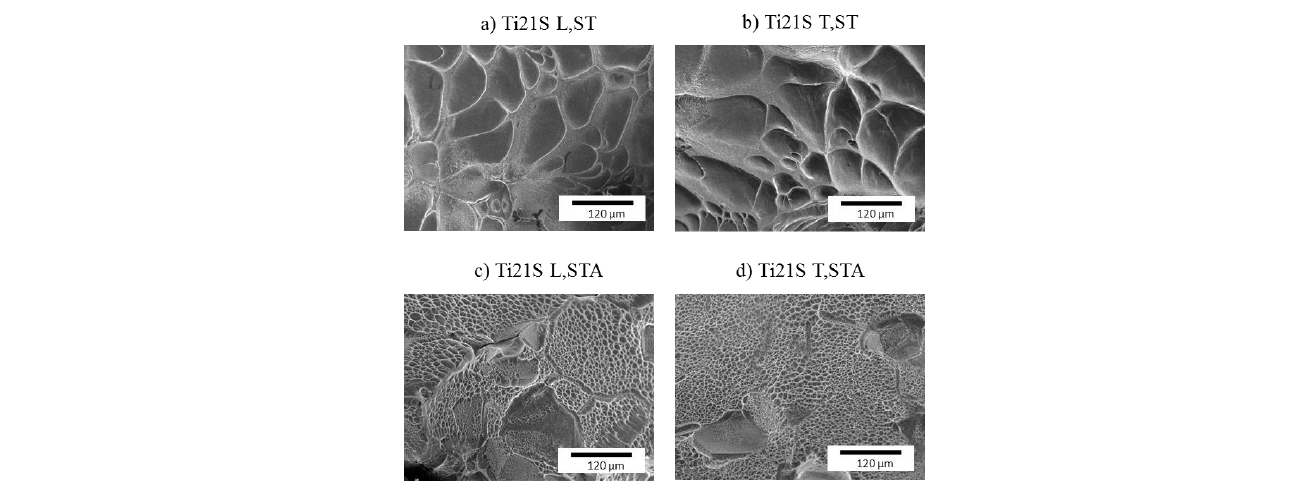
Fig. 8 SEM fractographies of Ti21S ST and Ti21S STA specimens.
4 Conclusions
The effect of microstructures on the formability of Ti21S has been investigated. Several conclusions can be drawn:
1. The formability calculated for the tensile specimens along the longitudinal direction is better than for the transverse direction. The aging treatment (STA) drastically lowers the formability compared to the solution treatment state (ST). This phenomenon can be attributed to the precipitation of α phase in the STA condition.
2. The simulation with M-K model can predict FLC with the effect of microstructure. The Ti21S ST has a larger imperfection factor f0 than Ti21S STA. We can suppose that the material Ti21S ST in the solution treatment state (ST) has less defect than the aged state (STA) when considering the formability. Meanwhile, the imperfection factor in the longitudinal direction is less than the transverse direction.
3. The Ti21S ST has a transgranular fracture and large size dimples, showing a ductile fracture, which is beneficial to the formability. The Ti21S STA has an intergranular fracture and small shallow dimples which highlight a fragile fracture inducing a poor formability.
Acknowledgements
C. Hu acknowledges the China Scholarship Council (CSC) for his Ph.D financial support. The authors also acknowledge the SCANMAT platform of the University of Rennes for providing access to SEM facilities.
