1 Introduction
Tube hydroforming (THF) is a plastic tube forming process, which has become widely practiced in automotive and aerospace industries owing to its higher performances (e.g. part consolidation, weight reduction and lower springback) compared to conventional stamped and welded assemblies. The THF process principle is to apply inner pressure to expand the tube against a pre-defined shape die to produce various cross-sectional forms. Commonly, axial forces are applied to increase the material flow into the hydroformed part and then improve the tube formability. The free bulge hydroforming process is considered as the simple tube hydroforming test used to analysis the process, to assess the formability and to identify tubular material properties for the THF process. The analysis of THF, using either analytical or numerical approaches are based on deterministic methods, where the different parameters are assumed constant and equal to their nominal values [1, 2]. However, it is known that material characteristics and manufacturing processes present scattering or inherent noises that are expensive or difficult to vanish, which may have significant influence on the process reliability and performance of products quality. As an alternative, statistical approaches are a helpful techniques, which take account of the variability of the process input parameters, and their effects could be then predicted on the desired output responses. Moreover, sensitivity analysis determines the most relevant parameters that influence the process and then less influent parameters could be neglected and the higher sensitive parameters effects are then monitored.
The parameter variability should be regarded within the probability concepts. It should be first identified, then reduced and finally controlled to diminish its negative effects on process reliability. Indeed, some reliability analyses studies have been performed on THF and on sheet metal forming processes [3-6]. In this study, the influence of uncertainty in process parameters is considered to establish a model for predicting this influence on the process response. Simple free tube hydroforming test will be used to illustrate the effect of input variable uncertainty on pressure at the tube failure.
2 Free tube hydroforming test
The free tube hydroforming test consists in deforming plastically a thin-walled tube by applying an inner pressurized fluid within the tube, where the tube-ends are clamped to avoid the fluid leakage. Fig.1 shows the principle of the free tube hydroforming test. The tube is placed between two dies spaced out by a distance L, which is the length of the bulging zone and where the tube is freely expanded. The die entrance radius Rd is equal to 7.5 mm. The studied tube has an external diameter of 50 mm. The pressure was continuously increased until the tube fracture and the resultant bulged height at the apex was recorded against the pressure evolution. The fracture was obtained at about 6 mm of bulge height, which corresponds to a maximum thinning of 20% at bursting failure. The tubular material is a mild steel tube S235 and the experimental conditions are referred in [7].
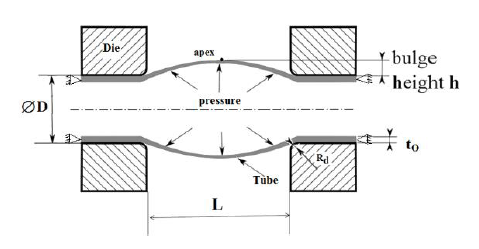
Fig. 1. Principle of the free tube hydroforming test with clamped tube-ends
Numerical simulations of the free tube hydroforming test were carried out using DD3IMP (Deep-Drawing IMPlicit) in-house FE code [8]. Due to material and symmetry conditions, only one-eighth of the mechanical model was simulated. The tube is discretized with eight node hexahedral solid elements, associated with a selective reduced integration technique to avoid volume locking. A total of 3120 elements were used, with two layers of elements along the thickness to accurately describe the through-thickness stress gradients. The contact with friction is described by Coulomb’s law, and the friction coefficient between the tube and the die is assumed equal to zero for simplicity, since the tube’s extremities are clamped and in such case, the insignificant displacement of the tube along axial direction makes the small existing friction between the tube/die has a negligible effect on results at the apex of the bulged area. The elastic behaviour of the tubular material is described by generalised Hooke’s law, where the Young’s modulus and the Poisson’s ratio are set equal to 210 GPa and 0.30, respectively. The plastic behaviour is described by the Swift strain hardening law coupled with the Hill’48 yield criterion by assuming planar isotropy and under an associated flow rule. The average simulation time was about 5 minutes (Intel® Core™i7–8700K 6-Core processor @ 3.7 Ghz).
The following variables were considered as uncertain factors of the free tube hydroforming process: yield stress (Y0), strength coefficient (K), strain hardening exponent (n), Lankford coefficient (r), initial tube thickness (t0) and bulged length (L). The uncertainty of each of these variables is assumed to follow a normal distribution. The mean (μ) and standard deviation (σ) values of each variable are detailed in Table 1; the coefficient of variation (σ/μ) is assumed equal to 2.5%. A total of 49 simulations were carried out according to a Box-Behnken design of experiments, with 6 input variables (Y0, K, n, r, t0, and L) and 3 levels each (lower, middle and upper levels) [9], to predict the relationships between the uncertain input variables and the pressure corresponding to a bulge height of 6 mm (i.e. in which tube fracture occurs under experimental conditions). In this regard, Table 1 also presents the DoE levels of each variable under study, where mean values μ correspond to those of the middle level of each variable. The values of the lower and upper levels of each variable were assumed equal to those corresponding to two standard deviations from the mean value, μ ± 2σ (see Table 1), so that 95% of each input variable is contained in the design.
Table 1. Mean and standard deviation values for each of the normally distributed input variables, where the mean values of the material parameters were obtained from [10]; the lower and upper levels of the design variables are also shown (the mean level corresponds to the mean values of the design variables)
|
Y0 [MPa] |
K [MPa] |
n |
r |
t0 [mm] |
L [mm] |
|
|
Mean, μ |
367.65 |
722.70 |
0.384 |
1.20 |
1.07 |
60.0 |
|
Std. dev., σ |
9.175 |
18.068 |
0.0096 |
0.03 |
0.0268 |
1.5 |
|
Lower level |
348.65 |
686.56 |
0.365 |
1.14 |
1.016 |
57.0 |
|
Upper level |
385.35 |
758.83 |
0.403 |
1.26 |
1.123 |
63.0 |
In all numerical simulations, the tube external diameter is supposed constant, however its initial thickness is an uncertain variable; in addition, the die radius is supposed fixed (Rd =7.5 mm). Fig. 2 presents the experimental and numerical simulation results of pole height vs. pressure of the free tube hydroforming test. It is shown that the Box-Behnken simulation results (49 solid grey lines) presents a broader range of variation than the experimental data (solid red points), also covering it. Fig. 2 also presents a numerical simulation curve (solid black line) obtained from the mean values of the variables (see Table 1), which is considered as a reference curve obtained under a deterministic analysis approach.
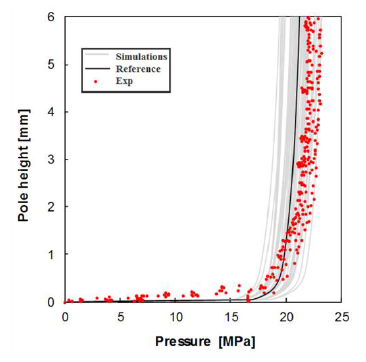 Fig. 2. Pole height versus pressure curves obtained from the Box-Behnken design simulations (gray solid lines) and the experimental response (solid red points); the reference curve (black solid line) is also presented
3 Response surface model of the pressure
The Surface Response Methodology (RSM) is among the surrogate models that are typically used to approximate the relationship between input variables and process responses; it is expressed as a quadratic polynomial function, where the coefficients are identified by regression methods. RSM model is usually fitted using data generated from FE simulation based on a chosen design of experiment technique. The use of FE is necessary when the explicit relationship between the input variables and the process output response is unavailable or complicate to derive and costly to compute. Thus RSM surrogate model or an approximation relationships between input and output variables in a defined range of variable space is an effective solution. Eq. 1 represents the quadratic surface response function to under analysis:

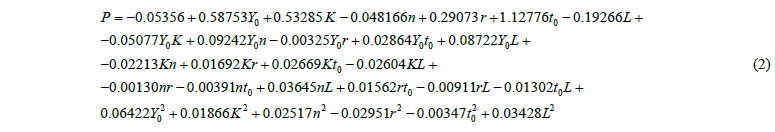
where P(x) is the pressure predicted by the RSM model for a given set of six input variables x, and 𝛽0, 𝛽𝑖 , 𝛽𝑖𝑗 and 𝛽𝑖𝑖 are the regression coefficients. The fitted function of the process response (pressure for 6 mm bulge height) is given in Eq. 2.
It should be mentioned that the regression coefficients in Eq. 2 are determined by considering the normalized values of the input variables and the output response, which are calculated as follows:

where x̅, xU, and xL refer to the mean value, the upper and the lower levels of input variable x, respectively (see Table 1). P̅ and Std_dev represent the mean value and standard deviation of the pressure. The aim of normalizing the input and output variables is to obtain the same magnitude values for better accuracy of the fitted RSM model. Fig. 3a shows the good correlation between the numerical pressure and the predicted pressure by the fitted RSM model. The correlation coefficient R2 is equal to 0.997, which indicates that the fitted equation Eq. (2) is an appropriate surrogate model to map the relationship between the input variables and the output process response within the range of variation of the input parameters. The sensitivity analysis (ANOVA) was performed to allow extracting the most significant input variables, and the effect of their interactions on the response, which is the bursting pressure. The significance of each input variable is determined using p-value for the F-distribution test at 95% confidence interval. In fact, the analysis of variance that was performed on the quadratic response model showed that the most statistically significant terms are the six linear terms and two interaction terms (Y0n and Y0L), having p-values below 0.05, as shown in Fig. 3b. It is observed from this variance analysis that the tube initial thickness is the most influent variable; however, the strain hardening exponent has lower effect on the bursting pressure. Since the quadratic terms are not statistically significant, a linear response surface model is sufficient to represent accurately the analytical relationship between the input variables and the response within the range of variability of the inputs. It should be noted that ANOVA is based not only on the magnitude of the regression coefficients, but also on the variance of its residuals. In this sense, coefficients having a relatively high magnitude may or may not be statistically significant (depending on the variance of residuals).
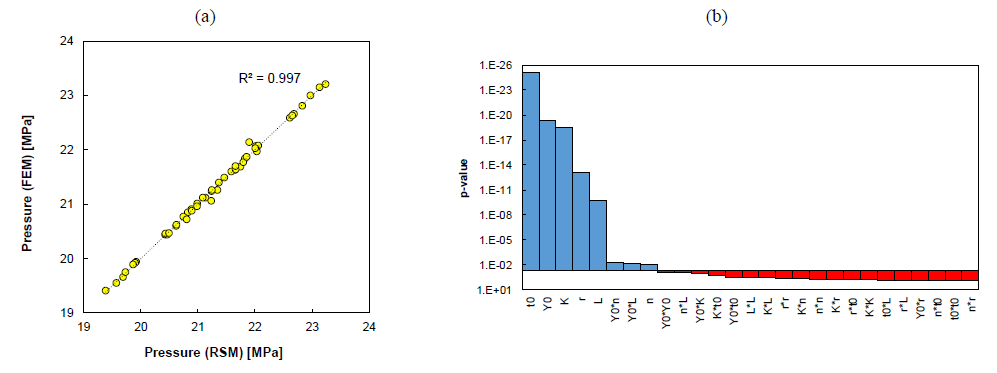
Fig. 3. (a) Correspondence between the pressure obtained using FEM simulation and the pressure predicted by Eq. 2; (b) analysis of variance results (blue columns indicate statistically significant terms, with p-values<0.05, as opposed to red columns)
Eq. 2 is now used to expeditiously predict the variability in the pressure response. Accordingly, 10,000 random sets of input variables were generated by integrating Monte Carlo simulation with the assumption of normal distribution probability. The values of each set of variables were used as input for Eq. 2, to obtain the corresponding pressure values. Fig. 4 presents the variability results of bursting pressure predicted by the RSM metamodel. The predicted variability follows a normal distribution, with μ = 21.26 MPa and σ = 0.68 MPa, also shown in Fig. 4. Moreover, the value of the reference burst pressure (i.e. obtained from the mean values of the input variables under a deterministic analysis approach – see Table 1) is equal to 21.27 MPa, and therefore a negligible difference between this value and the mean value (21.26 MPa) is observed. Finally, the experimentally measured bursting pressure ranges between 21.77 MPa and 22.90 MPa (see Fig. 2 and Fig. 4), and therefore the probability that the metamodel predicts pressure values in this range is 22%. It is worth to note, that it should be expected that the most probability of the bursting pressure obtained taking into account of the uncertainty of the input variables and its effect of the process response (bursting pressure). However, the range of the experimental bursting pressure probability is located to the right of the most probable predicted pressure. This can be related to the constitutive model (Hill quadratic planar isotropy yield criterion) used to describe the plastic behaviour of the free tube hydroforming test. In fact, flexible yield criterion (e.g. non quadratic models) are more suitable for better description of the bulge height vs. internal pressure response of free THF [7]. The purpose of choosing such yield criterion to describe the plastic behaviour of the free THF process was to simplify the analysis and to more focus on the effect of input parameters variability on the process response and the probability to of permissible maximal pressure achieved to attain the tube failure.
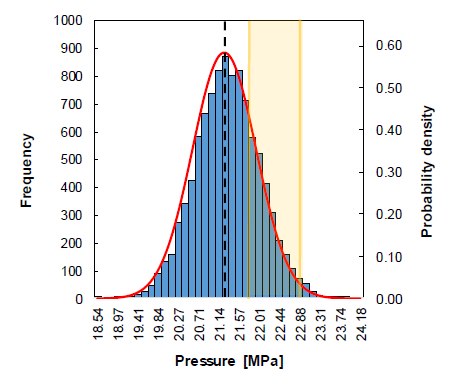
Fig. 4. Burst pressure histogram generated from the RSM model (Eq. 2), using 10,000 random sets of input variables; the corresponding normal probability density function is also shown (red solid line). The black dashed line indicates the reference burst pressure value (obtained from the mean values of the variables – see Table 1), and the yellow area indicates the experimentally measured range of bursting pressure
4 Conclusion
In this paper, the effect of variability of six design variables (yield stress Y0, strain hardening exponent n, strength coefficient K, anisotropy coefficient r, initial tube thickness t0, and bulge length L) on the process response (bursting pressure, P) was statistically analysed for the free tube hydroforming process. A Box-Behnken design of experiments was chosen to define a matrix design for these variables in the interested space and then finite element simulation of the free tube hydroforming test was performed to generate 49 design points. These points were used to fit a surrogate model (quadratic surface response) to relate the input variables with the process response. Based on a variance analysis, it was shown the initial tube thickness (t0) is the most statistically significant variable, whereas the strain hardening exponent (n) is the least statistically significant variable. To avoid the onerous task of running huge number of FE simulations, the Monte Carlo simulation was implemented and using the response surface model to predict the probability of the failure pressure, which is equal to (P =21.26 ± 0.68) MPa, assuming that the input variables follow a normal distribution (defined by mean value and standard deviation). In future work, further investigation will be focused on variability analysis using more flexible constitutive models for tube hydroforming processes.
Acknowledgements
This research is sponsored by FEDER funds through the program COMPETE – Programa Operacional Factores de Competitividade and by national funds through FCT – Fundação para a Ciência e a Tecnologia, under the project UIDB/ 00285/2020. It was also supported by the project RDFORMING (reference PTDC/EME-EME/31243/2017), co-funded by Portuguese Foundation for Science and Technology, by FEDER, through the program Portugal-2020 (PT2020), and by POCI, with reference POCI-01-0145-FEDER-031243. Both supports are gratefully acknowledged.
