1 Introduction
Conventionally, in mechanical material characterization, standard tests (e.g. uniaxial tensile, uniaxial compression, shear, biaxial tests) are employed. The main drawback of those tests is evident when a material model has an increasing number of parameters, which implies an increased difficulty to measure them in well-suited experiments [1]. An attractive alternative is available by testing a heterogeneous strain field test, where the surface strains/displacements are measured with techniques like Digital Image Correlation (DIC). By using this approach, at least in principle, the determination of parameters from a single test is possible.
In this regard, it is essential to design a heterogeneous strain field specimen in a way to enable reliable parameter identification. There have been many attempts to design and identify material parameters from a single heterogeneous test. According to the comprehensive review paper by Pierron and Grédiac [2], these tests can be classified into four groups based on the progression of sophistication. These are designed by intuition, design by strain state, design by identification quality, and design by full identification simulation. While the specimen design led by intuition (e.g. [3–6]) relies mainly on experiences of an originator, a design-by-strain state naturally incorporates the idea of using strain state as a design variable [7–9]. This concept combines as many as possible different strain states in the specimen design to improve sensitivity and consequently to improve identification.
However, the diversity of strain state is not the only limiting factor in the specimen design. Souto et al. [10,11], for example, additionally introduced the span of a particular strain mode as an indicator. It also accounts for plastic strain distribution, which should be as extensive as possible to achieve the richness of information in the case of elastoplastic models. While the indicator is a model-independent strain-based measure, it should also somehow account for the strain field sensitivity to the model's parameters, especially when performing an inverse identification procedure. To evaluate the sensitivity, one may calculate the influence of a material's model parameter variation on the resulting strain field and may assess the information carried by the strain field. But the price to pay is that the approach is time-consuming due to many calculations of parameters' variations. By using this measure, different heterogeneous specimen designs can be compared. Lecompte et al. [12,13], for example, compared sensitivities of two different specimen geometries for identification of elastic orthotropic lamina: a regular cruciform specimen and a cruciform specimen with a central hole drilled in the middle. The purpose of the latter is to enhance the heterogeneous deformation field. They found that the regular geometry shows less variance in the identified parameters than results obtained with the open-hole specimen even though the open-hole shape has higher sensitivity around the hole.
This paper aims to compare different specimen designs from the viewpoint of the whole identification chain, starting from DIC systems' measurement uncertainties (i.e. bias and random error) quantification to its propagation throughout the identification chain, resulting in a confidence interval assessment. In our approach, we analyzed and accounted for real uncertainty data, processed from prior measurements spanning over three years, without any classification of the experiment types. As the uncertainty quantification accounts for the system's resulting uncertainties, without examining their origin or characteristics, it does not, however, accounts for the propagation of these uncertainties during the specimen loading. Furthermore, we used the obtained system’s uncertainties to compare confidence intervals for parameters of a linear orthotropic elastic material model, when different heterogeneous tests, ranging from simple uniaxial, open-hole, notched, T-shaped, simple shear, and bending, are used in the identification procedure.
2 Methodology
The purpose of this paper is to assess, how the systems' measurement uncertainties (i.e. the system random error and bias) affect parameters’ confidence intervals assessment when analysing different heterogeneous specimens. To tackle this, we employed a methodology in which we (i) assess the optical system’s random error and system bias, (ii) analyse how the errors propagate throughout the identification chain, resulting in a confidence interval assessment.
2.1 Error assessment of existing measurements from DIC archive
The first step in the confidence interval assessment is an evaluation of the measurement uncertainties associated with our DIC equipment. To get the most realistic information about measurement uncertainty, we evaluated the system’s uncertainty from our existing measurements taken in the past three years with no particular interest in the experiment type. After mounting a heterogeneous specimen with a speckle pattern in the testing machine, we acquire a series of images with the DIC measurement system. Let us emphasize that in this step, there is no load applied to the specimen. Therefore, we know that the measured displacements should be zero. When evaluating the images with DIC, we get the full-field measured displacements in longitudinal (Fig.1a) and in the transverse direction (Fig.1b). As we know that there should be no displacement, we can treat the measured values as the error of the displacement measurements. To use this information in further analysis, we assess the probability density distribution of x and y displacements/errors. We found that we can closely approximate the distribution of measurement error with a normal distribution N(μ, σ) (c.f. Fig. 1c, Fig. 1d).
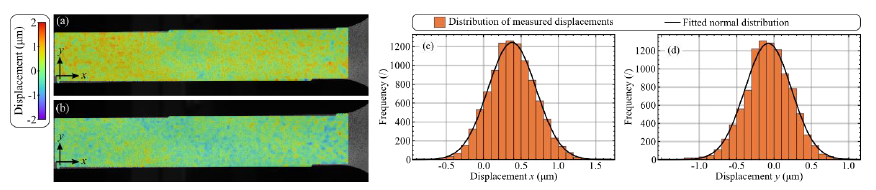
Fig. 1. DIC error processing: a), b) spatial distribution of displacement measurement error in and direction, c), d) histograms of the spatial error distribution
To assess the error distribution that is more realistic to the measuring system, we reviewed all our existing measurements. In all cases, measuring results were obtained using the same DANTEC Dynamics Q-400 DIC measuring system. The system consists of two 2 Mpx digital cameras with 35 mm focal length lenses, a synchronization time box, and software Istra 4D (DANTEC Dynamics) for image processing. The image speckle pattern consisted of a matt white background with matt black dots, which were for all specimens prepared by using an airbrush. Each measurement contained several thousand measuring points. They take into account most of the uncertainty causes, for example, non-ideal speckle pattern, changes in lighting conditions, some optical distortions, camera noise, camera misalignment, calibrations conditions of the DIC system, different subset size, and also possible user errors. We processed 850 individual measurements from our private archive, without any classification of experiment type. We took into account all experimental setups like a standard uniaxial, open hole, notched, three/four-point bending specimen tests, and others. To include this information in further analyses, we took the displacements from the start of each measurement and calculated the mean μi and standard deviation σi, separately for x and y displacement fields.
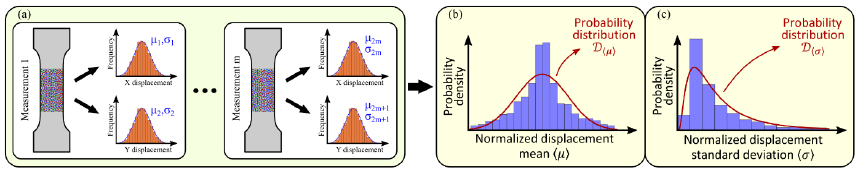
Fig. 2. Assessment of DIC measurement errors based on prior experiments
Next, from populations of means μi and standard deviations σi for all measurements, we created two histograms of probability distributions of both estimators. Because different experimental arrangements were set with different experimental setups, which include various Fields Of View (FOV), we normalized the calculated mean 〈μi〉=μi/hi and standard deviation 〈σi〉=σi/hi of each measurement errors with the largest dimension of the FOV hi. As a result, we get two populations of the normalized means and normalized standard deviations of errors. Their probability density distributions are shown in histograms in Fig. 2b and Fig. 2c, respectively. Furthermore, the distribution of the mean errors is symmetrical over the zero value, which confirms that the likelihood of samples not being loaded in the observed moment is the highest. The final step is to approximate the calculated distributions with a probability distribution law, so we can use information from the past three years in the Monte Carlo simulations (MCSs) for generating the measurement errors of synthetic experiments. The approximation of the probability distribution of the normalized means of the errors D〈μ〉 is a normal distribution with mean -4x10⁻⁷ and standard deviation 178x10-7. Furthermore, the approximation of the standard deviations of the errors D〈σ〉 is a log-normal distribution with the mean and standard deviation parameters -12.2 and 0.81, respectively.
2.2 Error propagation throughout the identification chain
In this section, we present a methodology that estimates the propagation of the system’s bias and random error (quantified in the previous section) throughout the identification chain. To achieve this, we first conducted the calculation of uncertainties of the material parameters by using MCSs, where, in each repetition, new errors εi are generated based on the distributions from the previous section. For each Monte Carlo iteration i, we randomly sample the normalized mean 〈μ〉 and standard deviation 〈σ〉 from the approximated probability distributions D〈μ〉 and D〈σ〉. After scaling those with the height of FOV, we get the mean and standard deviation for the current iteration. Since in our case, DIC full-field displacement measurements closely follow N(μ, σ), we use the distribution to generate displacement errors ε of the entire field. In the next step, we investigate, how this randomly generated error ε propagates throughout the Finite Element Model Updating (FEMU) identification method resulting in the confidence interval assessment. To exploit the influence of random error and the system's bias ε on the identified parameters θ̃̃, let us investigate, how small data perturbations affect the model's parameters. With the approach similar to Mathieu et al. [14], we obtain the following relationship:

where J presents parameter sensitivity matrix, obtained from the FEM model. It should be emphasized, that in our case the sensitivity matrix J is obtained numerically, by variation of the parameters θ̃. In the final step, the equation is evaluated in the MCSs, from where a population of parameter variations Δθ is obtained. From this population, a confidence interval is assessed as the standard deviation of the population.
3 Results
The presented methodology, which includes MCSs for a determination of confidence intervals of inversely identified material parameters considering full-field displacement measurements, will be demonstrated on 10 common specimens from the literature (Fig. 3). They were used to identify parameters for different constitutive models (some for elasticity models, others for plasticity), but we will take advantage of their geometry and make an investigation of appropriateness for identification of elastic material properties for orthotropic linear elasticity model. Based on this, we compare these designs in terms of the uncertainty of each identified parameter.
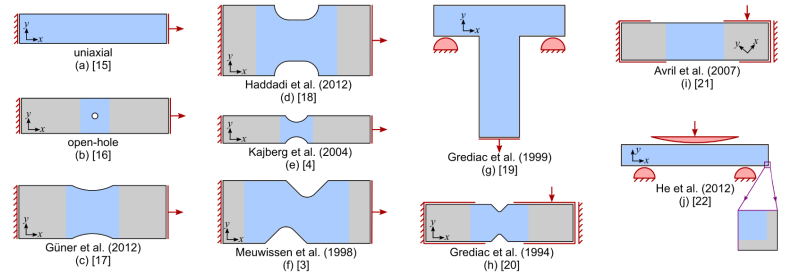
Fig. 3. Considered specimens: a) standard uniaxial tensile test specimen [15], b) open-hole specimen [16], c) notched specimen [17], d) notched specimen [18], e) notched specimen [4], f) S-shaped specimen [3], g) T-shaped specimen [19], h) Iosipescu shear specimen [20], i) Iosipescu shear specimen [21], bending test specimen [22]
All specimens are 2.5 mm thick unidirectional Carbon/epoxy composite, reported in Rossi and Pierron [23]. Material is modelled as an orthotropic linear elastic material, with material parameters being four engineering elastic constants θ = {Exx, Eyy, Gxy, υxy}, with optimal values given in [23]. Therefore, we search for the confidence intervals of those parameters: Δθ = {ΔExx, ΔEyy, ΔGxy, Δυxy}. Experiments were simulated by Finite Element Method (FEM) using ABAQUS/Standard. Approximately 26 000 2D continuum plane stress linear elements CPS8 were used to simulate the specimen deformation under plane stress condition. The boundary conditions and loads are illustrated in Fig. 3 in red. The load is in all experiments a vertical force, applied either through a kinematic coupling to the respected boundary surface or on a rigid tool. For the MCSs, we need the sensitivity matrix J, which contains derivatives of displacements with respect to material parameters. They are calculated by a forward finite difference method using Python scripts and ABAQUS. The values of derivatives are calculated in the region of interest (blue regions in Fig. 2), which represents the FOV in DIC measurements, exported from ABAQUS to Wolfram Mathematica, where the MCSs are calculated. Let us note that DIC cannot measure the edge region of the specimen, therefore we also excluded the derivatives from a thin section, which runs alongside the boundaries. The width of this section corresponds to 17 px, when the 2 Mpx cameras acquire images of the predicted region of interest. This yields approximately a width of 0.7% of the height (major dimension) of the field of view h. MCSs are applied to each of the presented experiments. The result is a large population of identified variations of material parameters Δθ.
Means and standard deviations for all specimens are shown in Fig. 4 using bar charts for each specimen and each material parameter. Fig. 4 shows that in almost all cases means are rather small, but the differences in standard deviations are significant. Let us now analyse the reasons for differences among experiments. Elastic modulus Exx has the narrowest confidence interval in a standard uniaxial test (a), corresponding to the predominant uniaxial loading state (longitudinal direction). Similar experiments for the identification of Exx are the ones with predominant axial stress, which corresponds to the specimens from (b) to (f). T-shaped specimen (g) perform best for the identification of elastic modulus Eyy because in these experiments the applied load provokes states in the specimen, which include pronounced loading in the transverse direction. On the contrary, the pure uniaxial (a) and open-hole experiment (b) exhibit enormous uncertainty, which is the consequence of negligible transverse stresses. Poisson's ratio would be best identified with pure uniaxial or notched specimens corresponding to the dominant uniaxial loading state in the majority of the FOV. The Iosipescu shear tests after Grediac et al. [20] and Avril and Pierron [21] perform best for shear modulus identification because the shear stresses are most predominant. Confidence intervals with off the chart values also reveal that some experiments are not convenient for the identification of those parameters and that the identification cannot give reliable values.
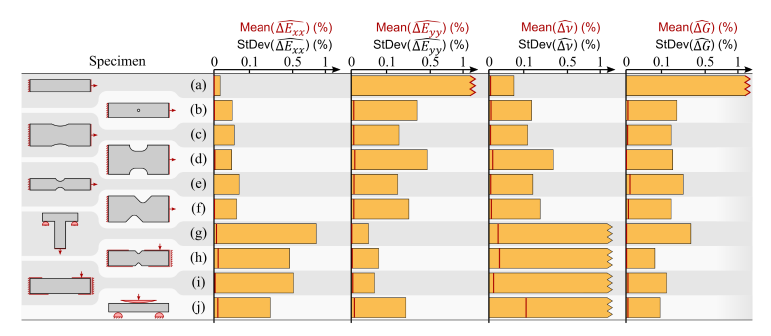 Fig. 4. Calculated means and standard deviations of material parameters (serrated edges represent off-the-chart values)
Mesh discretization and parameter variation can introduce some numerical error which affects sensitivity matrix calculation. We examined both influences by decreasing mesh size for a factor four and varying the parameters for 30% off from the used values. The analyses showed preservation of the ratio between means and standard deviations of the parameters, meaning that the appropriateness of individual specimen designs for the identification of particular material parameters is maintained.
4 Conclusions
We monitored the uncertainty data processed from the DIC system in the past three years for over 850 heterogeneous test measurements, without any classification of the experiment types. For each heterogeneous test, we analyzed uncertainty from a pair of pictures taken before a specimen loading. From the images, we analyzed the error distribution of the measured displacement field, which closely follows the normal distribution with a specific mean value and standard deviation. The process was repeated for all 850 tests, from where a set of mean values and standard deviations was obtained. From the sets new distributions were constructed, where it was found, that the mean value and standard deviation closely follow a normal and log-normal distribution, respectively. Furthermore, we investigated how quantified uncertainties propagate throughout the FEMU-based identification procedure, resulting in a confidence interval assessment. For this reason, we firstly analyzed the influence of DIC data perturbations on model parameters, where the parameter sensitivity matrix plays the central role, which is unique to a heterogeneous test design and loading configuration. Secondly, to assess the parameters’ confidence intervals, we conducted MCSs to simulate the optical system error propagation throughout the identification chain. Finally, we compared 10 different heterogeneous specimen designs from the viewpoint of characterized optical system error propagation throughout the orthotropic elastic material parameters’ identification chain.
The methodology enables the assessment of individual parameters' confidence intervals and the intensity of a DIC bias and random error propagation through the inverse identification procedure. The results reveal the appropriateness of individual specimen designs for the identification of particular material parameters.
Acknowledgements
The authors acknowledge the financial support from the Slovenian Research Agency (research core funding No. P2-0263).
