1. Introduction
Sheet metal forming processes are among the most common and important metal working operations associated with the automotive, aeronautics and metalworking industries. Finite Element Analysis (FEA) is a well-established tool to predict the deformation processes and the factors limiting the formability of the components, and thus reducing the time and costs associated with the development and optimization of sheet metal forming processes. The traditional application of FEA is based on a deterministic approach that does not take into account the uncertainty that inevitably arise in a real industrial environment. Col [1] indicated that these uncertainties can be related with the variability in the material behaviour, process conditions, forming tools, lubrication and other random sources. Li [2] stated that these uncertainties have a significant influence in the quality of the formed component, leading to unreliable and non-robust solutions, and to the eventual rejection of the component. For these reasons, the stochastic modelling and uncertainties quantification of sheet metal forming processes are of current industrial interest.
In recent years, several researchers have modelled the influence of the uncertainty sources on the final product variability, by resorting to Monte Carlo method [3, 4], design of experiences techniques [5, 6] and metamodels [7, 8]. The application of any of these methods requires the run of several numerical simulations of the forming process with distinct input values, in order to evaluate the variability of the forming results. Sensitivity analysis is generally coupled with these methods to quantify the influence of each source of uncertainty in the variability of the forming results. In sheet metal forming processes, different types of sensitivity analyses have been applied, such as variance-based methods [9], regression [10], derivative-based methods [11] and methods based on experimental designs [6].
In this work, a quasi-Monte Carlo method and a variance-based sensitivity analysis (Sobol’s indices [12]), will be used to numerically evaluate the influence of the uncertainties associated with 11 input parameters (elasticity properties, hardening law parameters, anisotropy coefficients, blank thickness, friction coefficient and the blank holder force) in the stamping results variability of a square cup [13]. The effect of the uncertainty in these input parameters is evaluated in the punch force, equivalent plastic strain, thickness reduction and geometry of the cup. The stochastic analysis will allow to rank the influence of each uncertainty source in the forming results and to identify the regions of the square cup more affected by the inputs uncertainty. With this knowledge it is expected to identify the uncertainty factors that most affect the results in different regions of the cup, and that are essential to control in order to guarantee product conformity with the intended requirements. Additionally, this work intends to fill the lack of research studies associated with the variability of the square cup benchmark, which is one of the most used test cases [7, 14–17].
2. Stochastic Model
2.1 Numerical Model
The numerical model of the Square Cup forming process is shown in Figure 1. The geometry of the tools was based on the benchmark of the conference NUMISHEET’ 93 [13]. In this process, a constant blank holder force (𝐵𝐻𝐹) is applied to control the material flow. Then, the punch is moved until a total displacement of 40 mm is reached. After that, the tools are removed, promoting the springback of the square cup. Due to material and geometric symmetries, and to reduce the computational cost, only a quarter of the model is simulated. The square blank has an initial thickness 𝑡0, and a side length of 75 mm. The blank is discretized with a total of 1800 (8-node hexahedral solid) elements, with 2 elements in thickness and 30 elements in each side. The contact between the blank and the tools is described by the Coulomb’s law with a constant friction coefficient, 𝜇0. The tools were modelled using Nagata patches [18]. The simulations were carried out with the in-house code DD3IMP (Deep Drawing 3D Implicit Code) [19]. All the numerical simulations were performed on computers equipped with an Intel® Core™ i7–8700K Hexa-Core processor (4.7 GHz). The average computational time of each numerical simulation was 4 minutes and 34 seconds.
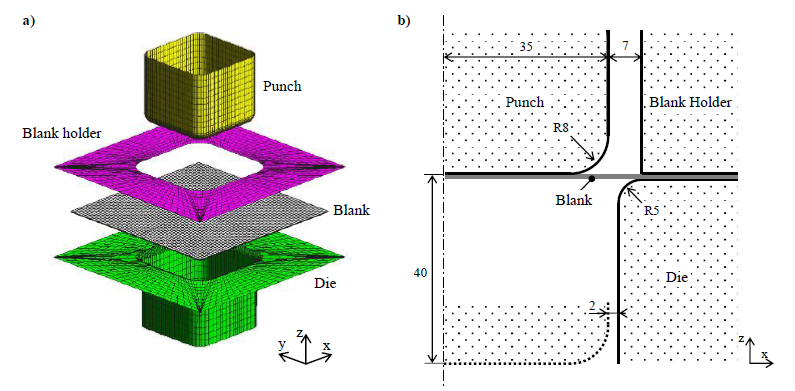 Fig. 1. Square cup forming process (a) Numerical model [20]; (b) Dimensions of the tools in mm
The constitutive model of the sheet assumes that: (i) the elastic behaviour is isotropic and is defined by the generalized Hooke’s law, where the Young’s modulus, 𝐸, and the Poisson’s ratio, 𝜈, are elasticity parameters; (ii) the plastic behaviour is described by the orthotropic Hill’48 yield criterion and the Swift isotropic hardening law. The Hill’48 yield criterion is defined by the following equation:

where 𝜎𝑥𝑥, 𝜎𝑦𝑦, 𝜎𝑧𝑧, 𝜏𝑥𝑦, 𝜏𝑦𝑧 and 𝜏𝑥𝑧 are the components of the Cauchy stress tensor defined in the orthotropic coordinate system of the material (Oxyz); 𝐹, 𝐺, 𝐻, 𝐿, 𝑀 and 𝑁 are anisotropy parameters and 𝑌 is the yield stress. The parameters of the Hill’48 criterion follow the condition 𝐺+𝐻=1, and so the yield stress, 𝑌, is comparable to the uniaxial tensile stress along the rolling direction of the sheet. The parameters 𝐿 and 𝑀 were set to 1.5, as in isotropy (von Mises). The parameters 𝐹, 𝐺, 𝐻 and 𝑁 can be obtained from the anisotropy coefficients 𝑟0, 𝑟45 and 𝑟90, through the following relations:

The yield stress evolution during deformation, 𝑌=𝑌(𝜀̅𝑝), is described by the Swift hardening law:

2.2 Input and Output Parameters
A DC06 steel sheet is used in this work, the values of the material coefficients, namely 𝐸, 𝜈, 𝑛, 𝐶, 𝑌0, 𝑟0, 𝑟45 and 𝑟90, are assumed to follow a normal distribution with mean, 𝜇, and standard deviation, 𝜎, whose values are indicated in Table 1 [21]. Besides that, it is also assumed uncertainty in the blank thickness, 𝑡0, friction coefficient, 𝜇0, and blank holder force, 𝐵𝐻𝐹. These values are also assumed to follow a normal distribution with mean and standard deviation values given in Table 1 [21].
Table 1. Mean and standard deviation values that characterizes the normal distribution of each input parameter [21]
|
E [GPa] |
𝜈 |
𝑛 |
𝐶 [MPa] |
𝑌0 [MPa] |
𝑟0 |
𝑟45 |
𝑟90 |
t0 [mm] |
𝜇0 |
BHF [N] |
|
|
𝜇 |
206.00 |
0.300 |
0.259 |
565.32 |
157.12 |
1.790 |
1.510 |
2.270 |
0.780 |
0.1440 |
2450.0 |
|
𝜎 |
3.85 |
0.015 |
0.018 |
26.85 |
7.16 |
0.051 |
0.037 |
0.121 |
0.013 |
0.0288 |
122.5 |
The influence of the input parameters uncertainty was evaluated for four numerical results, the punch force (𝑃𝐹), the equivalent plastic strain (𝜀̅𝑝), the thickness change (𝑇𝐶) and the geometry change (𝐺𝐶). The 𝑃𝐹 and the 𝜀̅𝑝 values are directly given by the simulation software. The 𝑇𝐶 and the 𝐺𝐶 are defined as follows:

Where 𝑡0 is the initial thickness value, 𝑡𝑓 is the final thickness value of a given cross section; (𝑥̅𝑓,𝑦̅𝑓,𝑧̅𝑓) is the final position of a given node for the numerical simulation with the mean values of the input parameters (see Table 1), and (𝑥𝑓,𝑦𝑓,𝑧𝑓) is the final position of the same node but for the numerical simulations with uncertainty in the input parameters. In this way, 𝐺𝐶 quantifies the positional difference of a given node between the deterministic simulation (i.e., with the mean input values) and the simulations with uncertainty in the input parameters. 𝜀̅𝑝, 𝑇𝐶 and 𝐺𝐶 are assessed for all the nodes of the simulation in order to evaluate the variability on these outputs for the different regions of the square cup. The 𝑃𝐹 values are assessed for several displacements of the punch, up to the final punch displacement of 40 mm.
2.3 Variability in the forming results
A quasi-Monte Carlo method was used to evaluate the variability of the forming results. This method was coupled with Sobol sequence to generate the sample of input parameters [22]. This sequence allows a faster convergence when compared to random sampling [23]; and the possibility of easily increase the sample size [24], if necessary. A sample size of 3000 simulations of the square cup was chosen. This value guarantees the convergence of the output statistical measures used in this work (mean and standard deviation of the forming results).
The mean and standard deviation of the 𝑃𝐹 values along the punch displacement are shown in Figure 2. Figure 3 presents the mean and standard deviation values of the forming results, 𝜀̅𝑝, 𝑇𝐶 and 𝐺𝐶, along the square cup. Both figures show that the mean and standard deviation results have similar distributions/trends. In fact, the critical regions, with large mean values of equivalent plastic strain, thickness reduction and geometry change, are also the regions that are more affected by the uncertainty in the input parameters. In this sense, the input parameters uncertainty can be a significant factor in the success of the forming process. The coefficient of variation (i.e., 𝜎/𝜇) for the points were the mean values of 𝑃𝐹, 𝜀̅𝑝, 𝑇𝐶 and 𝐺𝐶 are maximum, are equal to 5.02%, 3.12%, 4.87% and 56.75%, respectively. Based on these coefficients of variation, it can be concluded that the 𝐺𝐶 is the result more affected by the uncertainty in the input parameters. Figure 3 shows that the flange and wall of the square cup are the regions most influenced by the uncertainty in the input parameters. In contrast, the bottom of the cup is the region less influenced by the uncertainty in the input parameters, probably due to the small deformations and springback that occur in this region.
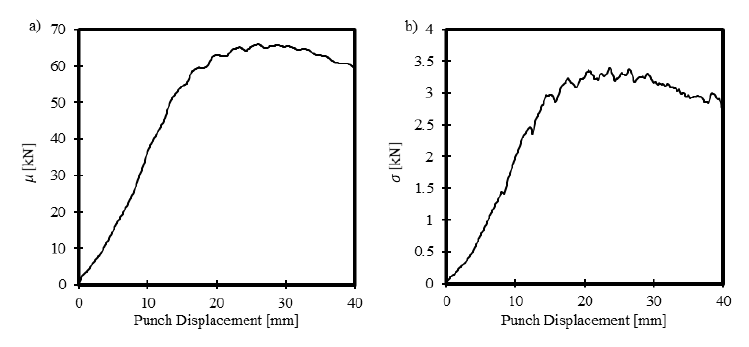
Fig. 2. Evolution of the: a) mean and b) standard deviation values of the punch force (𝑃𝐹), along the punch displacement
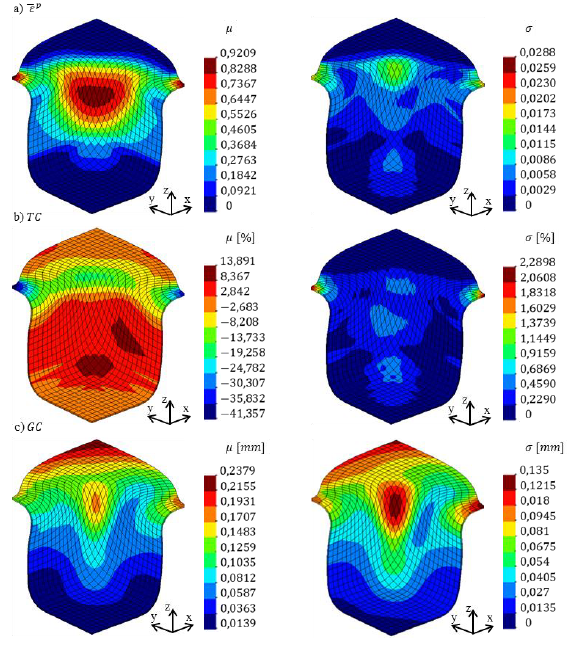 Fig. 3. Mean and standard deviation of the forming results: a) 𝜀̅𝑝, b) 𝑇𝐶 and c) 𝐺𝐶
3. Sensitivity analysis
3.1 Sobol’s Indices
In order to evaluate the input parameters that most influence the forming results, a variance-base sensitivity analysis is carried out in this section. In specific, Sobol’s indices will be used to quantify this influence. These indices are defined as follows [12]:

where 𝑉(𝑈) is the unconditional variance of the result 𝑈, and 𝑉[𝐸(𝑈|𝑋𝑖)] is the conditional variance of the expected value of 𝑈 when all input parameters, but 𝑋𝑖, are fixed. This equation defines the 1st order index, 𝑆𝑖, which quantifies the individual influence of each input parameter, 𝑋𝑖, on the result 𝑈. In addition to 1st order indices, it can also be defined total sensitivity indices, 𝑆𝑖𝑇, as follows [12]:

where 𝑉[𝐸(𝑈|𝑋~𝑖)] is the conditional variance of the expected value of 𝑈 when the input parameter 𝑋𝑖 is fixed. The total sensitivity indices, 𝑆𝑖𝑇, quantify not only the individual influence of each input parameter, 𝑋𝑖, on the result 𝑈, but also the influence of the interactions between the input parameter 𝑋𝑖 and the remaining, on the result 𝑈. The influence of the interactions between input parameters, 𝑖𝑛𝑡, is evaluated by:

where 𝑘 is the total number of input parameters.
The indices 𝑆𝑖 and 𝑆𝑖𝑇 are numerically evaluated, according to the method proposed in [25]. To improve the stabilization of the indices, by this method, the estimators proposed in [26] were used. A base number of 3000 simulations was used in this work, which implies 36000 additional simulations to evaluate the sensitivity indices for the 11 input parameters. The stabilization of the indices values occurs for a base number of approximately 1000 simulations.
3.2 Sensitivity for the maximum values of the forming results
This section presents the main results of the sensitivity analysis for the maximum values of the forming results, 𝑃𝐹𝑚𝑎𝑥, 𝜀̅𝑝𝑚𝑎𝑥, 𝑇𝐶𝑚𝑎𝑥 and 𝐺𝐶𝑚𝑎𝑥. For each of these results, the 1st order indices, 𝑆𝑖, for the 11 input parameters and the index, 𝑆𝑖𝑛𝑡, associated with the interactions between these parameters, were evaluated. Figure 4 shows these indices for the maximum values of the forming results. It can be concluded from this figure that:
-
the uncertainty in the hardening parameters, 𝐶 and 𝑛, and the blank thickness 𝑡0, is responsible for over 90% of the variability in the 𝑃𝐹𝑚𝑎𝑥 values;
-
the uncertainty in the hardening parameter 𝑛, and the anisotropy coefficients, 𝑟90 and 𝑟45, is responsible for about 90% of the variability in the 𝜀̅𝑝𝑚𝑎𝑥 and 𝑇𝐶𝑚𝑎𝑥 values;
-
the uncertainty in the anisotropy coefficient 𝑟90 and in other input parameters with strong interactions is responsible for about 80% of the variability in the 𝐺𝐶𝑚𝑎𝑥 values;
-
the uncertainty in the input parameters, 𝐸, 𝜈, 𝑌0, 𝜇0 and 𝐵𝐻𝐹 has a small individual influence in the results, although the interactions between these and other parameters can show a significant effect in the variability of the 𝐺𝐶𝑚𝑎𝑥 values. The study of each of these interactions will not be part of this work as it would require a huge computational cost.
3.3 Maximum Sensitivity Indices per region
This section presents an evaluation of the input parameter that most influences the forming results 𝜀̅𝑝, 𝑇𝐶 and 𝐺𝐶, in each region of the square cup. Figure 5 shows the input parameters whose 1st order index is maximum for each node of the square cup, on the forming results 𝜀̅𝑝, 𝑇𝐶 and 𝐺𝐶. From this figure it can be concluded that:
-
At the bottom of the square cup, the uncertainty of the hardening parameter 𝑛 is the main responsible for the variability in the 𝜀̅𝑝, 𝑇𝐶 and 𝐺𝐶 values. Nevertheless, the variability of these forming results is small at this region (see Figure 3);
-
At the wall of the square cup, the uncertainty of the hardening parameter 𝑛 and the anisotropy coefficient 𝑟90, is the main responsible for the variability in 𝜀̅𝑝, 𝑇𝐶 and 𝐺𝐶. The results of 𝜀̅𝑝 and 𝑇𝐶 are also affected by the uncertainty in the hardening parameter 𝐶, while the uncertainty of the anisotropy coefficient 𝑟0 influences the results of 𝑇𝐶 and 𝐺𝐶;
-
At the flange of the square cup, the uncertainty of the anisotropy coefficients 𝑟0 and 𝑟90 is responsible for the major variability in the 𝜀̅𝑝, 𝑇𝐶 and 𝐺𝐶 values. The uncertainty of the hardening parameters 𝑛 and 𝐶 also affects the variability of 𝜀̅𝑝 and 𝑇𝐶, but in a region where the variability of these results is small (see Figure 3). The variability of 𝐺𝐶 is also affected, to a lesser extent, by the uncertainty of the anisotropy coefficient 𝑟45.
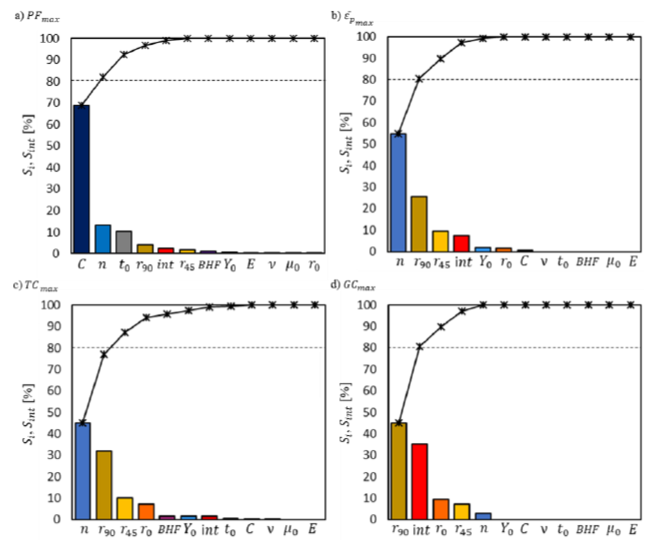 Fig. 4. 1st order indices of the input parameters, 𝑆𝑖, and sensitivity index of the interactions between input parameters, 𝑆𝑖𝑛𝑡, for the maximum values of the forming results:
a) 𝑃𝐹𝑚𝑎𝑥, b) 𝜀̅𝑝𝑚𝑎𝑥, c) 𝑇𝐶𝑚𝑎𝑥 and d) 𝐺𝐶𝑚𝑎𝑥. The black lines represent the cumulative value
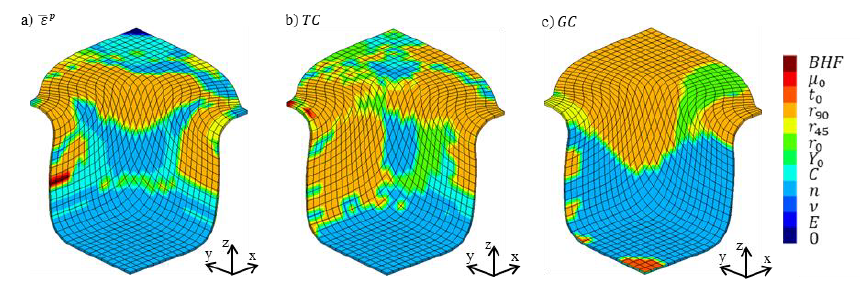
Fig. 5. Representation of the input parameter whose 1st order index 𝑆𝑖 is maximum for the forming results: a) 𝜀̅𝑝, b) 𝑇𝐶 and c) 𝐺𝐶.
The value “0” corresponds to a region of the cup that has no variability in the forming result 𝜀̅𝑝
4. Conclusions
In this work, a numerical study was performed to evaluate the influence of material and process uncertainty in the variability of the square cup forming results. For this purpose, uncertainty in the elasticity parameters, anisotropy coefficients, hardening parameters, blank thickness, friction coefficient and blank holder force was considered. The effect of these uncertainties is evaluated in the forming results of punch force, equivalent plastic strain, thickness change and geometry change.
A quasi-Monte Carlo method coupled with the Sobol’s sequence was used to evaluate the mean and standard deviation values of the simulation results, by considering the uncertainty of the input parameters. With this analysis, it was possible to conclude that the geometry change is the result most sensitive to the uncertainty of the input parameters, with a maximum coefficient of variation equal to 56.75%. Moreover, the flange and wall of the square cup are the regions where the effect of the input uncertainty is more significant. Afterwards, a variance-based sensitivity analysis (Sobol indices) was performed, in order to identify the input parameters with more effect in the forming results variability. It was concluded that the most influent inputs are the anisotropy coefficients and the hardening parameters, 𝑛 and 𝐶; the effect of the interactions between input parameters is only relevant for the geometry change.
The computation of the Sobol indices required a huge computational cost. With the goal of reducing this cost, metamodeling techniques will be used and their performance will be compared in future works. The sensitivity results of the square cup benchmark test will be used as reference.
Acknowledgements
This research is sponsored by FEDER funds through the program COMPETE – Programa Operacional Factores de Competitividade and by national funds through FCT – Fundação para a Ciência e a Tecnologia, under the project UIDB/00285/2020. It was also supported by projects: RDFORMING (reference PTDC/EME-EME/31243/2017), co-funded by Portuguese Foundation for Science and Technology, by FEDER, through the program Portugal-2020 (PT2020), and by POCI, with reference POCI-01-0145-FEDER-031243; EZ-SHEET (reference PTDC/EME-EME/31216/2017), co-funded by Portuguese Foundation for Science and Technology, by FEDER, through the program Portugal-2020 (PT2020), and by POCI, with reference POCI-01-0145-FEDER-031216. All supports are gratefully acknowledged.
