1 Introduction
The development of reliable material models for metal forming simulations has been in scientists' interest for a number of years [1-3]. The main challenge in modeling metal forming operations that the industry is currently facing is to realistically describe phenomena typically occurring at lower length scales under deformation or subsequent heat treatment conditions and incorporate them into the continuum-based approaches. One of the difficulties in this regard is the fact that many micro-scale phenomena are stochastic in nature. This is particularly important when modern metallic materials, including new steel grades, are under investigation. Most of these materials have multiphase microstructures with various microscale features directly responsible for the macroscopic in-use properties. In this case, the complex microstructure has a direct impact on the behavior of the final component under exploitation conditions, which, most of the time, are very demanding. One of the available options to address that issue is the development of full-field, discrete modeling methods, e.g., Monte Carlo (MC), Cellular Automata (CA) etc., that have the capability of explicit representation of investigated microstructure features during the numerical simulation. Therefore, the development and identification of the complex microscale austenite to ferrite transformation model during continuous cooling based on the mentioned Cellular Automata method and DigiCore library is the main goal of the work.
2 Cellular automata method
2.1 Basic assumptions
The classical cellular automata method is based on a regular, discrete computational domain composed of a set of CA cells aligned along two or three directions of the 2D, or 3D space, respectively [4]. The type of space discretization depends on the CA cell's selected shape, e.g., squares, triangles, hexagons etc., as presented for the 2D case in Fig. 1.
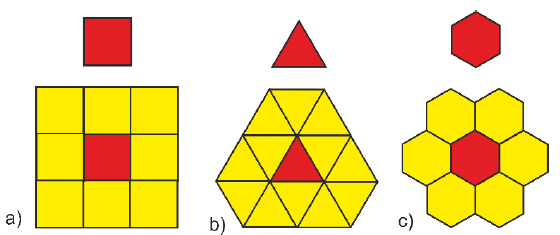 Fig. 1. Examples of the CA cells shape a) square, b) triangle, c) hexagon.
Each of the CA cells contains information on one of the available states, as well as set on internal variables describing its distinct features. Particular CA cell is also subjected to interaction only with the closest neighboring cells via clearly defined transition rules controlling the evolution of the CA cell states. The transition rules replicate the major mechanisms driving a particular phenomenon and, therefore, directly influence model predictions. In each subsequent time iteration, the state of a particular CA cell is evaluated by its state and states of its neighbors from the previous iteration:

So, the state of the investigated CA cell can remain the same, or it can change to a new state according to the logical function Λ:

where: N(i) – neighbourhood of the CA cell, Yi – state of the CA cell, t – time step, Λ = Λ (p, q, Yi, Yj) - logical function within the transition rules also depends on the internal q and external p variables. The neighborhood that is considered during the evaluation of the transition rules can be of a different nature, as seen in Fig. 2. With the presented assumptions, the cellular automata model is expressed by a quadrupole:

where: ω - cellular automata space, Y – set of cell variables, N – set of neighbours, f – transition rules.
Additionally, the stochastic material behavior at the microstructure scale can be incorporated into the CA models through the definition of non-deterministic transition rules and the random type neighborhood.
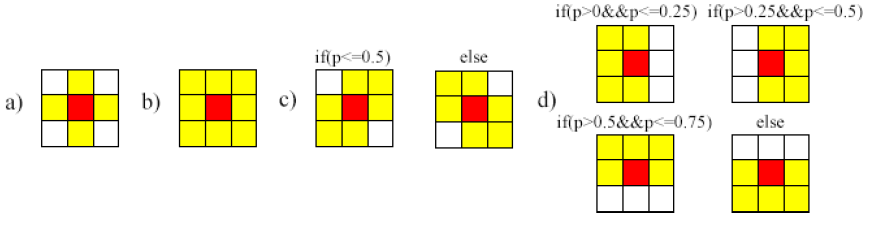 Fig. 2. Examples of the neighborhood definitions in the CA model a) von Neumann, b) Moore, c) hexagonal random (probability p from <0,1>), d) pentagonal random (p from <0,1>).
Finally, to develop a robust CA model, the appropriate boundary conditions have to be created. There are three different types of boundary conditions in the classical CA method: absorbing, where the state of cells located at the edges of the computational domain are adequately fixed with a specific state to absorb moving quantities; reflective, where the state of cells located at the edges are adequately fixed to reflect moving quantities; and most commonly used in material science application the periodic boundary conditions. In the latter case, the CA neighborhood takes into account cells located at the opposite edges of the computational domain and assume their interaction.
As presented in the approach, the system's complex evolution emerges only from local interactions as the long-range communications of the CA cells are neglected. It should also be mentioned that all the available CA models for the material science applications are based on the same common major elements, e.g., CA space as a computational domain, type of neighborhood, transition rule definitions, and also additional components like absorbing or periodic boundary conditions [5-7]. Therefore, to facilitate the development of the new model, a DigiCore library that encapsulates all the CA approach's common elements is being intensively developed as presented in [8]. The DigiCore library is based on the unified data-structures, allowing all the developed microstructure evolution models to be easily coupled for simulation of complex thermo-mechanical operations.
2.2 DigiCore library
The DigiCore library is being developed within the object-oriented C++ programming language under the clear modularity concept. Therefore, the library's main part contains a set of classes and methods, which are the essential building elements to be inherited and extended by other libraries. In this case, each of the additional dynamic link libraries implements a particular microstructure evolution algorithms e.g. static, dynamic or metadynamic recrystalizaiton within the predefined cellular automata space, as presented in Fig. 3. Additionally, to facilitate the work on a CA model development, DigiCore is equipped with a user-friendly graphical interface, mainly for data visualization purposes, which is based on the C# and Windows Presentation Foundation.
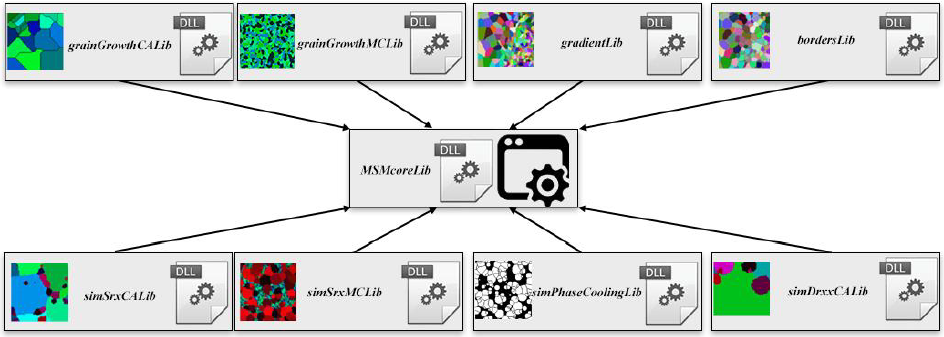 Fig. 3. General structure of the DigiCore library.
Elements that are necessary for running the program with its basic functionalities are: MSMcoreLib – the core of the application, MSMwrapperLib – the connector between the graphical user interface (GUI) and modules and MSMgui responsible for handling the GUI. All other elements are extensions of the core functionality contained in MSMcoreLib. In the sequence diagram (Fig. 4), additional modules are located between the wrappers and the core of the system because they cannot act as separate independent programs but only based on the MSMcoreLib. This application structure ensures the system's required modularity, i.e., is created on a single base library that can be extended by further system components independent of each other but working within the single workflow allowing simulation of microstructure evolution subjected to various thermomechanical processing conditions.
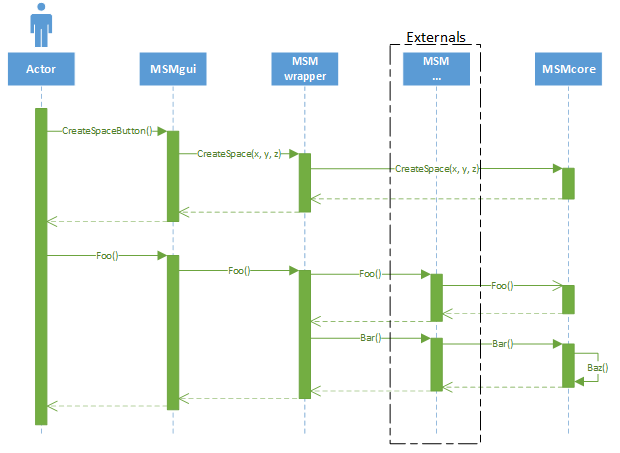 Fig. 4. Sequence diagram presenting the role of the wrapper in the application.
The modularity and universality of the application allow generating microstructures using various algorithms in any order. Moreover, all libraries can be used in external software as an entry point to generate an initial material morphology for further e.g. finite element simulations.
2.3 CA phase transformation model
The developed CA model within the DigiCore library is designed to simulate austenite – ferrite transformation during cooling. Each CA cell is described by several state and internal variables in order to adequately describe the physical state of the material. The cell can be in three different states: ferrite (α), austenite (γ) and ferrite-austenite interface (α/γ). The last state is used to describe CA cells located at the boundary between austenite and ferrite grains. Additionally, each cell contains information e.g. how many ferrite phase f is in a particular neighborhood of the CA cell, what is the carbon concentration in each cell C, and the growth velocity v of the interface cell. These internal variables are used in the transition rules to replicate mechanisms behind the phase transformation progress.
Two major parts of the model are defined to describe nucleation and growth of the ferrite grains in the austenitic matrix, respectively. In the present model, an amount of nuclei is calculated at the beginning of each step in a probabilistic manner. The nucleation process has a continuous character and it occurs during the entire CA simulation until the end of the transformation. The number of nuclei Nt generated during subsequent cooling stages is controlled by:

where: B0, Bt – number of CA cells along the phase boundary in the initial and actual time step, pnuc – probability term. The carbon content, which was in the austenite cell that transformed into the ferrite nuclei, is shared between all neighboring cells, which change their state to α/γ. After nucleation, the growth of the ferrite phase is calculated in the following steps. The CA model is based on the classical equation describing grain boundary ( α/γ interface) velocity during the transformation, which is represented by a product of the mobility M and the driving force F for interface migration:

where: M0 – mobility coefficient, T – absolute temperature, D – diffusion coefficient.
The driving force, in this case, is due to the differences in the carbon concentration in equilibrium conditions (Fig. 5) and actual carbon concentration in each CA cell:

where: β – model coefficient, Ceq – equilibrium carbon concentration, Ci,j – carbon concentration in the (i,j) CA cell.
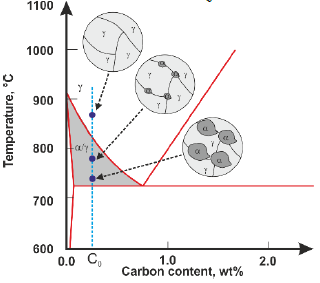 Fig. 5. Concept of thew FeC equilibrium diagram.
As the major driving force for grain growth is based on the differences in the carbon concentration across the microstructure, its evaluation becomes an important factor. This issue is addressed by the solution of the diffusion equation on the basis of the finite difference method:

When the growth velocity v is obtained from (5) then the ferrite volume fraction in the CA cell (k,l) is calculated as:

where: fk,l – total ferrite volume fraction in the CA cell (k,l), as a contribution from all the neighboring austenite-ferrite CA cells, LCA – dimension of the CA cell in the CA space, t – time step, t0 – time when the CA cell (i,j) changed into the ferrite state, vi,j – the growth velocity of the CA cell (i,j).
Finally, based on these calculations, a transition rule controlling the evolution of the CA cells states was defined as follows: the CA cell changes the state from austenite-ferrite (interface) into ferrite when ferrite volume fraction in this cell exceeds the critical value fcr set to 1.0 in the current study. If this condition is not fulfilled, the CA cell remains in the austenite-ferrite state. At the same time, when the CA cell changes the state from austenite-ferrite to ferrite, all the neighboring cells in the austenite state change their states into the austenite-ferrite interface.
However, prior to application of the developed model for the numerical predictions of the phase transformation progress in the investigated steel subjected to a particular cooling cycle, its parameters have to be properly identified to reflect the characteristic behavior of a particular steel grade.
3 Identification of CA model parameters
3.1 Experimental data
The investigated material is micro-alloyed steel with a chemical composition presented in Table 1.
Table 1. Chemical composition of the investigated steel, wt%.

To obtain information on phase transformation progress in a range of slow cooling rates between 0.1 and 1 ºC/s a series of dilatometric tests with the DIL 805 apparatus was performed. Samples dimensions were set as Φ4×7 mm. Identified characteristic start/stop temperatures of austenite to ferrite phase transformation are gathered in Table 2, while corresponding microstructures are shown in Fig. 6. The measured volume fraction of ferrite varied in a small range between 90% and 80% for the low and high cooling rates, respectively.
Table 2. Start and stop of selected phase transformations.
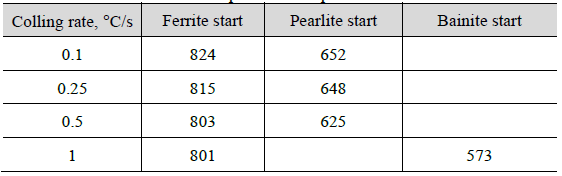
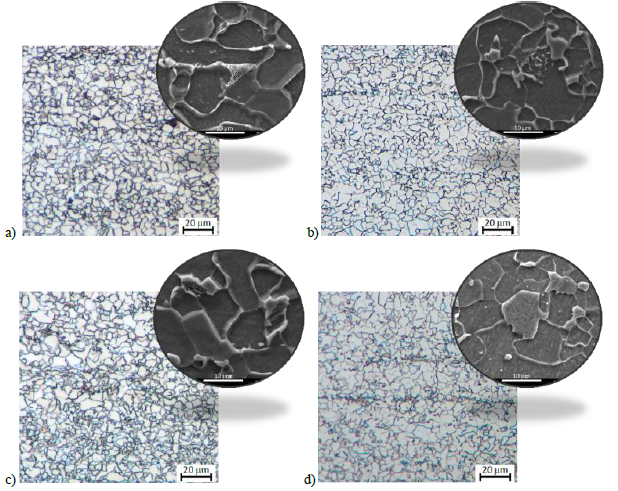 Fig. 6. Scanning electron microscopy images of the microstructure after a) 0.1 b) 0.25 c) 0.5 d) 1 C/s.
3.2 Determination of equilibrium diagram
A series of additional calculations were required to provide input data associated with the investigated material for the CA model identification stage. In particular, the equilibrium diagram information, which is used to evaluate the driving force, was calculated by means of the ThermoCalc software. Then, after the fitting of the linearized temperature functions to the calculated ones, a set of function coefficients was obtained for the carbon concentration along the phase boundaries:

where: Cγα – carbon content in austenite at the γ-α phase boundary Cγβ – carbon content in austenite at the γ-cementite phase boundary, Cα – carbon content in ferrite.
The two important equilibrium temperatures Ae1 and Ae3 were also calculated by the ThermoCalc software and are equal to 731ºC and 871.0ºC, respectively, as seen in Fig. 7.
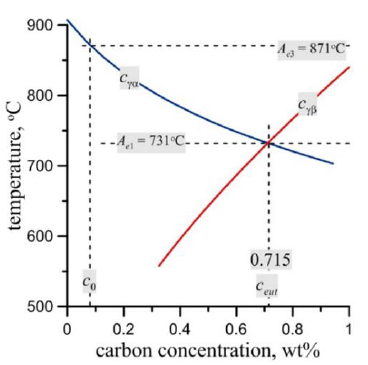 Fig. 7. Part of the calculated equilibrium diagram with characteristic temperatures.
3.3 Inverse analysis
The presented set of experimental data, as well as identified equilibrium parameters, were used as boundary conditions for the CA phase transformation model during the model identification procedure based on the inverse analysis [9]. The classical inverse analysis algorithm [10] based on: the CA model from chapter 2.3 used as a direct problem model; experimental data presented in chapter 3.1; and non-gradient optimization method was used during the investigation. The measured phase transformation start and stop temperatures, as well as volume fractions of ferrite, were used to define the goal function:

where: where: Tim, Tic – measured and calculated start and stop temperatures of phase transformations, n – number of temperature measurements, Xim, Xic – measured and calculated volume fractions of ferrite at room temperature, k – number of measurements of volume fractions of phases. A final comparison of predicted and calculated start/stop temperatures is shown in Fig. 8.
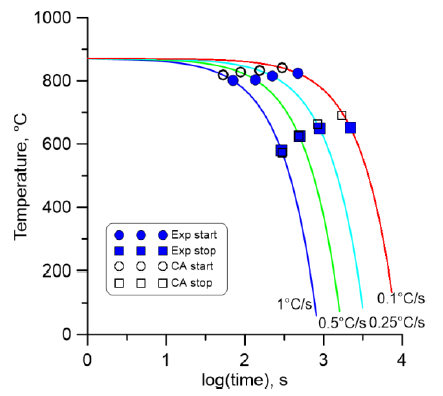 Fig. 8. Agreement between calculated and measure start and stop temperatures.
Examples of microstructure morphologies after the transformation under the investigated cooling rates are shown in Fig. 9.
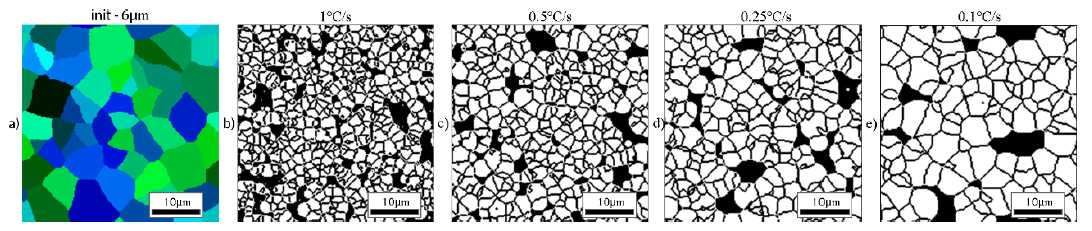 Fig. 9. Microstructure evolution during the transformation under various cooling rates (ferrite grains are marked in white).
The final set of CA model parameters identified within the current work is summarized in Table 3.
Table 3. Identified phase transformation model parameters.

4 Conclusions
This work is a step towards the development of the full-field cellular automata phase transformation model in steels focused on transformation from austenite to ferrite phase under continuous colling. During the research, a set of dilatometric experiments was conducted to reveal the behavior of investigated material during cooling in a small cooling range regime. These experiments supported by the ThermoCalc calculations provided the required set of CA model boundary conditions and data for the definition of the goal function. Finally, the application of the inverse analysis technique provided a set of identified phase transformation model coefficients that can be used during further numerical simulations. The model qualitatively predicted the grain size and final volume fractions what is one of the major benefits of the developed full-field model. The start and stop temperatures of austenite to ferrite transformation were also accurately predicted. Some overestimation of the start temperatures is visible in this case, which may be attributed to the interpretation of experimental observations. In the case of the slowest cooling rate, the model also shows a small deviation with respect to experimental observations. In this case, the probabilistic aspects of the CA model can play a role. This issue will be the subject of future work.
Acknowledgments
Work within the Beethoven project financed by DFG in Germany (BL 402/46-1) and NCN in Poland (2016/23/G/ST5/04059). This research was supported in part by PLGrid Infrastructure.
