1 Introduction
Thermoforming of continuous fibre reinforced thermoplastic composite materials has great potential for high volume production of light weight tailored parts, due to the short cycle time. During the process a flat laminate is heated and then pressed into its final shape. However, the process can induce defects, such as wrinkling and tearing. Simulation tools have been developed [1] to evaluate the forming process and mitigate the process induced defects prior to actual manufacturing. These simulation tools generally model the dominant deformation mechanisms: shear, bending, and slip. Accurate quantification of the composites’ reaction to deformation, and the rate and temperature dependence of the reaction, is necessary to obtain the parameters of the material card. Hence, characterization experiments have been designed for each mechanism that can measure the deformation behaviour at a given rate and temperature [2,3]. The characteristic forming behaviour of a composite is thought to arise from the ‘delicate balance between mechanisms’ [2]. Several comparative studies have shown that composites with different types of reinforcement, fibre material, or matrix polymer, the constituents of a composite, behave different [4,5]. However, it is not known what the influences of these constituents is on the forming behaviour, in other words the balance between mechanisms. This study aims to quantify the effect of the constituents on the different deformation mechanisms.
1.1 Experimental data
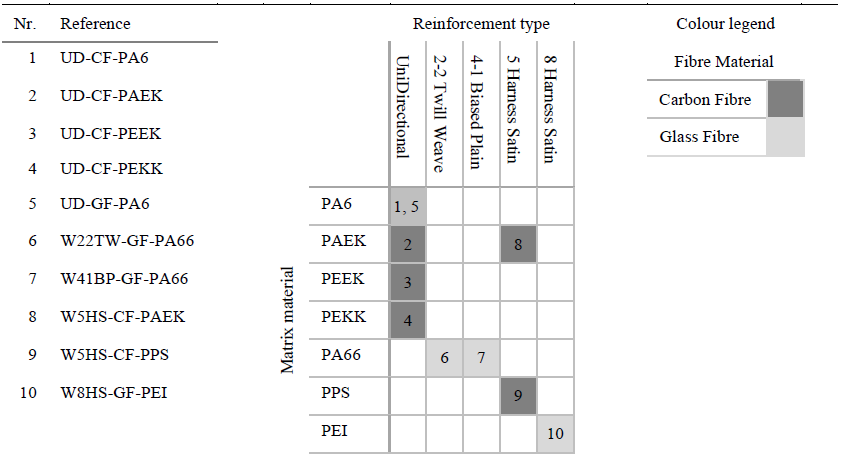
The experimental results of 10 different composite materials, listed in Table 1, are analysed and compared. The combinations of constituents covered by the composites is diverse, but there are five overlaps which make a correlation possible. The experimental results are the measured resistance to an imposed deformation at a constant rate and constant temperature for the four mechanisms tested: shear, bending, and ply-ply and tool-ply slip. In the current approach, we limit ourselves to the experimental data without interpreting the results in terms of a constitutive model. Depending on the mechanism the measured resistance is either a moment or a force, and the deformation is a rotation or a displacement. Also note that the shear is measured with different experiments. A composite is tested with a torsion bar test [2] or bias extension [4], depending on whether the composite is a unidirectional or a woven fabric, respectively. A typical set of measurement curves for each characterisation experiment, tested at different rates and temperatures on multiple samples, is plotted for two materials, UD-CF-PAEK and W5HS-CF-PAEK, in Fig. 1. These curves are normally used to characterise the deformation, deformation rate, and temperature dependency.
Table 1. Overview of the materials and constituents in the dataset. Note the rows and columns that contain more than one filled square, as these allow a direct comparison over one constituent, keeping the other constituents constant.
However, for the purpose of this study not all aspects of the data have to be analysed. A recent study [6], revealed that the data can be approximated with a multivariate linear regression, and that the regression constant captures most of the variation. In the case that, each predictor variable is standardised, by subtracting its mean 𝑥̅ and dividing by its standard deviation 𝜎𝑥:

the regression constant is the mean of the multivariate linear regression function over the considered domain. The regression constant, or intercept, of the multivariate linear regression with standardised predictor variables will be referred to as the regression mean. The regression means per mechanism for the UD-CF-PAEK and W5HS-CF-PAEK data are the horizontal lines in the graphs in Fig. 1. Moreover, the dependency to the deformation, rate, and temperature was found to be proportional to the regression mean, i.e. if the regression mean is known, a fair estimate of the expected experimental results can be made. Therefore, it is sufficient to analyse the regression mean of the measurements of each mechanism for the materials, and determine how the regression means change depending on the type of reinforcement, fibre material, and matrix polymer. For this study, the experimental data was sampled using linear interpolation between measurement points, to reduce the size of the dataset. The sampled data was standardised, to have a mean of zero and a standard deviation of one, per mechanism. Consequently, the regression mean indicates how many standard deviations the measurements are away from the overall mean per mechanism.
2 Method
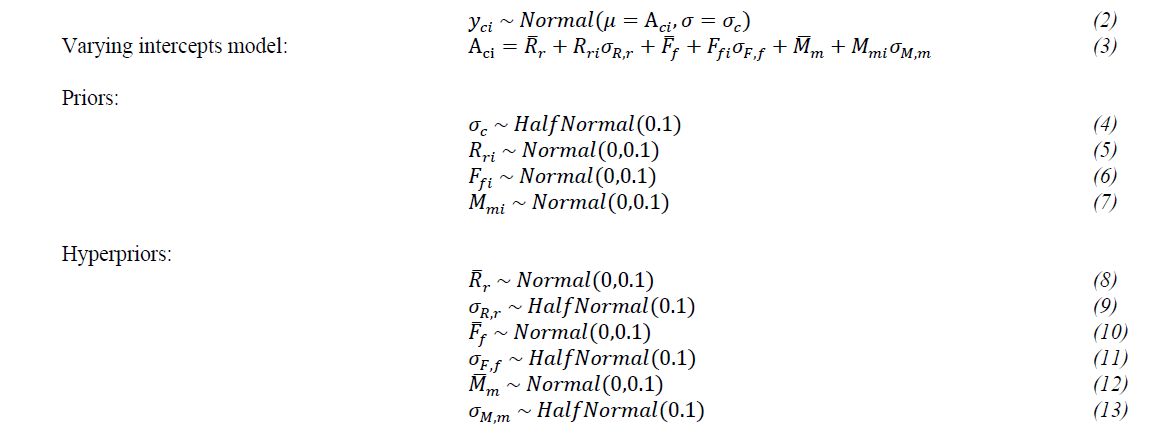
The analysis consists of two steps: first a model is developed that approximates the standardised experimental data (measured resistance) 𝑦𝑐𝑖 of composite 𝑐 tested for mechanism 𝑖, using only an intercept, the regression mean Aci, while including the effect of reinforcement, fibre, and matrix. Second, the found amplitudes and effects are analysed, and correlated to physical properties related to the constituents.
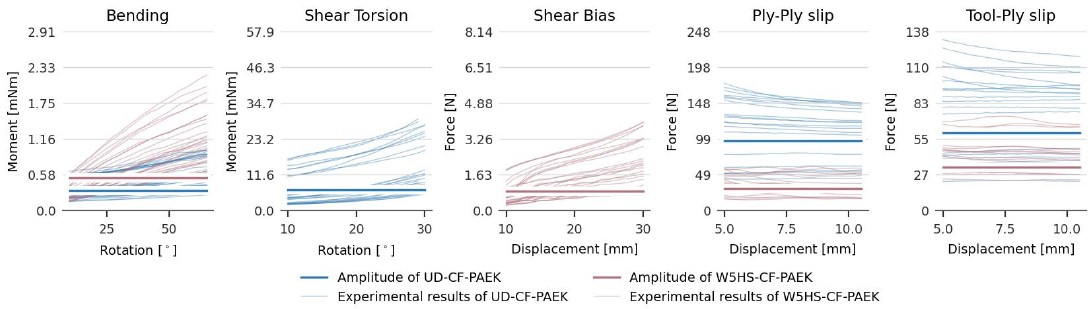 Fig. 1. Experimental results for UD-CF-PAEK and W5HS-CF-PAEK and the regression means (horizontal lines) for the five experiments considered in this study.
To model the effect of the constituents, a Bayesian cross-classified multilevel model with varying intercepts [7] is applied, and the No U-Turn Hamiltonian Monte Carlo sampler (NUTS) of the PyMC3 package [8] was used for the inference. In this paper, each composite 𝑦𝑐𝑖 is assumed to be a sample from a normal distribution around the regression mean Aci and with a standard deviation σc as in Equation 2. The prior distribution for σc is given in Equation 4. The mean A is further modelled by a multilevel varying intercept model, defined with the non-centred parametrisation in Equation 3. Varying intercepts [9] indicate that every reinforcement type 𝑅𝑟𝑖, fibre material 𝐹𝑓𝑖, and matrix polymer 𝑀𝑚𝑖 has its own intercept, and prior distribution, Equations 5-7. Hence, both types of fibre materials denoted with the subscript 𝑓=1,2, can contribute to the mean Aci of each mechanism 𝑖. The seven types of matrix polymer 𝑚=1,…,7, and five types of reinforcement would have their contribution too, however the model would be over defined if all matrix and reinforcement types would be included, since the matrix and reinforcement type for the W8HS-GF-PEI composite do not overlap with any other material. It is chosen to combine the effect in the PEI matrix term, and drop the W8HS reinforcement; hence the reinforcement has four types 𝑟=1,…,4. Multilevel refers to the fact that, in addition to the estimate for the effect per mechanism, a shared effect of a constituent over the mechanisms is included too, these mean effects: ̅̅Rr , ̅̅Ff and ̅̅Mm , and their standard deviations: 𝜎𝑅,𝑟, 𝜎𝐹,𝑓, and 𝜎𝑀,𝑚, are hyperparameters with hyperpriors, Equations 8-13. Strong regularising priors have been chosen to prevent overfitting [7] and to improve the sampling, i.e. most of the weight is close to zero. Five chains of 5000 samples were run, with 1500 tuning samples, a target accept of 0.9 and random seed 8927. The chains ran without divergences, and the potential scale reduction factor Ȓ [10] was 1.0 for all parameters, confirming the convergence of the chains.
For the second part of the analysis data were extracted from the material datasheets, such as the resin content, fibre volume fraction, melt temperature, glass transition temperature, thickness, density, tensile strength, and tensile modulus. These data are correlated to the means of the effects found by the model.
3 Results
The model returns samples from the posterior distributions of the parameters, Equations 4-13, which are the estimates of the constituents’ effects. Before having a look at the individual effects, the estimates for the regression means are presented. The regression mean is the sum of the individual effects, Equation 2. The violin plots presented in Fig. 2, show the distributions of the estimates for the regression means for all 10 composites per mechanism. The mean of the unstandardised estimates for the UD-CF-PAEK and W5HS-CF-PAEK composites were the horizontal lines shown in Fig. 1. Because the data has been standardised, the violins in the positive range indicate that a higher than average resistance to deformation is observed for the composite for that mechanism, or lower than average for the violins in the negative range. The graph is a summary of the quantified forming behaviour of a composite, since the forming behaviour of a composite is thought to arise from the balance between mechanisms [2], i.e. the relative importance of the regression means of each mechanism. Hence the pattern of the line connecting the regression means of one material characterises the forming behaviour of a material.
Some trends can be observed for the five overlapping constituent combinations:
• Fixed UD PA6 and varying fibre material CF/GF: the measurements for the glass fibre composite are lower than the carbon fibre composite for all mechanisms. The difference is particularly pronounced for the slip mechanisms. Both materials have a lower than average resistance to deformation for the bending and shear mechanisms.
• Fixed UD CF and varying matrix polymer PA66/PAEK/PEEK/PEKK: the matrix seems to have a significant effect on the regression means, and therefore on the resistance to deformation, especially for the shear and friction mechanisms. Noteworthy are the correlation (no crossing lines) between the shear torsion test results and the ply-ply slip results for these materials, and the high slip values for the carbon fibre UD materials.
• Fixed CF PAEK and varying reinforcement UD/5HS: the greatest difference between the regression means of both types of reinforcement are observed for the friction mechanisms.
• Fixed CF 5HS and varying matrix polymer PAEK/PPS: the differences are most important for the bending ant tool-ply slip experiments, interestingly, the order changes.
• Fixed GF PA66 and varying reinforcement 22TW/41BP: the materials remain relatively close together, except for bending where the 4-1 biased plain weave shows a significantly higher regression mean.
Furthermore, the composite that has no overlap with the other matrix polymers or reinforcement types, W8HS-GF-PEI, has relatively stretched violins. This means that the uncertainty is relatively large, an overlap with other composites could reduce the uncertainty.
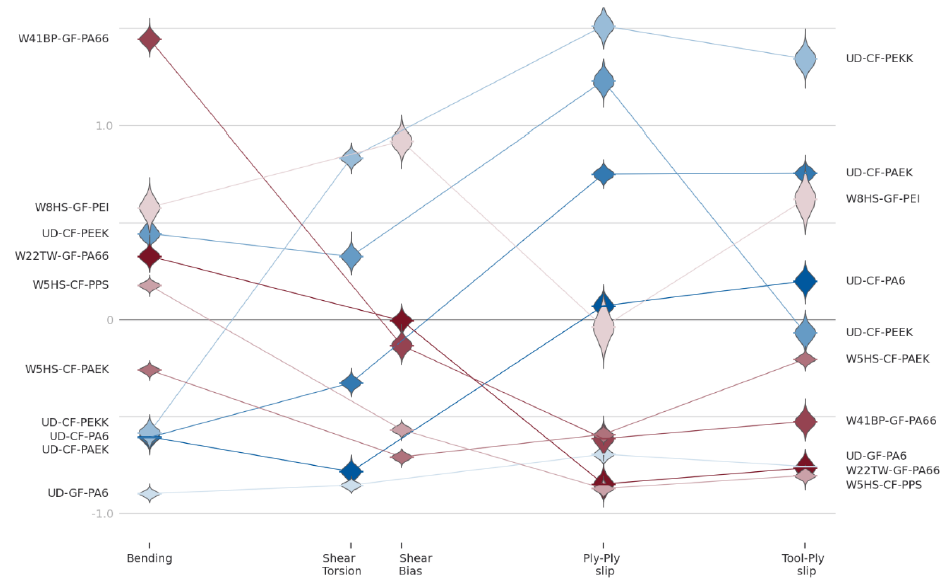 Fig. 2. The violin plots show the distribution for the estimate of the regression mean per material for all its mechanisms. The graph shows the relative importance of the regression of each mechanism, it is a summary of the quantified forming behaviour of a composite.
3.1 Mean effects
A mean effect is the contribution of a constituent type to the regression mean of all mechanism, to this contribution the mechanism specific contribution has to be added. The mean effects of the reinforcement types, fibre materials, and matrix polymer are presented in Fig. 3. Note that the x-axis corresponds to the y-axis of Fig. 2. Starting with the reinforcement types, a unidirectional reinforcement is expected to have a neutral effect relative to the regression mean, whereas the 5-harness satin weave starts at a lower regression mean. With respect to the fibre material, carbon fibre composites have on average a higher regression mean compared to the glass fibre composites. Finally, the common trend of the UD-CF materials is observed in the mean matrix effect. Note that the combination of the PEI+8HS gives more weight to that parameter.
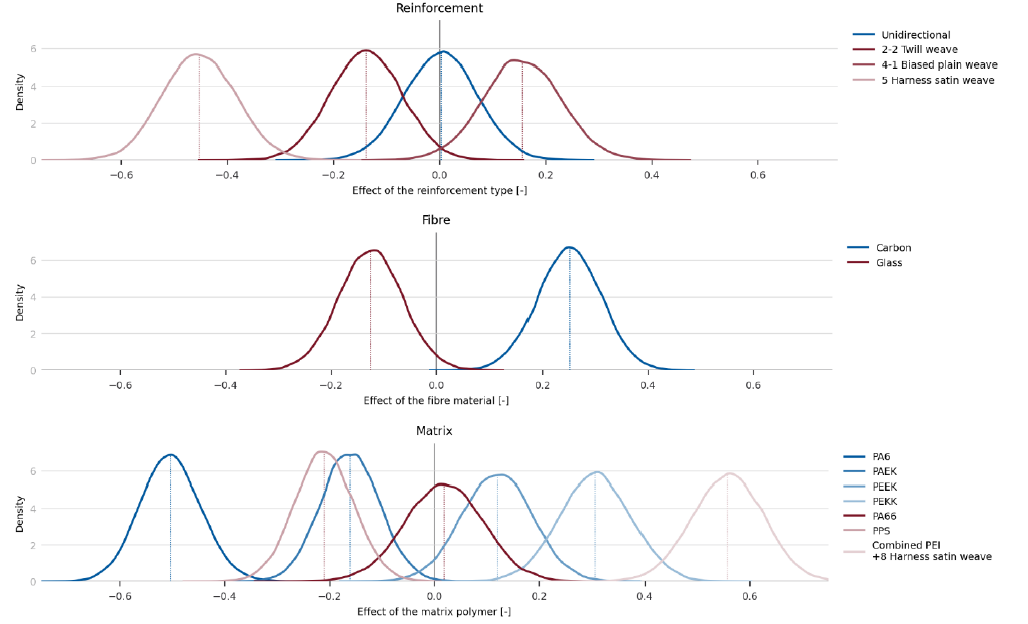 Fig. 3. The distribution for the mean effect of the reinforcement type, fibre material, and matrix polymer.
3.2 Effects per mechanism
For every constituent type the effect per mechanism was estimated as well, the overview of the 65 parameters is plotted in Fig. 4. For this plot the mean effect that was shown in Fig. 3 is the top bar of each set of six bars. The bars with the effect per mechanism start from mean effect so that the total effect of a constituent type per mechanism is the end point. Overall, the mechanism specific contribution is significant, the mean effect cannot capture the details. Thus, there is some correlation between mechanisms, but there are significant mechanism specific influences too. Furthermore, the total contribution of the matrix polymer per mechanism is larger than the contribution of the reinforcement type and fibre material. Some important observations can be made:
• The effect for unobserved cases, i.e. UD and shear bias, is zero. The model has no information to infer these parameters.
• The UD reinforcement has an important effect on the bending and slip mechanisms.
• No additional contributions are needed for the 2-2 twill weave, i.e. the effect is the same for all mechanisms.
• The 4-1 biased plain weave has a large effect on bending, it accounts for the high resistance to bending (Fig. 2).
• Glass fibre materials tend to have a lower than average regression mean for the slip.
• The PEEK matrix has a lower than expected tool-ply slip regression mean.
• For PEKK the bending regression mean is lower than expected.
• The combined matrix reinforcement PEI+W9HS has to explain the high tool-ply slip regression mean.
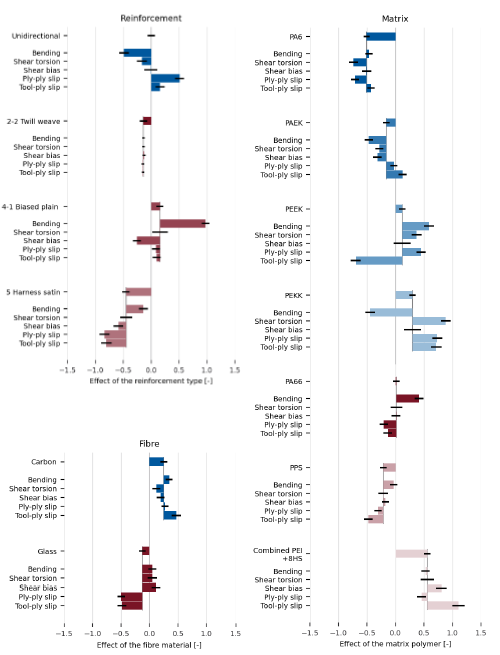 Fig. 4. The distribution of the constituent types per mechanism, are plotted relative to the mean, such that the end point is the combined contribution of the mean and mechanism specific contributions.
3.3 Correlation between composite properties and the observed effect
Finally, to determine whether the found contributions of the constituents can be related to the physical properties of the composites, the correlation was calculated between the contributions, and the material properties from the datasheets. Because there are only two types of fibres many of the properties show strong correlations but these are not meaning full. The significant correlations are as follows:
• Reinforcement – mean ~ Resin content (-0.78)
• Reinforcement – bending ~ thickness/areal weight (0.68/0.70)
• Matrix – mean ~ Melt/Glass transition temperature (0.71/0.74)
• Matrix – shear bias ~ Melt/Glass transition temperature (0.83/0.77)
• Matrix – ply-ply slip ~ Melt temperature (0.85)
Though the correlation between Matrix –tool-ply slip and glass transition temperature for the 10 points is not strong (0.42), it would be 0.85 when PEEK would be excluded. Overall, the effects do tend to be related with physical properties of the composite.
4 Discussion and conclusion
The experimental data, typically used to create material cards for forming simulations, of 10 thermoplastic composite materials was analysed to quantify the effect of the constituents; reinforcement type, fibre material, and matrix polymer. The 10 materials cover a wide range of these constituent types, while still having some overlap to be able to compare effects. A multilevel varying intercepts model was used to determine the importance of the constituents. Part of the effect is shared between mechanisms, but for some cases a large mechanism specific effect is found. The 4-1 biased plain weave composite is a good example, the bending regression mean is much higher than what would have been expected from the glass fibre and PA66 effects, the reinforcement has a large effect on the regression mean of the bending experiments. The results indicate that the regression means for the experimental results are related to the physical properties of the composite. Furthermore, the physical properties that correlate to the reinforcement and matrix are related to the constituents, as the type of reinforcement, together with the fibre material, defines the fibre content, fibre volume, and ply thickness, and the melt and glass transition temperature are properties of the matrix polymer.
In this work, it was shown that the constituents’ properties, those of the matrix polymer in particular, give a first indication of the forming behaviour in terms of the relative regression means, and thus the resistance to deformation. Adding more materials to this small dataset, is strongly believed to increase the predictive power of the model presented.
Acknowledgements
The authors gratefully acknowledge the financial as well as technical support from the industrial and academic members of the ThermoPlastic composites Research Center (TPRC) as well as the support funding from the Province of Overijssel for improving the regional knowledge position within the Technology Base Twente initiative. The authors especially acknowledge Toray Advanced Composites, Coriolis Composites Technologies, and DuPont.
