1 Introduction
Nowadays, polymer-matrix composite (PMC) materials are invading the industrial domains by ensuring many structural applications. The Liquid Resin Infusion (LRI), part of the Liquid Composite Molding (LCM) techniques along with Resin Transfer Molding (RTM) and their variants, is significantly very used in wind and shipbuilding industries [1] due to its ability to produce parts with big dimensions and complex geometries in one shot, without need for further machining. Other techniques, such as RTM or autoclave, are indeed limited by the size and complexity of the molds (for RTM), and by the size of the pressurized oven and the price (for autoclave). Thus, the monitoring and assessment of the various steps of the LRI process become crucial in order to develop PMC structures with high mechanical properties and promote savings in manufacturing time. To do this, several research teams have used various non-destructive testing and evaluation (NDT&E) techniques. It turns out that most of their studies used conventional, external and very bulky control devices [2-3]. Very few bibliographic works used in-situ systems (within PMC structures) and in a real-time way [4]. During this study, we propose to integrate, for each PMC plate, a PZT (Lead Zirconate Titanate) transducer within its reinforcement stack composed of six 2/2 twill glass fabrics, and follow the different stages of crosslinking of the polyester resin (gelation and vitrification) by a measurement of the electrical capacitance variation of the embedded PZT during the different phases of the LRI process.
2 PMC plates and experimental methods
2.1 Manufacturing of PMC specimens
Six 150*150 mm2 plies of 2/2 twill glass fabric with a surface mass of 280g/m² are used as the reinforcement of the studied plates. The fibrous stack is associated with a thermoset unsaturated polyester resin (Norester 822 Infusion - Nord Composites), mixed with a Methyl Ethyl Ketone Peroxide (MEKP) hardener (Ketanox B180 – C.O.I.M s.p.a) to achieve consolidation at room temperature during the LRI manufacturing. Three different hardener concentrations (1wt%, 1.5wt% and 2.5wt%) are studied during
the process monitoring (PM) campaign. For each hardener rate, three PMC plates are manufactured. The PZT piezoceramic discs, coated on each face with silver electrodes, are used in this work. They are chosen for several reasons, such as their cheapness, their potential low intrusiveness due to their small dimensions (25mm in diameter–0.135mm in thickness) and their possible use in both active (actuator) and passive (sensor) modes. These features make them good candidates to be integrated inside host parts for smart applications, such as in-situ and real-time PM and structural health monitoring (SHM). For each PMC plate, the wiring of the one embedded transducer between the third and fourth plies is realized using a pair of thin tinned copper wires of 210μm in diameter (Fig. 1). The operation of each used transducer was checked in the first place before its integration into the composite, by connecting it to a LCR bridge once wired and measuring its static (i.e., stress-free) electrical capacitance C0 to compare it to the supplier datasheet. The found static capacitance value is 50nF±6.3% [5] for the ϕ25mm PZT. All PMC plates are manufactured using the LRI process: a fiber stack is arranged on a mold previously coated with a release agent, covered with a vacuum bag, and finally impregnated by a degassed beforehand (-0.4 bar–4 minutes) liquid polyester resin until saturation of the preform, the resin flowing through the stack thanks to the vacuum created in the system (-0.65bar). The time interval between the mixing of the resin with the hardener and its injection through the preform is evaluated to 7 minutes, which will be used thereafter for the PM experimental campaign. The fibrous stack is covered with other consumable materials (peel ply, perforated film, and infusion mesh) to improve the performance of the process, such as resin impregnation speed and quality, as well as easing the unmolding step. After the resin injection stage, the infusion system cures at ambient temperature thanks to the MEKP hardener mixed with the resin. Six hours are necessary to have a sufficient consolidation of the thin PMC plates of 1.4mm in thickness, which can then be unmolded.
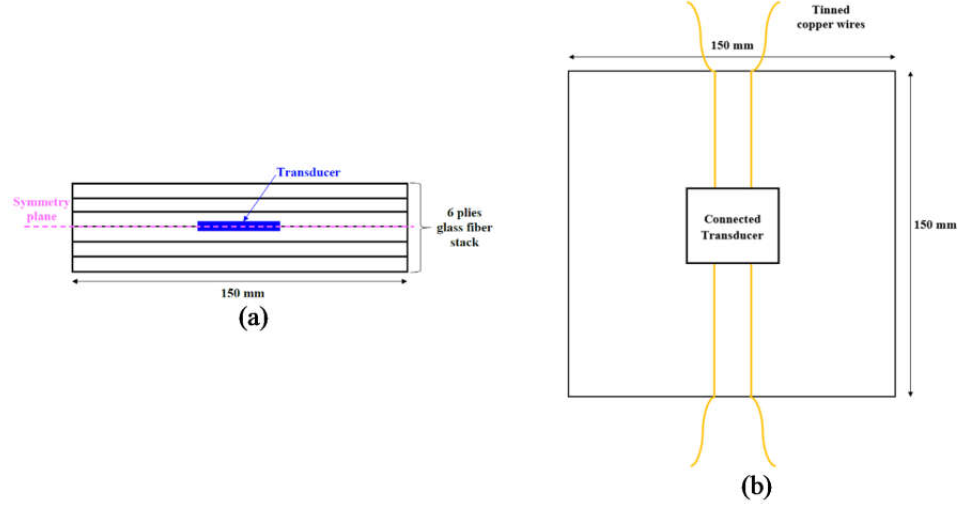
Fig. 1. (a) Through-the-thickness position of the PZT transducer, (b) Wiring of the transducer on the top of the third ply.
2.2 Oscillatory rheology
As the studied resin has an intrinsic viscoelastic behavior, its stress reaction σ when submitted to periodic oscillatory shear stress γ = γ0 exp (i ωt) with a small amplitude can be described using Equation (1).

where ω is the pulsation of the solicitation and δ the phase between the original strain signal and the obtained material stress response. σ and γ are linked by a complex shear modulus G ∗ by the following relation: σ (t) = G ∗(ω)γ(t), with G ∗ = G’+ i G’’ involving G’ as the storage modulus and G’’ as the loss modulus. The storage modulus G’ is associated with the elastic behavior of the resin, when energy coming from the outside can be stored and then given back by the system, and the loss modulus G’’ characterizes its viscous behavior when the received energy is dissipated through the moving chains of the polymer instead of being returned. These two variables appear in the complex viscosity expression η*, shown in Equation (2). The three variables, |η*| (in modulus), G’ and G’’ will be measured and plotted in real-time when performing the oscillatory rheology tests. First of all, gelation will be highlighted by the crossing of G’ and G’’ [6–8], this crossing is normally associated with a rise of the viscosity complex modulus |η*| curve as a function of the time. Then, the maximum of G’’ before its final drop will point out vitrification [9] because at this time, the resin, as a solid glass, has no remaining viscous properties.

As it is not possible to perform real-time chemo-physical characterization of the infusion systems, many resin/hardener samples (~3gr in mass) were tested in oscillatory rheology using a parallel plate rheometer equipped with a disposable plane/plane system. The tests conditions were adapted to mimic LRI process conditions as much as possible, meaning ambient temperature, and angular shear strain γ (1%) as well as superior plate oscillation frequency (1Hz) as low as possible to reproduce the stable state of the resin during the whole infusion curing stage. These tests were performed on samples containing the same tested hardener concentration. All the obtained results were normalized with respect to the mass of the corresponding samples in order to compare them. The rheological tests were performed until the appearance of a viscosity complex modulus |η*| stabilization after a continuous increase from the first inflection point, meaning that the curing reaction slowed down significantly. This plateau is assumed to be the end of vitrification, as confirmed by the G’’ drop, meaning that the cured resin has no remaining viscous properties in its final glassy state.
2.3 Multi-instrumented PM setup mutualizing several NDT techniques
The two employed NDT techniques (AE and IRT) used for the real-time PM of the PMC plates are schematized in Fig. 2. The IR camera is positioned over the preform so that the whole zone is framed by the 4 AE sensors (PAC Micro80, glued with Loctite SI5926 Blue Silicone grease as a coupling interface), forming a 10*10 cm² squared area, and covered by the detector. The IRT area of interest (~3.5*3.5 cm²) is displayed in Fig. 2 with a yellow square, without any obstacle between the curing plate and the IR detector. Electrical capacitance of each embedded Φ25mm PZT transducer was measured during the overall LRI process using the Keithley multimeter model DMM7510 with an injected charge current of 10μA to record the real-time variation of the in-situ capacitance during PM experimental campaign. The capacitance values are acquired at 2Hz frequency according to the duration of the PM test, to make the signal able to monitor as many physical phenomena as possible.
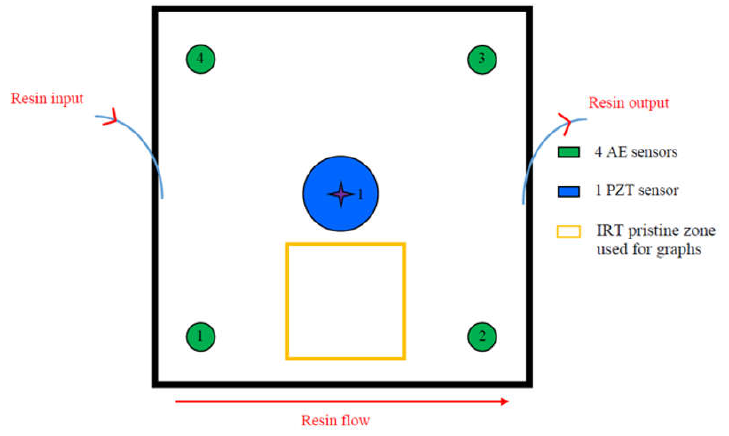 Fig. 2. PM of the LRI process using embedded PZT transducer, 4 AE sensors and IR camera.
3 Results and discussions
3.1 Impact of MEKP hardener rates on the NDT signatures
The increase of the MEKP hardener rate from 1wt% to 2.5wt% affects the temperature ΔT measured by the IR camera on the surface of the vacuum bag (Fig. 3 a), the CAE (Cumulative Absolute Energy of the AE hits) acousto-ultrasonic activity detected by the 4 AE sensors (Fig. 3 b) and the piezoelectric signature of the embedded PZT transducer within PMC plate (Fig. 3 c), during the whole steps of the LRI process.
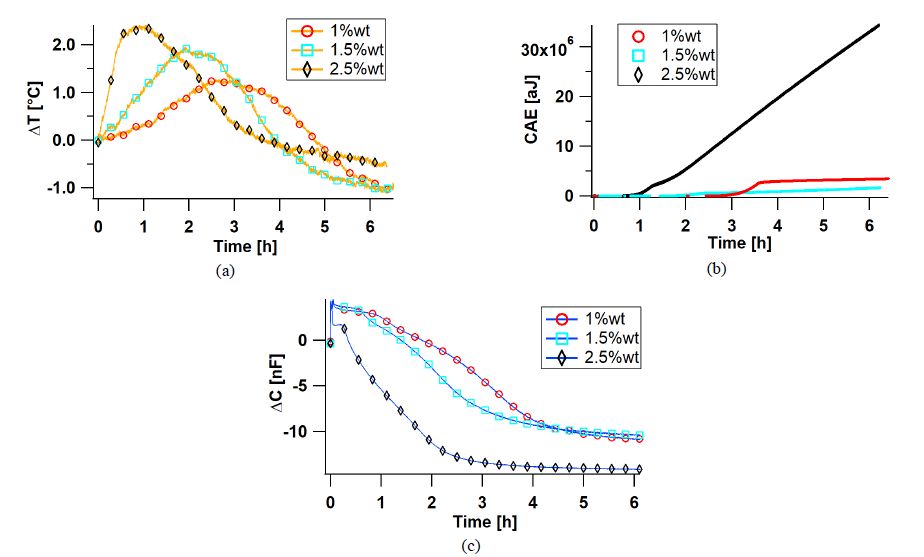 Fig. 3. Impact of MEKP hardener rate on NDT signatures during multi-instrumented LRI: (a) IRT, (b) AE, (c) PZT capacitance variation.
When the hardener rate is increased, the exothermal of the curing reaction is increased, as displayed in Fig. 3 a, with the highest temperature variation (~2.4°C) reached for the plate manufactured with 2.5%wt of MEKP. Similarly, the temperature rising speed is increased as well as the hardener percentage is raised, which suggests a growth in the resin curing reaction speed. This is strengthened when looking at Fig. 3 b where the first rise of the CAE occurs earlier and earlier with the hardener rate increase. So, this means that as the propagation medium (the resin) solidifies more rapidly due to the higher hardener rate, the acoustic waves produced by the vibration of the PZT are able to reach quickly the AE sensors positioned on top of the PMC plate being manufactured. Knowing that the crosslinking kinetics of the polyester resin depends on the hardener rate, the hydrostatic pressure influences with a remarkable manner the temporal variation of the piezoelectric capacitance that evolves from a convex tendency to another concave, thus marking the increase of the crosslinking rate when the hardener rate increases (Fig. 3 c).
3.2 Comparison between the LRI results and rheological measurements
Based on the recent work of Tuloup et al. [4] and plotting the rheological results (|η*|, G' and G") with the second derivative of the electrical capacitance variation, the first local minimum of this latter (point (1) in Fig. 4 a) coincides with the intersection of G' and G", meaning gelation [10–12]. This confirms the hypothesis that when the resin passes from a liquid state to a rubber state (gel), it starts to compress the PZT transducer and makes its capacitance decrease. At this manufacturing step, as the resin is under a gel form, no acoustic waves coming from the vibrating PZT can be transmitted to the external AE sensors, making the CAE values null or negligible, as shown in Fig. 4 b. The pressure is also found decreasing due to the progressive solidification of the matrix in the system, which is also the reason for the IRT ΔT rising (exothermal reaction) in Fig. 4 b. The third zero-crossing point of the second derivative of the capacitance is associated with the resin vitrification at the maximum of the G’’ curve [13] (annotation (3) in Fig. 4 a). The found correlation is coherent because the transition from a gel to a (much more rigid) glass makes the resin compress the PZT, which induces a change of its decreasing capacitance slope and a new inflection point. At that moment, the IRT ΔT is relatively close to peaking, and the CAE curve is not far from its first rise (~30min for the three 1wt% plates). The resin becoming a glass progressively, it is close to being sufficiently cured and solid to propagate acoustic waves, explaining the CAE rise to come. The fourth point (annotation (4) in Fig. 4 a) appears more than three hours after the beginning of the resin injection. At this time, the G’ curve has already converged to a final plateau, and the G’’ one tends to return to zero in Fig. 4 a. However, this last point always happened when the rheological tests are never reached because of the breakage risk of the rheometer when a too rigid sample is tested too long. G’ and G’’ behaviors mean that the resin is quasi fully cured at that time, corresponding to the end of vitrification, which is the final curing stage. Indeed, as a solid glass, the resin has only an elastic behavior and no remaining viscous properties at that time. This last point occurs around the previously noticed change of the CAE slope to a quasi-linear behavior, which confirms the hypothesis that at this time, the acousto-ultrasonic wave propagation medium has acquired almost constant properties (Fig. 4 b). It is also well-correlated with the IRT ΔT fall after the exothermal peak (Fig. 4 b) because as the reaction ends, no more heat is released.
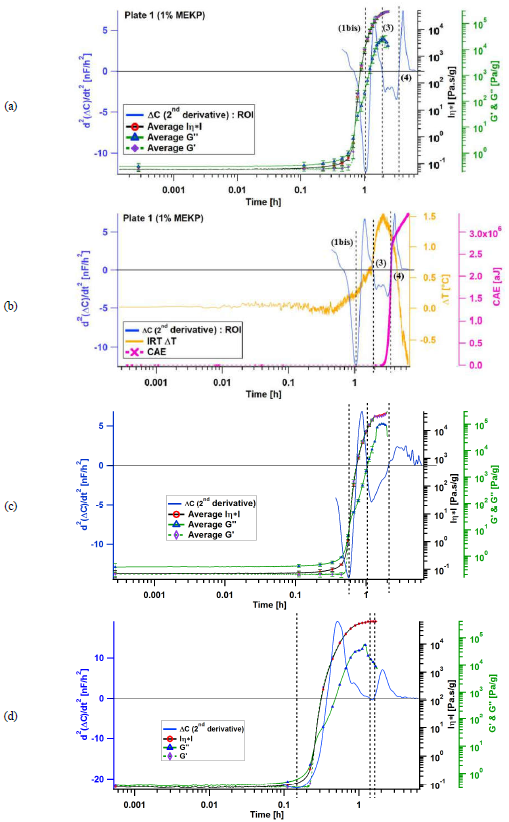 Fig. 4. ΔC second derivative and rheological measurements of PMC plates with (a & b)1wt%, (c)1.5wt% and (d)2.5wt%
As is already illustrated on the temporal variation of the PZT electrical capacitance as a function of the hardener rate increase (Fig. 3 c), its second derivative changes similarly when the hardener rate is increased. By plotting the two second derivatives with their correspondent obtained results in oscillatory rheology for the two other hardener rates, 1.5wt% and 2.5wt%, in Fig. 4 c & d respectively, it is easy to determine with exactitude the different key steps of the crosslinking process of the liquid polyester resin using the same methodology developed by Tuloup et al.
4 Conclusions
The aim of this study was to evaluate the potential of the in-situ PZTs to be used as real-time PM devices. In order to evaluate this potential, the infusion device for the fibrous stacks in 2/2 twill glass fabrics by a liquid polyester resin was instrumented by two NDT techniques: AE and IRT. Three hardener rates were used to evaluate the sensitivity of the electrical capacitance of the PZT transducer, integrated into the core of the PMC material, to real-time detection of the various key stages in the crosslinking of the thermosetting resin. The hardener rate increase from 1wt% to 2.5wt% generated a faster and greater crosslinking exothermic (measured by the IRT technique), an earlier and more energetic transmission of the acousto-ultrasonic waves and a speed crosslinking evidenced by the electrical capacitance variation of the PZT transducer which changes from a convex tendency to another concave. The NDT results were confronted with the other obtained in the oscillatory rheology carried out on many samples in resin mixed
with the different studied hardener rates. It turns out that the intersection of two moduli G' and G" in oscillatory rheology coincides with the first minimum of the second derivative of the electrical capacitance, indicating the gelation of the polyester resin. The stabilization of |η*| and G' (meaning elastic behavior), as well as the passage of G" through its maximum towards a return to zero, coincide with the third zero passage of the second derivative of the electrical capacitance, thus marking vitrification. The end of crosslinking was detected by the last zero-crossing point of the second derivative. This point could not be evaluated by the rheological measurement at the risk of damaging the rheometer.
