1 Introduction
Compression moulding of high fibre content, long discontinuous carbon fibre based Sheet Moulding Compound (SMC) is an attractive solution for high-volume manufacturing of high-performance composite structures, and is the one composites manufacturing process that has the potential to meet future automotive weight saving demands for cost, volume and structural integrity. Unlike continuous fibre prepreg, SMC flows under compression force to fill the mould cavity, allowing complicated geometry (e.g. ribs and bosses) to be manufactured. The manufacturing wastage is also lower than prepreg as the initial charge does not need to be net-shaped, but understanding and modelling the flow behaviour of SMC is crucial to correctly predict the mould filling process, and to improve the part quality.
Process simulation has been widely regarded as a very efficient process optimisation tool, as it significantly reduces the physical resources required to apply a manufacturing process. There are a number of existing commercial flow simulation software packages with compression moulding capabilities, for instance Moldex3D and 3D TIMON. However, these models are commonly adapted from injection moulding models, with no dedicated material models specifically developed for SMC. The constitutive models for liquid materials is usually defined by viscosities. In case of injection moulding, the material is primarily subjected to shear stress, and the constitutive relation can be modelled using the shear viscosity. However, for compression moulding of SMC, the material is typically subjected to very high normal stress (~120bar), and the elongational viscosity becomes highly important in analysing the flow [1]. Constitutive models adapted from injection moulding models don’t take into account the elongational viscosity, therefore the suitability of using such models for SMC is questionable. Further, the process settings are also not fully tailored for typical compression moulding processes in those adapted models. One important example is that in compression moulding, the temperature of the female mould half is usually higher than the temperature of the male mould half in order to compensate the thermal expansion of the mould. Modelling different mould temperatures is relatively straight forward for injection moulding simulation as the mould cavity is fixed. However, for compression moulding the mould cavity changes during closure, which makes it very hard to impose different temperature conditions unless the mould halves are physically modelled. Another example is that the switch-over between displacement and force control usually takes place immediately in injection moulding but gradually in compression moulding due to the inertia of the moving press platen. Nevertheless, such software has become increasingly popular for SMC compression moulding process simulation, even though little validation has been done to assess the robustness and accuracy of such models.
This paper aims to provide an independent and comprehensive assessment of existing well-known process simulation software for SMC compression moulding. The candidates include Moldex3D 2020 developed by CoreTech System Co., 3D TIMON version 10 developed by Toray Engineering D Solutions Co., and Moldflow Insight Ultimate 2021 developed by Autodesk. It should be noted that there are two types of analysis available in 3D TIMON for compression moulding simulation: the Euler method and the Morphing method, and both are assessed in this paper. The selected software will be compared in terms of material models and available process (boundary condition) settings in order to determine their robustness as a compression moulding design tool. The predictive accuracy of the software will also be assessed by comparing simulated compression force and filling patterns against the experimental data.
2 Experimental approach
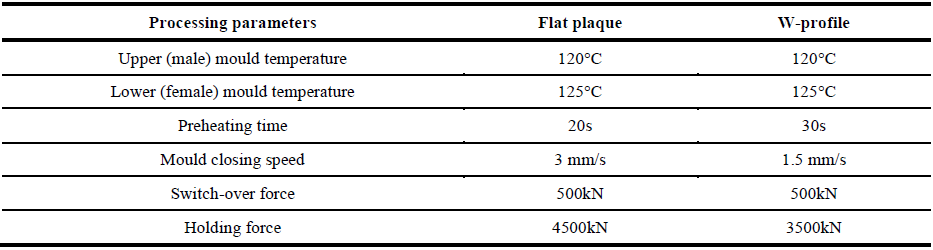
Experimental compression moulding has been performed on an Engel V-Duo 1700 tonne press based at WMG. The material used in this study is a commercial vinyl ester based carbon fibre SMC (CF-SMC) with 12.7mm fibre length and 47% fibre weight fraction (37.15% volume fraction). Two demonstrator part geometries have been selected in this paper. The first one is a 550mm x 550mm x 2mm square flat plaque with a rectangular initial charge positioned along one edge of the square to encourage a 1D flow regime (see Fig. 1a and b). The initial charge has an area of 500mm x 182mm (approximately 30% coverage). The second geometry is a generic “W” shaped profile with overall dimensions of 600mm x 300mm x 61mm, and contains ribs in a repeating pattern (referred to as ‘W-profile’ in the rest of the paper, see Fig. 1c and d). Two rectangular initial charges are positioned at the bottom of the W-profile to encourage a 3D flow regime. Each charge has an area of 570mm x 60mm. A summary of the processing parameters used for manufacturing each demonstrator part is provided in Table 1. Note that the preheating time in Table 1 refers to the duration from the start of the cycle till the upper mould is in contact with the charge. The actual preheating time is longer as there is a delay to the start of the cycle after the charge has been transferred into the mould. The actual instantaneous mould height, closure speed and compression force can be directly exported from the press. Partial closures have been performed to investigate the filling pattern for each geometry. It should be noted that parts moulded using partial closures don’t represent the instantaneous fill pattern at the time the mould is closed, because the material will continue to flow further due to inertia. However, they still provide useful information on the progression of flow.
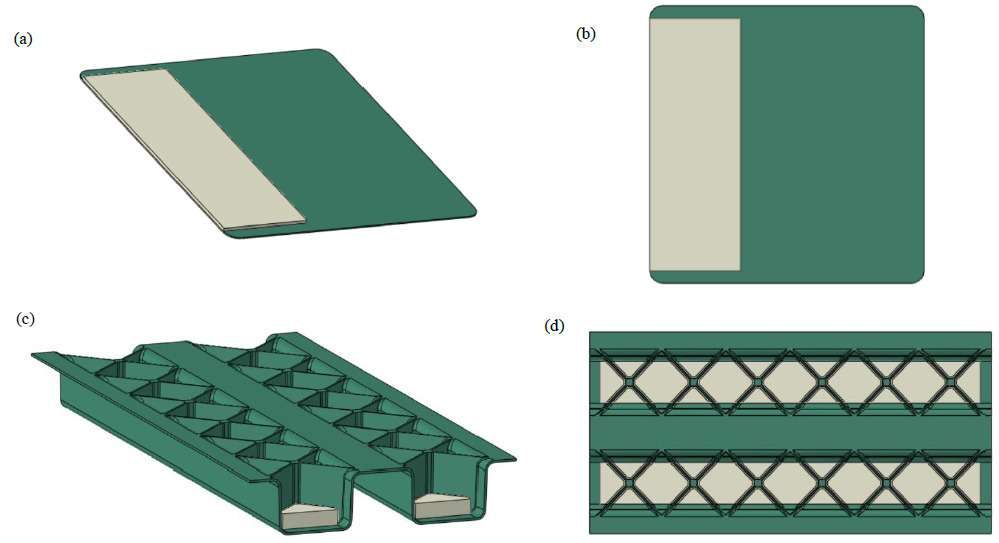 Fig. 1: Part geometry (green) and initial charge layout (beige) used in the case studies. (a) and (b): perspective view and top view for the part and initial charge for the flat plaque. (c) and (d): perspective view and top view for the part and initial charge for the W-profile.
Table 1: Processing parameters used for the experimental compression moulding processes. The pre-heating time refers to the duration from the start of the cycle till the upper mould half is in contact with the charge.
3 Compression moulding process simulation
This paper only focuses on the flow/fill analysis from compression moulding process simulations, and the downstream packing, warpage and mechanical properties analysis will not be studied. The material properties input required by the flow solver for all software include reactive shear viscosity, cure kinetics, uncured and cured densities, specific heat and thermal conductivity. Table 2 summarises the corresponding material models available in each software, where the details of each model can be found in the user manual for each software [2-4]. In general, Moldex3D offers more material modelling choices, but the assessment of different material models is beyond the scope of this paper. The models selected in this paper are underlined in Table 2, which are available in all the candidate software. Material properties input data are provided by Toray Engineering D Solutions Co., and where data fitting is required, the fitting parameters are determined using 3D TIMON’s data fitting tool. Due to the reason of confidentiality, details of the material properties input data will not be disclosed in this paper.
Table 2: Summary of the material models used by the flow solver of the candidate software. The underlines indicate the material models selected for each software.
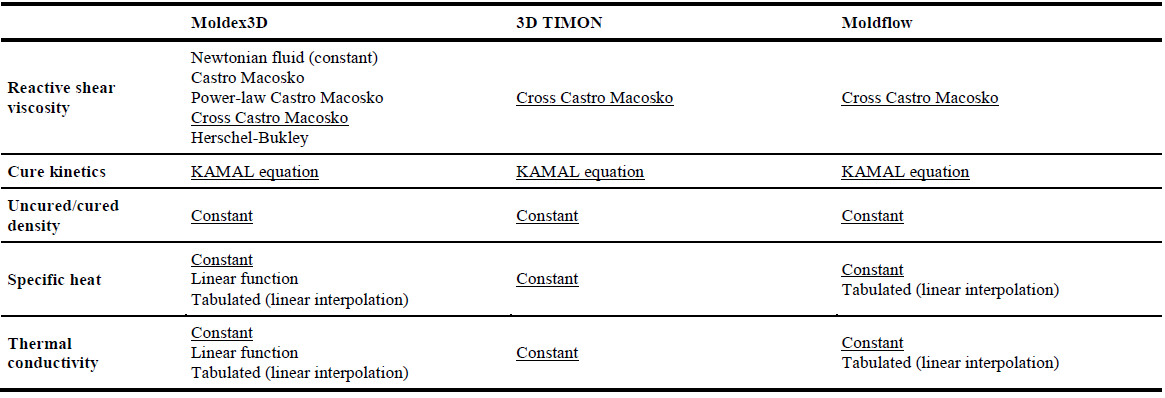
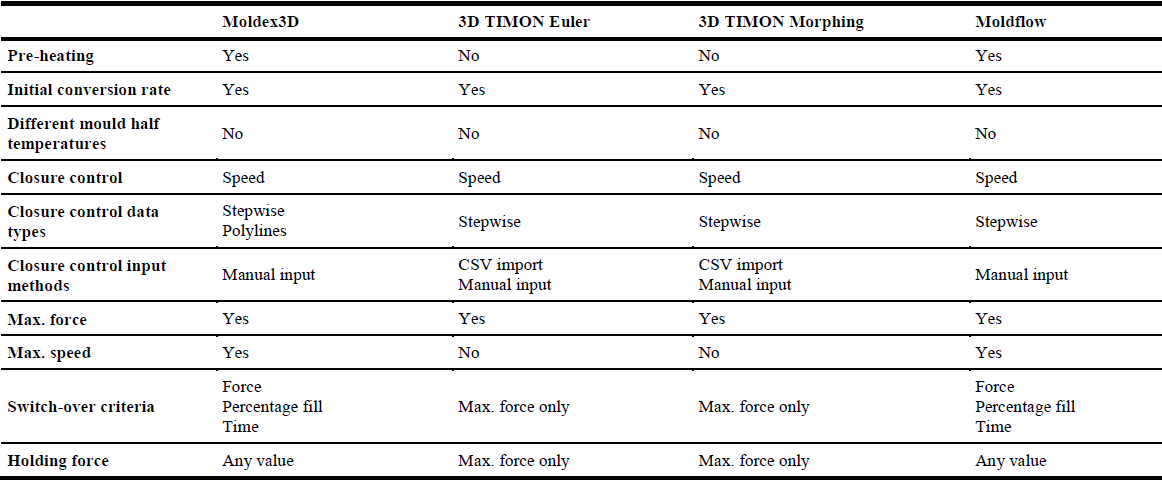
Table 3 compares the supported processing settings for each candidate software package. All candidate packages offer similar capabilities according to Table 3. The switch-over control in 3D TIMON is relatively limited compared with the other two candidates. However as discussed earlier, the switch-over cannot be correctly modelled anyway without considering the inertia of the press platen. In order to make sure the closure profile is modelled as close to reality as possible, the closure process has been modelled using speed control only (i.e. no switch-over) according to the press data. Other processing parameters have also been made identical in all software: The mould temperature in the simulation is 125°C for both mould halves. Due to the difficulty in determining the actual pre-heating time, the process has been modelled with no pre-heating, but with an initial charge temperature of 120°C and initial conversion rate of 0. A maximum force cap of 10,000 kN has been applied to all models, which is much higher than the actual maximum forces in the experiment (see Table 1).
Table 3: Overview of the supported processing settings for each candidate model.
4 Results and discussions
4.1 Flat plaque
Compression height vs. time curves for the flat plaque are compared in Fig. 2 (dashed lines) between the experimental press data and the simulation outputs, in order to make sure the closure profile in the simulation matches the experiment. Good agreement in closure profile (compression height vs. time) between the simulation and the experiment has been achieved with all models, with a 15.4% maximum difference in total closure time (Moldex3D). The mismatch in compression height is usually due to the mismatch in time increment between the simulation and the experiment. There is also a slight mismatch in the final height between the simulation and the experiment, which also leads to the mismatch in the total closure time. This is due to the change in density caused by conversion, and cannot be easily anticipated when setting up the simulation.
Compression force vs. time cures for the flat plaque are also compared in Fig. 2. It is interesting to see that none of the models have achieved good agreement with the experimental results. With Moldex3D, the compression force predicted is much higher than the experimental compression force, so that the maximum force limit (10000kN) is triggered even before the end of the closure, and the analysis is aborted. A modified Moldex3D analysis has also been performed with the reactive shear viscosities reduced to 10% of the original values. With the modified viscosity model, Moldex3D is able to complete the analysis without triggering the force limit, but the shape of the compression force curve is very different from the experimental curve: the predicted compression force curve has a very slow rise during the majority of the closure process, with a dramatic increase toward the end, where the experimental curves shows a much more steady increase throughout the process. And even with the reduced viscosities, the maximum compression force predicted by Moldex3D is still 480% higher than the experimental maximum force. The compression force vs. time curve predicted by Moldflow has a very similar characteristic shape with the modified Moldex3D curve, but with a much lower maximum force that is closer to the experimental maximum force (8.6% higher than the experimental value). The curves predicted by the two 3D TIMON models have much more similar characteristic shape with the experimental curve, where the compression force increases much more steadily throughout the process, although the Euler method predicts a rapid increase in compression force towards the end. Both 3D TIMON models tend to over-predict the compression force, where the Morphing method over-predicts the maximum force by 232% and the Euler method over –predicts the maximum force by 917%.
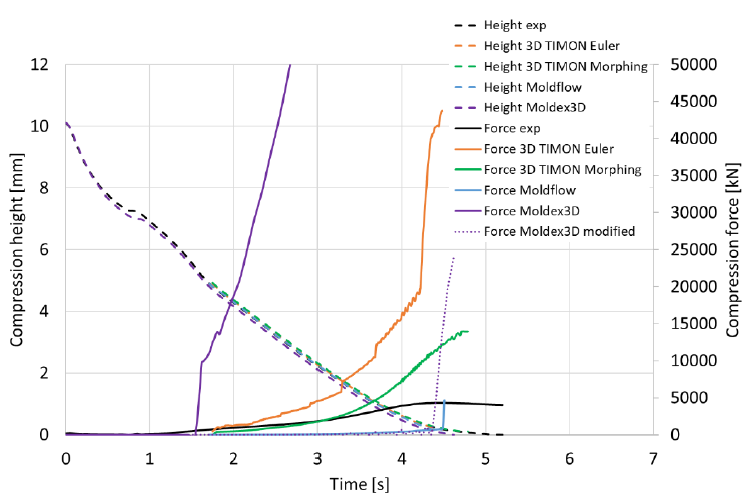 Fig. 2: Comparison of compression height vs. time and compression vs. time between the experimental data and the simulation outputs for the flat plaque. The Moldex3D modified force refers to the analysis where the reactive shear viscosities have been reduced to 10% of the original values.
Fig. 3 compares the filling patterns between the experimental partial closures and the simulation results, where the Moldex3D results are taken from analysis using modified viscosity model. As discussed earlier, experimental partial closures do not represent the instantaneous flow pattern at the time the mould is stopped. Therefore, the simulation results presented in Fig. 3 are taken at the time frame of 4s, and do not correspond to the experimental partial closure of 1mm. The flow front for the 1D flow case is approximately a straight line, and non-uniformity in the experimental flow front are mainly due to the heterogeneity of the material. The differences in the simulation results are likely to be caused by different friction models adopted by each solver.
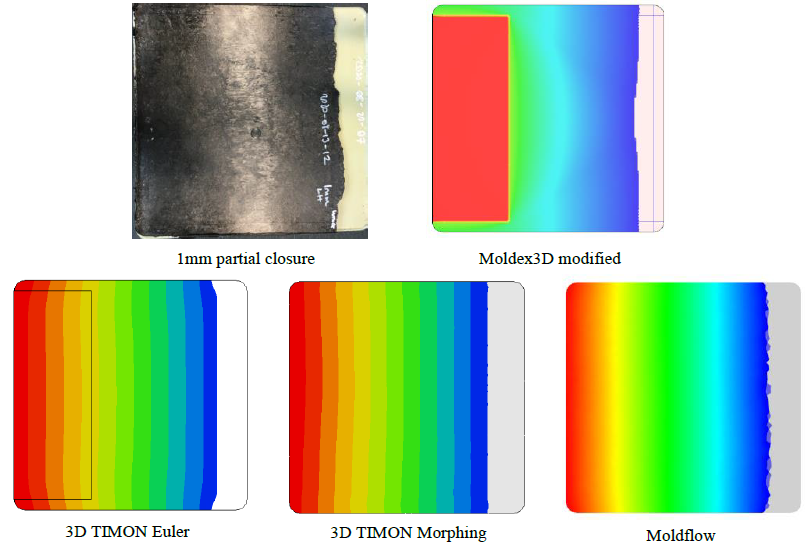 Fig. 3: Comparison of filling patterns between the experimental partial closures and the simulation results for the W-profile geometry. All simulation results are taken at the time frame of 4s. The contours plots from the simulation indicate the pressure distributions within the material, but are not plotted on the same scale.
4.2 W-profile
Fig. 4 compares the closure profile and the compression forces between the simulation and the experimental data. Similar to the flat plaque study, the closure profiles predicted by all models show good agreement with the experimental data. And a second Moldex3D simulation with modified viscosity model has been performed as the simulation with the original viscosity model has failed to complete again. Interestingly, the two 3D TIMON models show very good correlation with the experimental data in term of compression forces, although the experimental data are much noisier, which is probably caused by the press itself. The compression force curves predicted by Moldex3D and Moldflow have very similar characteristic shape with the curves from the flat plaque study, where the compression force increases very slowly during the majority of the process, followed by a dramatic increase just before the mould is fully closed. Moldex3D still over-predicts the maximum compression force significantly (by 96.7%) even after the viscosities have been reduced to 10% of the original values.
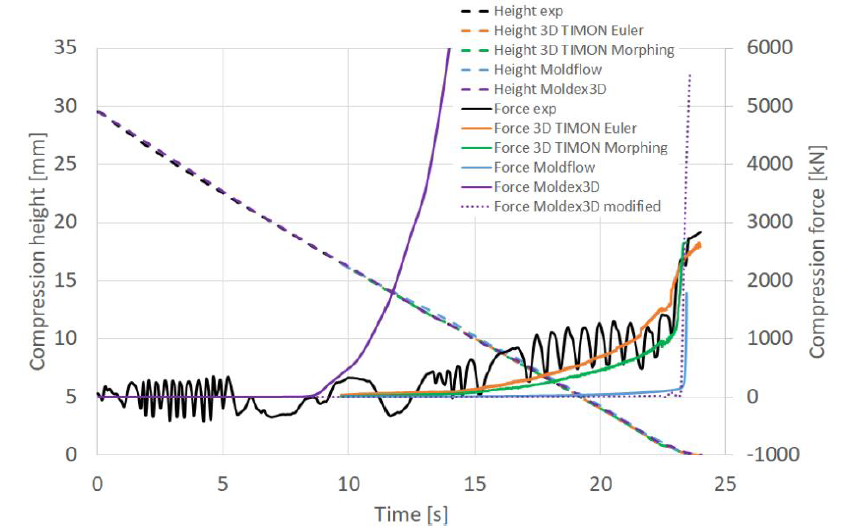 Fig. 4: Comparison of compression height vs. time and compression vs. time between the experimental data and the simulation outputs for the W-profile. The Moldex3D modified force refers to the analysis where the shear viscosities have been reduced to 10% of the original values.
Fig. 5 compares the filling patterns between the experimental partial closures and the simulation results, where the Moldex3D results are taken from analysis using modified viscosity model. As discussed earlier, experimental partial closures do not represent the instantaneous flow pattern at the time the mould is stopped, because the material will continue to flow due to inertia. Therefore, the simulation results presented in Fig. 5 are taken at two interim time frames (17s and 23s), and these do not correspond directly to the experimental partial closures (8mm and 4mm). It is interesting to see that despite the compression force predictions generally having better correlation with the experimental data as compared to the flat plaque study, the filling pattern predictions are a lot worse. The experimental results suggest that the vertical side walls are filled first, and the material then enters the ribs from the side, and the crossovers of the ribs are the last points of fill. However all simulation results predict that the rib crossovers are filled first, followed by the ribs and then the vertical side walls, which is the opposite order as in the experiment. One possible explanation for the discrepancy is the anisotropy of SMC. When the material flows into the side walls, the fibre bundles are still in the same plane as the flow, but when the material flows into the ribs the fibres have to be pinched into the ribs and flow out-of-plane, which creates extra resistance due to the flexural stiffness of the fibres and the natural in-plane ‘laminar’ structure of the raw SMC. Therefore, there will be higher level of hesitation at the rib entrance compared to at the side wall entrance. All the simulation packages assume that the material properties are isotropic, therefore cannot predict this hesitation correctly.
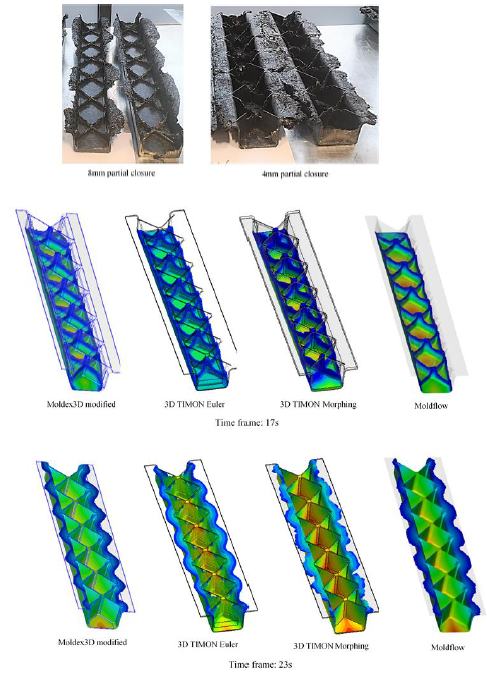 Fig. 5: Comparison of filling patterns between the experimental partial closures and the simulation results for the W-profile geometry. The contour plots from the simulation indicate the pressure distributions within the material, but are not plotted on the same scale.
5 Conclusions
Commercial compression moulding simulation software including Moldex3D, 3D TIMON and Moldflow have been compared in this paper. The capabilities of each software are compared in terms of the available material models and processing settings. In general, each software has its own advantages and disadvantages in terms of capabilities, and the user should choose the most suitable software based on the experimental processing conditions.
A flat plaque geometry and a W-profile geometry have been selected in this paper to assess the predictive accuracy of each software by comparing the simulation results against experimental compression moulding data. For both geometries, Moldex3D has failed to complete the fill analysis due to the excessive compression force predicted by the software, where a modified material model with the shear viscosities reduced to 10% of the original values have to be used. For the flat plaque study, none of the simulation software has achieved good agreement with the experiment in term of compression force predictions, although the force vs. time curved predicted by 3D TIMON’s Morphing method has a more similar characteristic shape with the experimental curve than the other software/methods. However, the filling patterns predicted by all four models show good agreement with the experimental observation. For the W-profile study, both 3D TIMON Euler method and Morphing method have achieved good agreement with the experimental data in term of compression force predictions. The filling patterns predicted by all simulation software show poor agreement with the experimental partial closures, possibly due to the anisotropy of the material. It is difficult to fully understand the limitations of each the software without knowing the constitutive models used by each software. Nevertheless the observations from this paper suggest that developing dedicated material models and constitutive models for SMC compression moulding might be necessary.
Acknowledgements
The authors would like to acknowledge the financial support from the EPSRC Future Composites Manufacturing Hub (grant number EP/P006701/1).
