1 Introduction
Infrared welding is a sequential welding process composed of four main steps (Cf. Fig. 1). Two thermoplastic composite (TPC) parts are positioned on the upper and lower welding tools. Vacuum grippers maintain the spatial position of each part during the process as well as the appropriate homogenous contact with the welding tool. First, the welding area of each TPC part is heated through a set of infrared lamps containing shortwave quartz emitters. The lamps are fixed symmetrically on a mobile frame, enabling identical heating of the upper and lower parts. In-plane control of the heating area is assured by a socalled shadow plate, which shields the TPC surface outside the welding area. Each lamp is independently controlled through a segment-based cycle of the applied power as a function of time. The power repartition through the welding width is experimentally determined and is not discussed here. Only the heating time, which is directly linked to the surface temperature, is evaluated in this work. Phase I consists of heating up the TPCs until deconsolidation starts. During this phase, no morphological change such as void content variation is considered. Phase II starts when deconsolidation voids appear on the first layer of the TPC and is finished when the IR lamps switch off. The deconsolidation of the TPCs induces a significant thickness increase because of void growth [1], [2]. The heating time covers both phase I and phase II. Phase III covers the change-over operation, where the mobile heating frame moves back and where the upper and lower tools move up to make intimate contact with both TPC welding parts. Finally, phase IV consists of applying the pressure and cooling down mainly by thermal conduction through the TPC and welding tool. Figure 1 (b) shows a temperature profile measurement of a 0.5 mm thermocouple, embedded onto the TPC surface, here with a sampling rate of 20 ms.
In this work, the authors experimentally investigate the impact of the thermal gradient variant resulting from thermal conduction variation at the interface TPC/welding tool on the resulting material properties.
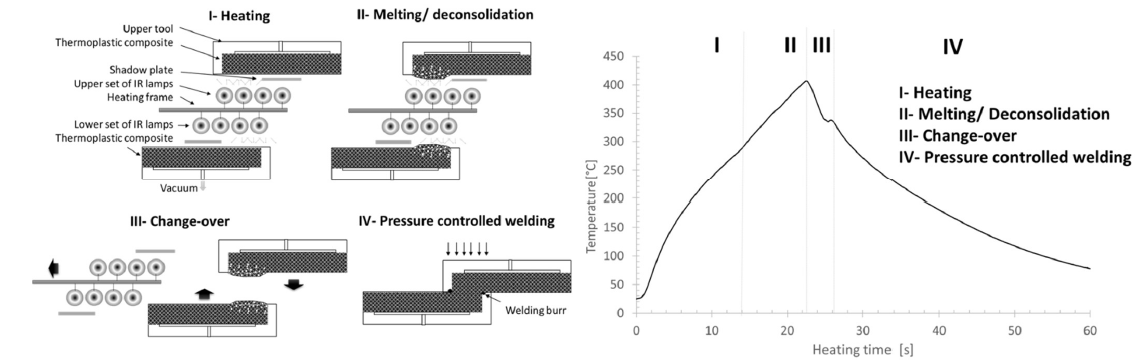 Fig. 1: Infrared welding principle of the TPC (left) and typical thermal profile onto the TPC surface
2 Experimental procedure
2.1 Thermoplastic composite
For this study, a reinforced thermoplastic laminate is supplied by Toray©. The selected laminate, Cetex 1225, is made of 6 plies presenting a quasi-isotropic lay-up: [0°/45°/90°]. The carbon weave is a 5 Harness Satin made of a T300JB carbon filament. The consolidated ply thickness is 0.31 mm, and the laminate thickness is approximately 1.86 mm. The reinforcement is impregnated by a low-melt polyaryletherketone (LMPAEK) presenting a glass transition temperature at 147°C, a melting temperature at 305°C.
2.2 Deconsolidation of the laminate
The deconsolidation phenomenon is well known in TPC processing, such as automated tape placement [3] or TPC thermal stamping. In these cases, mainly homogenous deconsolidation is investigated. In high-performance TPC welding, pressure is conventionally applied during heating, and consequently, the deconsolidation phenomenon is limited. In infrared welding, deconsolidation seems to have a major impact, as significant voids are created before any pressure is applied. In addition, cooling starts during the heating frame change-over time phase. Following phases I and II, which result in a significant thermal gradient above the melting temperature from the surface, the TPC part of the back surface is close to the tooling temperature. To evaluate the material response under infrared heating, interrupted cycles at different heating times are performed. After the heating step, natural cooling is allowed. Specimens are cut through the width direction and polished, and cross-sections are observed by microscopy. Fig. 2 shows a set of reconstructed cross-sections made of five neighboring images after 10 s, 14 s, 18 s and 20 s of heating time. As expected, the porosity gradient through the thickness is strongly dependent on the heating time. Porosity appears suddenly, inducing a sudden thermal conductivity change in the material. A clear inflection point is visible on thermal measurement during the heating step. Image analysis is performed to estimate the void evolution at each ply level depending on the heating times.
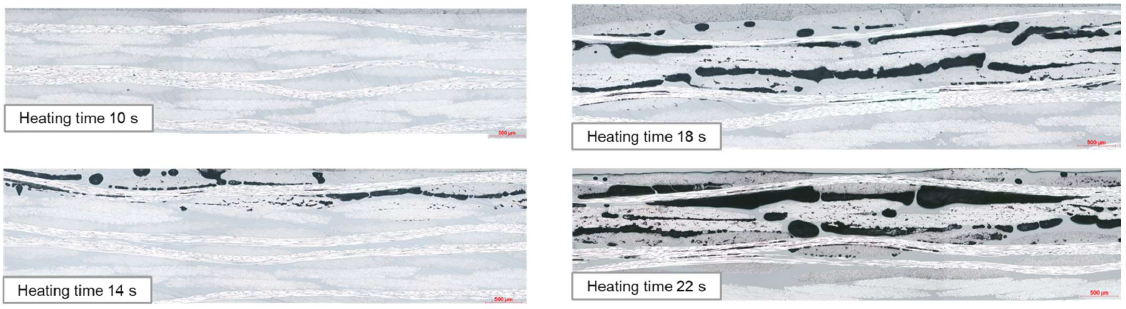 Fig. 2: Cross-sections of infrared heated TPC depending on heating time
2.3 Test plan
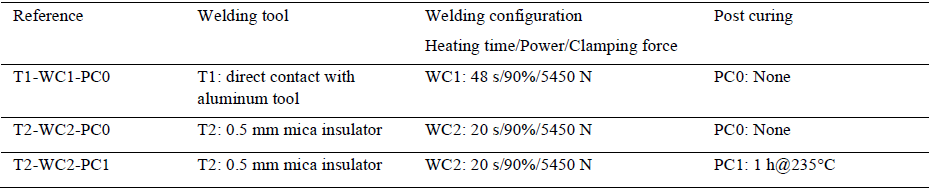
The test plan proposed in this paper is described in Table 1. The pressure ply during welding and the applied power are not considered here as variables. Previous experiments have been performed, enabling the proposed value to be determined.
Table 1. Test plan.
2.4 Welding tool
Conventional automotive welding tools are made of aluminum, and the currently used materials are made of unfilled polymer or glass fiber reinforced polymer, presenting low thermal conductivity compared to the material studied here. Two welding tool configurations are investigated: the conventional welding tool, called T1, using a direct contact between the TPC and the 40 mm aluminum welding tool, and an alternative welding tool, called T2, using an additional 0.5 mm thick insulation (mica) layer at the interface between the TPC and the welding tool. The resulting thermal gradient for both welding configurations was analyzed (Cf. Fig. 3) through the internal developed numerical tool implemented in MATLAB© code and called “LysIR”. In this case, study, only phase I prior to the deconsolidation of the laminate is simulated. The heating time is 13 s, followed by natural cooling. Welding tool configurations significantly impact both phases, mainly due to the significant thermal conduction occurring from the TPC into the welding tool. It is also important to note that the cooling speed immediately after the heating phase is three times more important in T1 than in T2, with cooling rates immediately after heating times of approximately 75°C/s and 27°C/s, respectively.
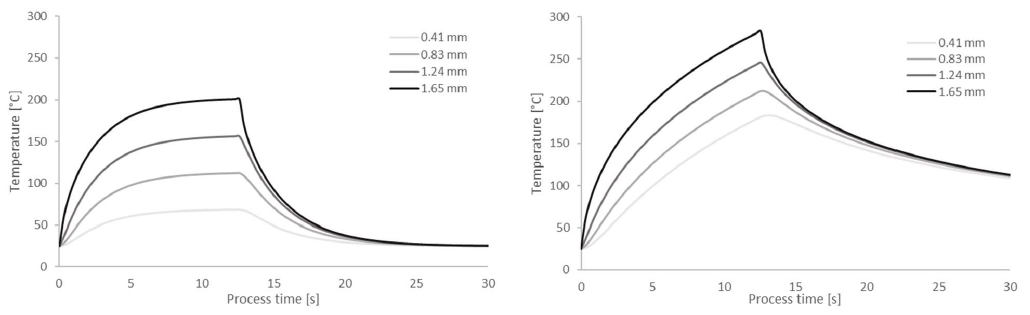 Fig. 3: Numerical thermal gradient during phase I resulting from LysIR for welding tools T1 (left) and T2 (right)
2.5 Welding process
IR welding experiments are carried out using FRIMO’s infrared welding machine ECO800 equipped with a welding tool enabling the assembly of two 100 mm length composite plates with an overlap of 12.7 mm. The welding line has a 400 mm width. Single lap shear samples are cut in a later stage through water jet cutting at a width of 25 mm.
The heating time is adjusted depending on the welding tool configuration. The temperature at the welding step start has to exceed the melt temperature of the polymer. A minimum of 20°C above the melt temperature is targeted. Experimental investigation is necessary to accurately determine the appropriate heating time. Type K thermocouples with a 0.5 mm diameter are positioned on the surface to weld. A Picolog© data logger is used for temperature acquisition with a sampling rate of 1 s. Thermocouples are embedded in the laminate through a thermal vacuum consolidation process in a preliminary step to measure the temperature inside the laminate and reduce the contact resistance or air gap between the sensor and the TPC.
By the T1-WC1-PC0 configuration, 48 s of heating is necessary to reach the welding temperature. Phase I presents an asymptotic trend up to the start of decompaction. The corresponding inflection point is easily visible at 24 s. The sudden decrease in the thermal conductivity at the TPC surface enables an increase in the surface temperature rate during phase II. By T2-WC2-PC0, heating in both phases I and II is much more homogenous. The decompaction starts at 13 s, and the heat rate change is less marked.
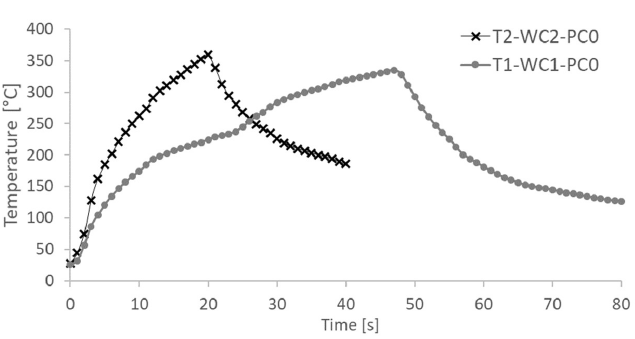 Fig. 4: Measured first ply temperature for T1-WC1-PC0 and T2-WC2-PC0 references
2.6 Postcuring
Like most of the PAEK family members, LMPAEK is a semicrystalline polymer. Differential scanning calorimetry (DSC) is used to characterize the crystalline state at the welding interface through peeling and analysis of the first ply. In addition, to highlight how high interfacial crystallinity can promote mechanical performance, a postcuring step is proposed. To avoid any issue during recrystallization, such as crystallization shrinkage, the postcuring step is performed under the heated plates of a press. Arbitrarily, a pressing time of 1 hour under 10 bars at 235°C is selected.
3 Results
3.1 Voids growths per woven ply
Laminate deconsolidation occurs suddenly at the woven ply level first so that a significant change in the thermal properties is observed, inducing an inflection point on the surface temperature evolution. To better understand this phenomenon, image analysis is performed. A set of five microscopic images is reconstructed for each infrared heating sample from 8 s to 24 s heating time. By image analysis using ImageJ software, the porosity level for each ply is measured. A homogenous ply thickness is considered for each time step. As the ply thickness varies depending on the time step, manual ply area recognition is realized. The results confirm the general growth of porosity during the heating phase. In more detail, we can observe the sudden deconsolidation effect of each ply, between 13 to 14 s for the first ply layer, between 16 to 17 s for the second ply layer and between 17 s to 18 s for the third ply layer. In less than 1 s, when the ply beings to undergo deconsolidation, approximately 10% porosity appears. By a finer observation of the porosity evolution per ply layer, an increase is first observed, followed by a short decrease prior to constant decompaction. This sequential behavior can be explained by the combination of two different mechanisms [4] of deconsolidation and void generation. First, prior to melting, the moisture content in the polymer induces vapor voids. The internal void pressure induces porosity growth when the polymer begins softening again. When the melting temperature is reached, the internal void pressure is released, and the porosity volume declines. Deconsolidation is also triggered by the release of the internal residual stress contained in the reinforcement weave [2], which is generated during laminate manufacturing. The 2D image analysis of the microscopy views is too limited to be able to distinguish both phenomena.
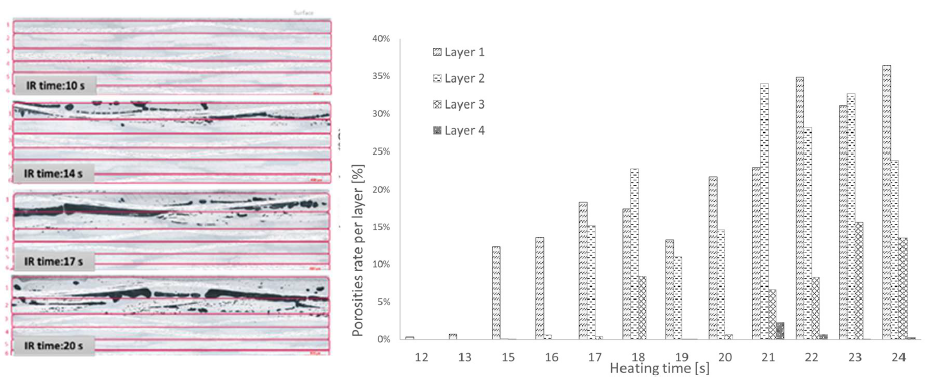 Fig. 5: Microscopic views of the composite laminate decompaction in the WC-2 configuration as a function of infrared heating time and thermal gradient through the part as a function of void growth
A Maxwell [5] model can be used to numerically calculate the effective thermal conductivity 𝑘eff through the thickness of each ply as a function of the porosity volume 𝜏p, thermal conductivity of air 𝑘air and thermal conductivity of the TPC 𝑘TPC. The thermal conductivity of the TPC in this study is measured with a HotDisk TPS 2500 S device on a 50×50 mm laminate sample. An average axial (through the thickness) thermal conductivity of 1,338 W/m/K is measured.

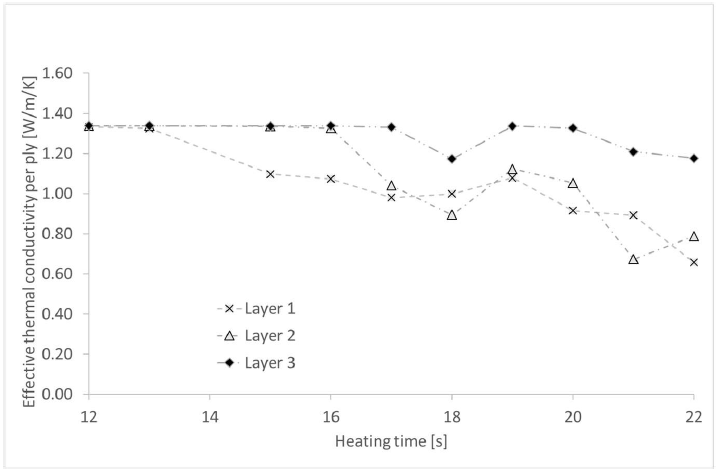 Fig. 6: Effective thermal conductivity per laminate layer
3.2 Nondestructive testing
Microcomputed tomography is used to quantify and localize residual porosity at the joint scale. A welded sample of 12,5×12.5 mm is cut on the welded plate. A large focal spot is selected, with the following parameters: filament, 90 kV – 200 μA – 18 W FR=1.60 – Avg=10. This provides a voxel size of 25 μm.
The first average porosity volume is determined per welding tool configuration: 5,20% of the residual porosity is measured (cf. Fig. 7) in the WC-1 welding configuration, instead of 0.52% for the WC-2 configuration. Welded joint material properties are undoubtedly strongly sensitive to the thermal gradient, particularly during the change-over time, where cooling down occurs prior to welding. This result is also confirmed by the porosity volume repartition. The WC-1 configuration welded interface presents quite good morphology; notably, however, a significant porosity volume is located on the second ply below the welded area. This resulting morphology is specific to the sequential welding process, where decompaction arises prior to pressure application and welding. By the WC-2 configuration, a similar porosity repartition is visible but is much smaller in the number and size of voids.
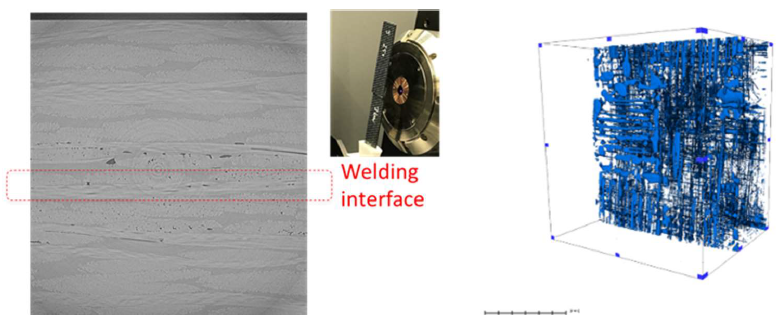 Fig. 7: μ-CT of the reference T1-WC1-PC0: typical slice (left), sample view in μ-CT (middle) and void volume repartition (right)
3.3 C-scan ultrasonic testing
Welded plates are also controlled by the ultrasonic testing method. Here, the full-scale welded line is controlled at 12.5 mm width × 400 mm length. An immersion tank and a 5 MHz focalized transducer from Mystras are used. UTwin™ is a data acquisition, imaging, and analysis software system. Measurements are performed with an in-plane resolution of 0.5 mm. For the WC-1 welded plate configuration, no back echo is observed, as expected in regard to the rather high porosity level. For the WC-2 welded plate configuration, presented in Fig. 8, a significant high back echo (Cf. Fig. 8-A) is observable on the main welded area. No major intermediate echo is observed (Cf. Fig. 8-B). This traduces to a low signal attenuation crossing the welded material in the A-scan and B-scan and consequently is evidence of a high-quality level of the joint quality (Cf. Fig. 8-C and 8-D).
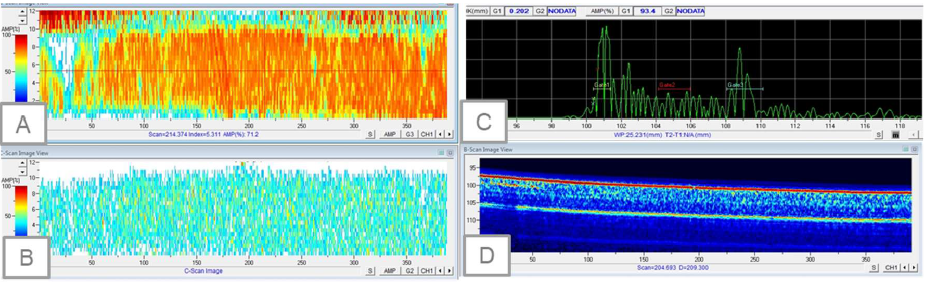 Fig. 8: T2-WC2-PC0 reference by ultrasonic testing: A: back echo, B: intermediate echo, C: typical A-scan; D: B-scan
3.4 Mechanical testing
Welded plates are cut by waterjet cutting to obtain single lap shear samples with a width of 25 mm and prepared according to this method. Five samples are tested per configuration. The results are presented on Fig. 9. The welded specimen on the tooling setup “T1” presents a significant dispersion of the results. Failure occurs mainly through the composite substrate. Such failures are not a common mode for continuous fiber reinforced composite welded joints. Process-induced defects, highlighted above by micro computed tomography, provide a clear explanation. During the welding step, just after the heating-up step and the deconsolidation of both welding partners, cooling-down occurs during the change-over time prior to intimate contact generation. The single lap shear strength (SLS) by the T2 configuration presents a low standard deviation, i.e., 0.7 MPa and the average value without postcuring (T2-WC1-PC0). As expected regarding the low void content, tooling configuration T2 allows a spring of the average SLS value, reaching 43,5 MPa. This value is close to the ultimate mechanical performance, even if the contact time above the melt temperature is very short, less than 2 s. Recent work [6] investigated the adhesion mechanisms depending on contact time through a dedicated experimental device. Three different regimes of adhesion were highlighted, depending on the contact time at several temperatures. An investigation of the adhesion regimes, adapted to infrared welding process steps, over very short times (below 2 s) is necessary to understand infrared welding and the welding time dependency of the mechanical properties. After postcuring under the same tooling and welding conditions, the average LSS value slightly increases, as expected [7], [8], up to 45.2 MPa. The influence of postcuring and the associated crystalline morphology changes should be examined more carefully through complementary test methods, as well as under varying thermal environments.
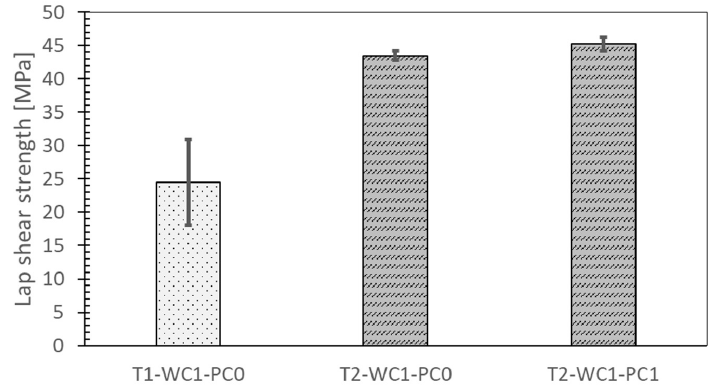 Fig. 9: Single lap shear test results
3.5 Optical microscopy
Optical microscopy analyses are a complementary method to evaluate the quality of welded joints. Optical observation is performed with a Nikon Eclipse LV100 optical microscope (Cf. Fig. 10). This confirms the satisfactory quality at the interface. At both welded edge areas, matrix and fiber flow are visible, mainly on the second ply below the welded interface, which is evidence of the melt state during pressure application. Deconsolidated areas are observed outside the welded area and cannot be reconsolidated during welding, as no pressure is applied outside the overlapping zone. A pressure-controlled scanning electron microscopy (PC-SEM) tool, Quanta FEG 200 (FEI) coupled with an EDS GENESIS XM 4i (EDAX) are used for higher magnification. Electron backscatter diffraction (EBSD) is also performed. Minor porosity is etected at the interface as well as in the second ply (Cf. Fig. 10, images 2b & 2c ). No welding interfaces are observed, with no major morphological changes at the interface (Cf. Fig. 10, image 2a). Edge effects are observed at the welding interface, with a slight resin flow as well as on the second layer (Cf. Fig. 10, image 2d).
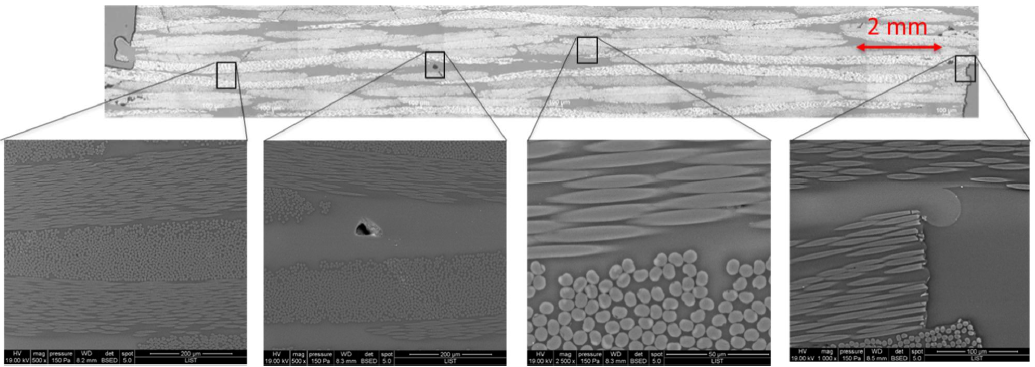 Fig. 10: Cross-sectional views of the T2-WC2 configuration by optical microscopy (top) and SEM (bottom)
3.6 Crystalline morphology at the interface
The crystalline morphology at the interface is studied with the DSC 3+ from Mettler Toledo. The three specimens of the first ply layer are sampled using a sharp blade and analyzed. The results are shown on Fig. 11. As expected, a significant part of the sample without postcuring recrystallizes during the first heat, indicating an initial strong amorphous state. After postcuring, no recrystallization is observed. Failure analysis of the SLS joint is shown in Fig. 12, providing complementary information. Without postcuring, no fiber damage is observed in contrast to the postcuring interface, where cohesive failure is evident in the matrix-rich region as well as at the carbon tow level.
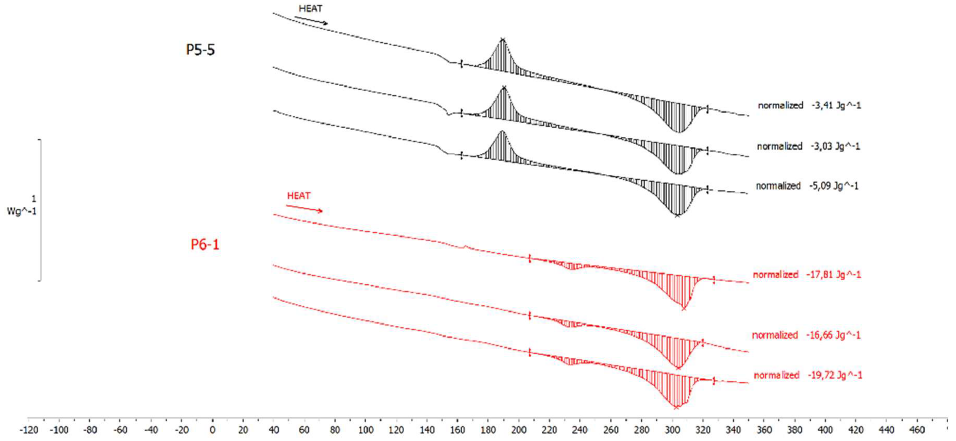 Fig. 11: First ply DSC measurements (each of three samples) on T2-WC2-PC0 (top) and T2-WC2-PC1 (bottom)
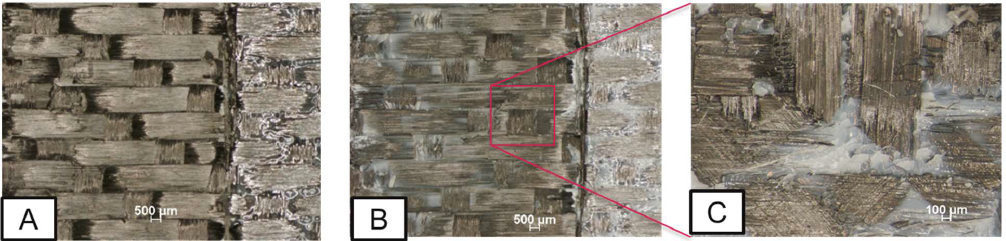 Fig. 12: Failure analysis after LSS of the welded area on T2-WC2-PC0 (A) and T2-WC2-PC1 (B and C)
4 Conclusion
i) An infrared welding process is proposed to weld high-performance structure composite materials. The main advantage of this process is its short cycle duration, which is less than 60 s. A second benefit is the possibility of achieving appealing mechanical performance with welded joints presenting a high material quality.
ii) Through the thickness, the thermal gradient is a key aspect to control by infrared welding. The significant role of the deconsolidation phenomenon is highlighted during the heating phases by the strong evolution of the local thermal properties.
iii) A thermal gradient is also induced by the welding tool configuration, as a great amount of heat is conducted into the welding tool during the whole process. Two welding tool configurations are experimentally studied and are found to have a major impact on the resulting material health as well as on the mechanical properties. Typical residual defects, such as the porosities that remain after welding, are found on the second layer beyond the welded surface. This specific location of the induced defect is specific to the sequential welding process, such as infrared welding, and has not been reported previously in the literature.
iv) Very short cooling-down rates appear during the infrared welding process cycle, which induce a gradient in crystallinity and an amorphous state at the welding interface. The impact of a fully crystallized interface is experimentally explored, and a slight SLS strength improvement is measured. Further characterization is required to better understand the influences of interfacial crystalline morphology.
Acknowledgments
The authors gratefully thank Dr. Doriane Del Frari, Sébastien Klein, Loïc Borghini, Benoit Marcolini for their constant and highly valuable support in nondestructive testing, composite welding and manufacturing, and material thermal analysis.
