1 State of the art and motivation
1.1 Description of the self-pierce riveting process
Self-pierce riveting with semi-tubular rivet (SPR) is the most used mechanical joining technology for car bodies when using aluminum and steel combinations. This joining method can be divided in three steps, shown in Fig. 1. The first step is characterized by positioning the rivet and the sheets between the punch, blank holder and die (a). When the punch presses the rivet in the punch-sided sheet, the rivet pierces a slug out of the material, which remains inside the cavity (b). The contour of the die forces the rivet to expand and an interlock is created (c). [1]
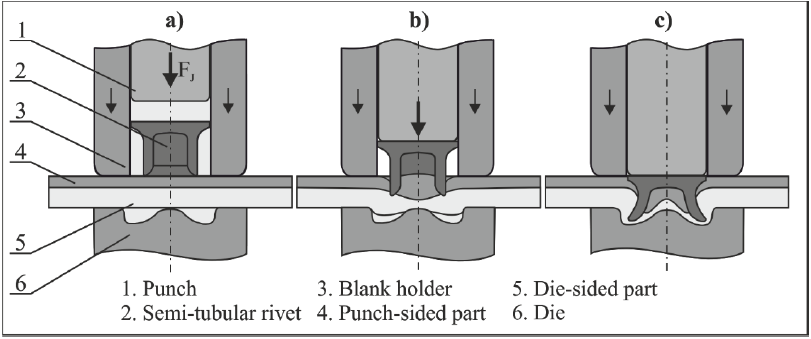 Fig. 1. Process steps of Self-pierce riveting with semi-tubular rivet
1.2 Motivation
A significant development effort in the integration of mechanical joining technology into production is the design of the joining tools and the determination of the resulting joining point properties. Currently, this effort is mainly based on experience or experiments. Particularly in the case of constantly changing design statuses, with which users of mechanical joining technology are confronted, e.g. in automotive construction, the experimental procedure is time-consuming and cost-intensive. Furthermore, the components to be joined and the corresponding equipment must be available for the parameter determination, which is often the case only relative short before the start of production, especially for smaller suppliers. In addition, the necessary know-how for the selection of suitable joining parameters must be available.
This paper describes the development of data-based models for the mechanical joining process of self-piercing riveting with semi-tubular rivet. With the help of these models, joint properties can be determined directly and without experimental or numerical effort for a variety of material and tool combinations. Therefore, the use of these models has very great potential to enable digital business models for system manufacturers and users of mechanical joining technology.
1.3 State of the art: Numerical data acquisition and data-based modelling at mechanical joining
The coupling of a larger number of FEM calculations with statistical design of experiments and evaluation of results by regression methods was first realized for mechanical joining technology in [2]. The content of the investigations were sensitivity and robustness analyses for the clinching process with the objectives of determining relevant process parameters for tool design and evaluating the robustness of the joining process with regard to component fluctuations. In [3-7], this method was applied to self-piercing riveting and it was demonstrated that a larger scope of FEM calculations for metamodeling can also be realized for this process.
In [8], LAMBIASE used the data from 27 clinching process simulations to train an artificial neural network. In the investigations described, the prediction of the neural network could already be used for an optimisation of process parameters. In [9], micrographs in combination with the joining force are used to train a convolutional neural network (CNN). The joining force was varied experimentally for two material-thickness combinations and three micrographs were created for each joining force. With the help of these image and process data, the neural network could be trained in order to subsequently predict a data-based forecast of the joining contour as a function of the joining force. For both material combinations, a very good prediction quality could be achieved in the tested area.
2 Generation of necessary process data for SPR
2.1 Considered material combinations
In the study described here, the SPR process of steel and aluminum sheets with a tensile strength between aprox. 240 to 1020 MPA is investigated. The material properties are described in Table 1. Thereby the strength characteristics were determined via tensile tests.
Table 1. Properties of the considered materials
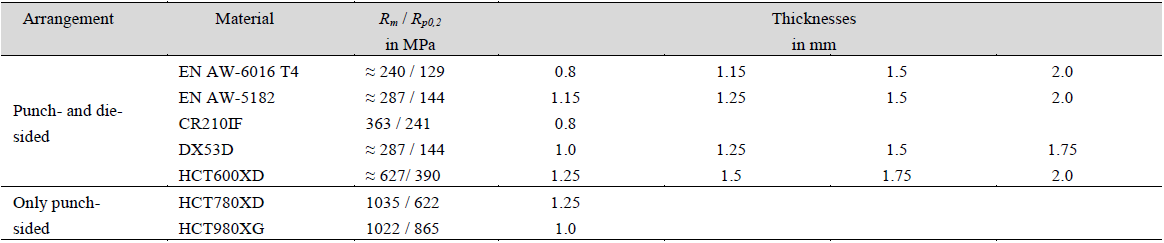
As standard rivets (C- and P-form) are used in this study, the strength of the sheets is limited to a maximum Rm ≈ 1020 MPa. Due to the recommended joining direction for self-piercing riveting with semi-tubular rivets, the strength of the sheets arranged on the die side is a limited to a strength of Rm ≈ 600 MPa. [1]
2.2 Experimental sampling
The process data necessary for model construction were determined on the one hand by experiments and on the other hand by numerical sensitivity studies. For the experimental sampling, based on the materials of table 1, 125 combinations were identified on the basis of a partial factorial experimental design according to the optimized latin hypercube sampling method [10]. All of these 125 material combinations were joined using SPR and evaluated on the basis of 3 micrographs per parameter set. The process parameters like rivet length and die design were chosen experience based.
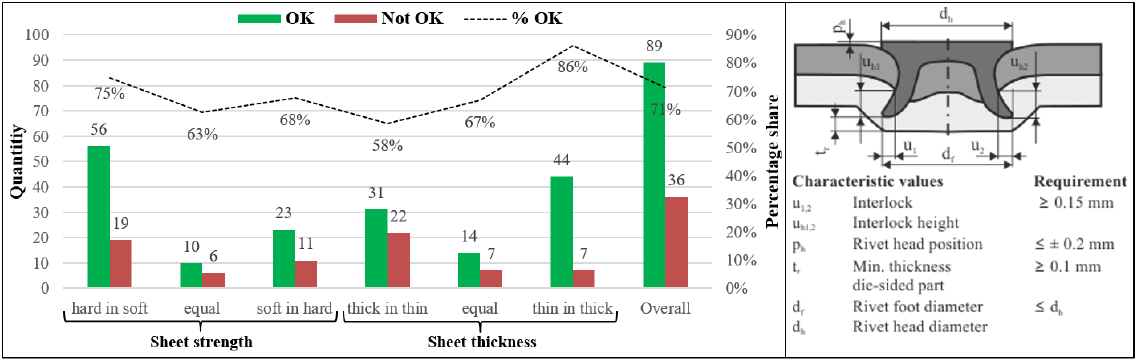
Fig. 2. Results of the experimental sampling for SPR (left) and OK definition of an SPR joint used in this project (right)
Fig. 2 gives an overview of the experimental joining results in relation to the strength and thickness ratios of the 125 SPR joints. In total, 89 of the 125 semi-tubular self-pierce rivet joints could be evaluated as OK. Thereby, in this project, a joint to be considered as OK must fulfill the in Fig. 2 (right) shown requirements as well as the sheets and rivets should be free of any damages. It can be determined, that the general advices on application for SPR, e.g. from [1], that the joining direction "thin in thick" and " hard in soft" leads to better joining results, tend to be confirmed.
2.3 Numerical sensitivity study
The possibility to systematically vary material and process parameters is only partially possible in experiments. Therefore, a comprehensive and statistically based variation of the joining part properties and process parameters was carried out by means of numerical simulation. Therefore for all 125 experimental joints 2D simulation models in Simufact V15 with the in Fig. 3 shown structure were build up. Due to the following numerical sensitivity analysis the simulation models are designed with the background in mind to achieve a good balance between forecasting accuracy and computing time. An average computing time of 13 minutes per SPR process simulation is achieved on a workstation with 14 cores. [11]
The chosen parameters of the combined friction model are a result of a numerical sensitivity analysis by fitting the calculated with the experimental joint contour and force-displacement curve of the SPR process. Flow curves for the sheet and the rivet material are determined by stack compression tests (SCT) due to the good comparability in terms of stress state between SPR and SCT [12].
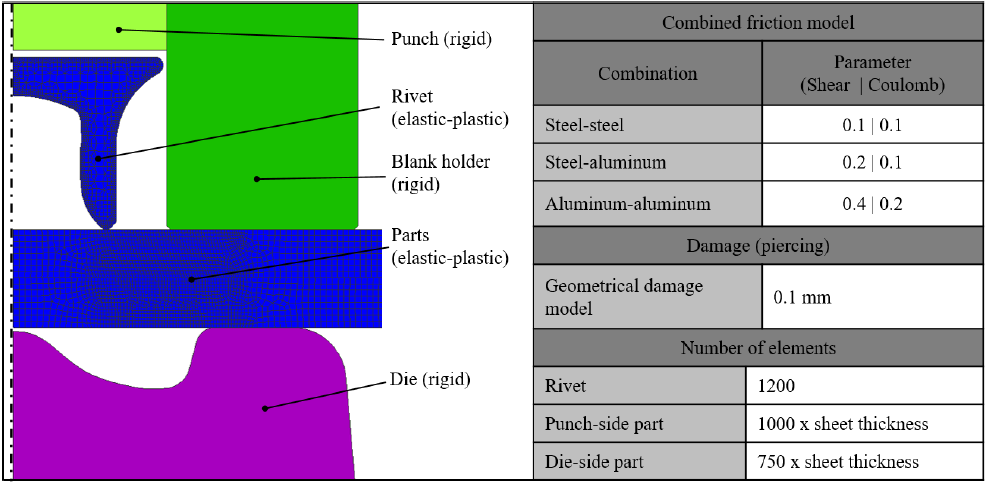 Fig. 3. 2D-simulation model for the SPR-process in Simufact V15
The decisive criterion for the validation of the simulation models regarding sufficient predictive capability was whether the deviation between simulation and experiment was within the average, absolute scatter of interlock and min. thickness of the die-sided part of all experiments. If these conditions were fulfilled and in principle, a good comparability in terms of joint contour and force-displacement progression (Fig. 4) was given, the simulation models were used for the following variation studies. As a result of the evaluation, 71 models showed the necessary accuracy to be used for numerical variation study.
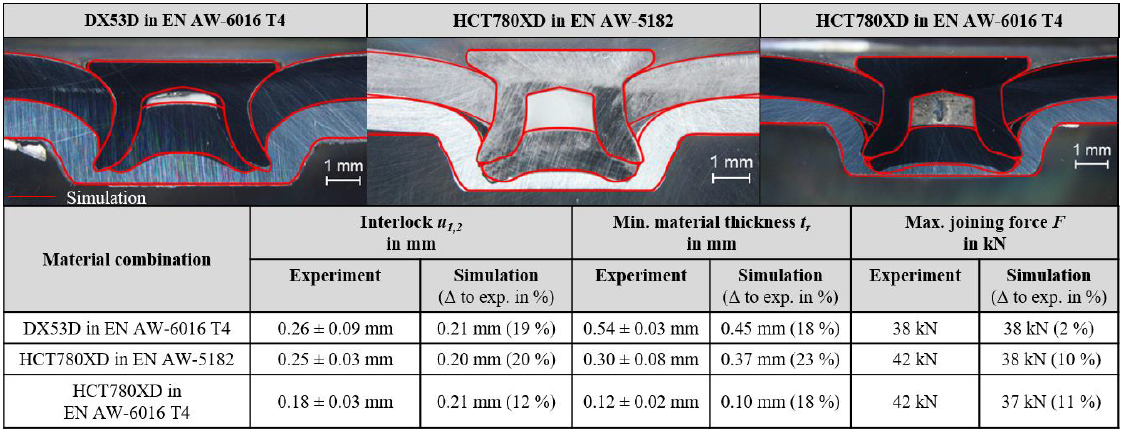 Fig. 4. Validation of the simulation models
In the numerical variation calculations, the material and process parameters were varied as described in Fig. 5. Due to the high number of possible parameter variations, a partial factorial design of simulations according to the optimized latin hypercube sampling method was generated. All the required material and geometry data were integrated into the Simufact Joining Optimizer, which is a special tool for the atomization of mechanical joining simulations inside the Simufact Joining software allowing the multitude of simulations to be built up, carried out and evaluated automatically. In total, process data for 2376 SPR joints could be generated by this methodology, which from a technological point of view also meet the requirements of a proper joint formation. [11]
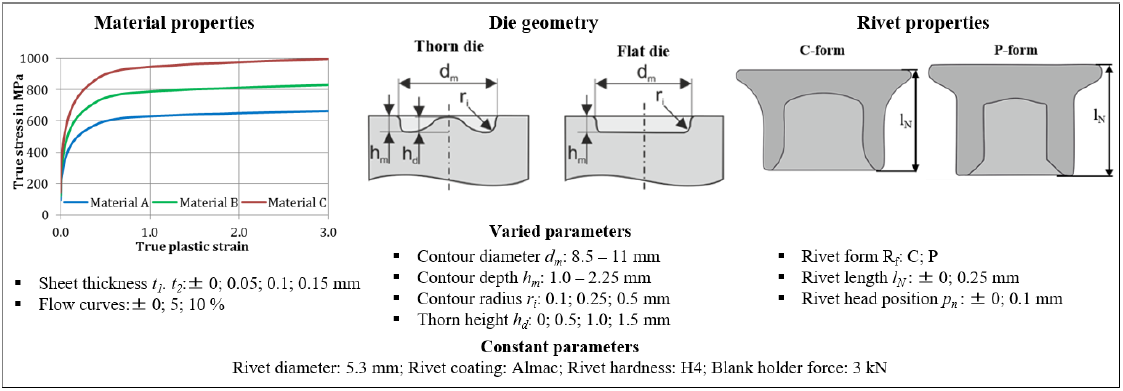 Fig. 5. Variation of material properties and process parameters in the numerical variation study
3 Data-based process models for SPR
3.1 Sensitivity analysis
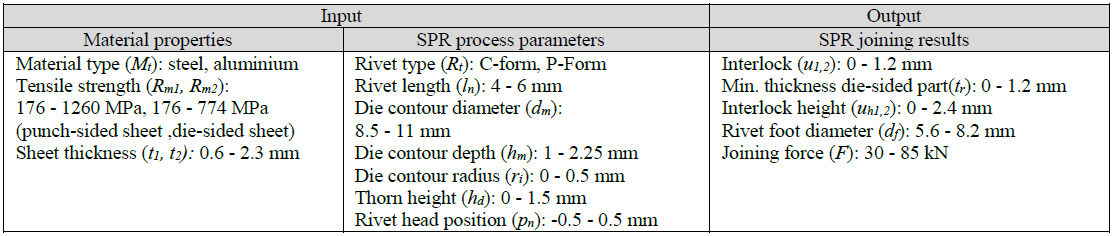
The aim of the sensitivity analysis is to quantitatively determine the influence of the input on the output variables. In the case described here, the influence of material properties and process parameters on the joining result parameters within the range shown in table 2 is considered.
Table 2. In- and output parameters for the data-analysis of the SPR process
The statistical analyses described here were carried out using the software platform Optislang. Thereby various approximation approaches (polynomial functions with different orders, moving least squares methods, Kriging approximation with isotropic kernel) are examined and compared in terms of their quality with the help of the coefficient of prognosis (CoP). The quality of the models, which input parameters have influence on the output parameter, is measured by the CoP. [14]

The numerator SSEPrediction in equation (1) is the sum of squared prediction errors, the denominator SST is equivalent to the total variation of the output parameter [14]. Thereby a high percentage means a good model prognosis. For all following results the isotropic kriging approach [15] delivers best approximations for the given dataset with 2376 numerically joined SPR joints.
The results for the numerical sensitivity analysis for SPR with the considered material properties and process parameters is shown in Fig. 6. Thereby for the important result values interlock, min. material thickness of the die-sided part and joining force, the most influential input values are listed from left to right sortet by their influence on the result value. Additionally the CoP for each model is shown. Since the CoP of all models is at least 90 %, all models can be considered valid for the respective assessment.
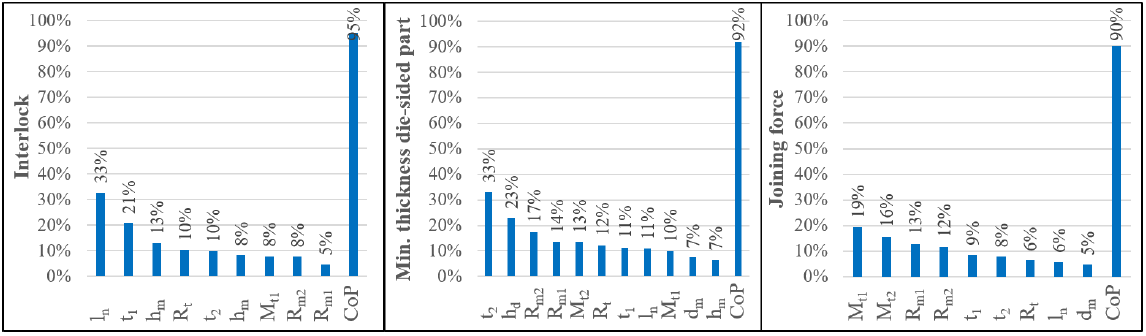 Fig. 6. Results of the sensitivity analysis
With regard to the interlock, the rivet length, the punch-sided sheet thickness and the die depth are the determining influencing parameters. The min. material thickness of the die-sided sheet is strongly influenced by the strength and thickness of the die-sided sheet and the thorn geometry of the die. Meanwhile, the joining force depends mainly on the properties of the sheets. These backgrounds are very helpful in determining suitable process parameters for the SPR process.
3.2 Individual process models
By using the generated material and process data for individual meta-modeling, it is possible to derive very good correlations from adjustable process parameters and joining results. When specifying the SPR process, besides the rivet properties, the die geometry is mainly used to adapt the process conditions to the properties of the materials to be joined. Fig. 7 therefore shows the response surfaces and contour plots determined from the regression analysis of the data for the joining results interlock, min. thickness of the die-sided part and joining force as a function of the die geometry. All models have a CoP of at least 90 %, which is sufficient quality for reliable statements. The correlations shown are valid for the described boundary conditions with regard to the materials and the remaining process parameters.
As already shown in Fig. 6, the interlock has a significant dependence on the depth of the die contour hm. With the boundary conditions shown, an interlock of the rivet in the die-side sheet can only be achieved with depths of above 1.2 mm and increases further with the use of deeper contours. The simultaneous use of a die diameter of dm = 9 mm additionally favours the interlock formation. When considering the minimum material thickness individually, it becomes clear that the optimum die geometry for this boundary condition is a depth of hm = 1.4 mm and a diameter of dm = 9.0 mm. However, the minimum value of the min. material thickness of 0.1 mm for this case can be achieved with a variety of other die geometries. It is understandable that the joining force in the SPR process depends significantly on the volume of the die contour. With reduced volume, the joining force increases significantly. However, with the considered rivet, no joining force above of 70 kN should be used, as otherwise unwanted deformation or damage to the rivet may occur. This process-related background knowledge is elementary in the interpretation of these data-based process models.
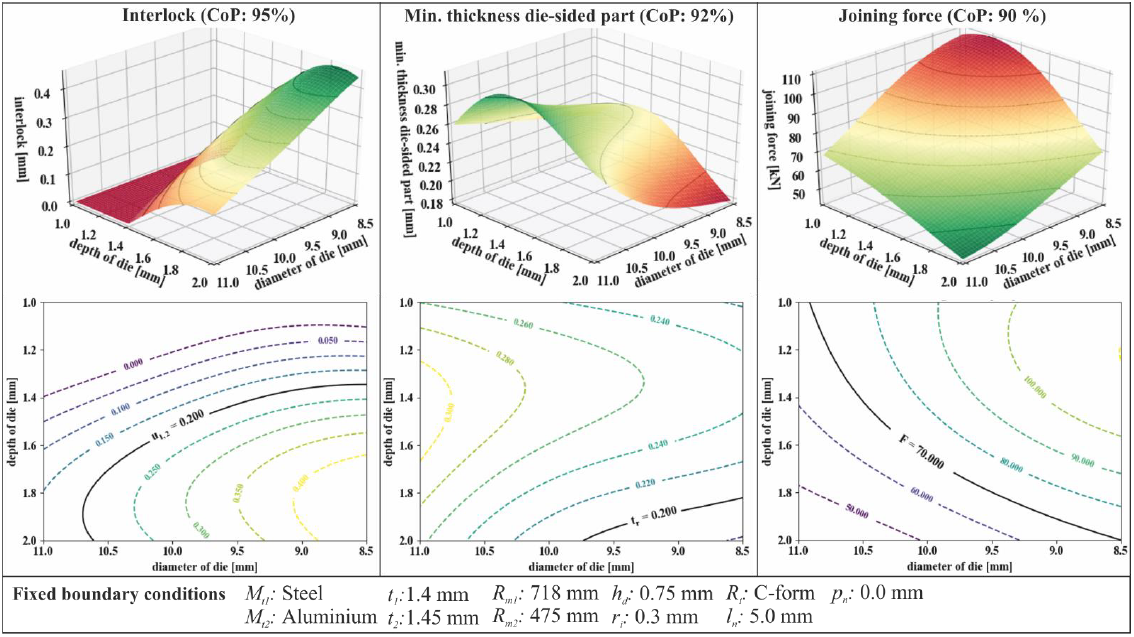
Fig. 7. Response surface and contour plots for interlock, min. thickness of the die-sided part and joining force in regard to die geometry
3.3 Process window models
The single consideration of individual joining result parameters is helpful for the design of the SPR process, but it is not sufficient to use the process in production. In order to use the process successfully in industrial production, all relevant parameters with corresponding tolerances for robustness must be fulfilled (Fig. 2, right). Therefore, within the scope of the investigations described here, process window models were developed which allow a fused indication of the joining result variables in relation to the process parameters. This allows a simple representation of the process window resulting from the respective boundary conditions for a proper SPR process.
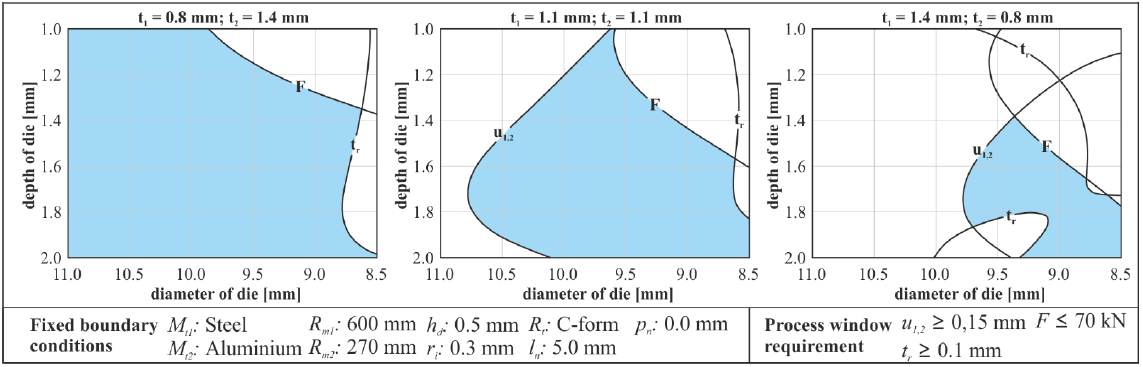 Fig. 8. Assembled contour plot with area of suitable tool dimension – variation of sheet thickness
Fig. 8 shows the resulting process windows for the SPR process of different sheet thickness combinations. In general, the joining direction "thin in thick" is suggested for the SPR process with regard to the sheet thicknesses [1]. The data and models determined here reflect this in Fig. 8. It can be seen that for the sheet thickness combination t1 = 0.8 mm in t2 = 1.4 mm there is a considerably larger process window for a proper joint formation than for the reversed sheet thickness combination.
Fig. 9 shows the process windows for different strength combinations of the sheets. The general recommendation for SPR suggests the joining direction "hard in soft". This trend is also confirmed by the models in this example. The process window models show that, on the one hand, the interlock decreases and, above all, the joining force increases significantly when the strength of the die-side sheet increases in relation to the punch-side sheet.
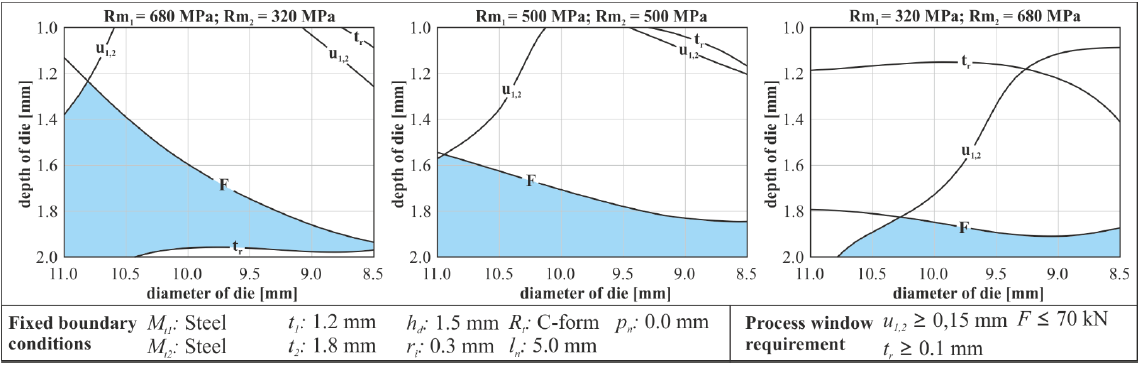 Fig. 9. Assembled contour plot with area of suitable tool dimension – variation of material
4 Summary
The results presented in this paper show the great potential of data-based process models for the proper design of industrial manufacturing processes. The methodology applied here of acquiring process data by means of validated and subsequently automated simulation models proves to be an efficient approach to generate the sufficient amount of data for building the data-based models. The developed models can help to quickly determine ideal and robust process parameters for complex manufacturing processes such as self-pierce riveting. However, the models cannot replace appropriate process know-how and serve more as a support for production operators.
Acknowledgements
The presented results are part of the research project "Data-based joining parameter prognosis at mechanical joining" of the European Research Association for Sheet Metal Working (EFB) funded by the program for "Industrial Research" (IGF) of the Federal Ministry of Economic Affairs and Energy and the AiF (19853 BR).
