1 Introduction
“Tailored welded blanks” (TWBs) is a term that mainly denotes raw materials welded together to form semi-finished parts destined for subsequent forming. With TWBs, the efficiency of fabrication becomes dramatically higher and the mechanical design can become more flexible. TWBs made from dissimilar metals, especially steel and aluminum, are thought to be more effective, and realization of such dissimilar metal TWB techniques has been pursued for a long time. There are mainly three obstacles in the development of steel/aluminum TWBs: difficulty in welding, unknown but generally low formability, and low corrosion resistance due to galvanic corrosion.
In recent years, the first problem, that is, difficulty in welding, is being solved through development of friction stir welding and laser welding. Regarding friction stir welding, welding of steel and Japan Industrial Standard (JIS) 1000 series, 5000 series [1], and 6000 series [2] aluminum alloys has been reported, and joint strengths over 95 % of the base aluminum alloys were obtained. In contrast, not many studies of laser butt welding of steel and aluminum alloy have been reported. Representative of such research is combined laser welding-brazing by Kreimeyer et al. [3] and butt laser welding with compression by Iizuka et al. [4, 5]. Although the joint strength of steel/aluminum TWBs welded by laser welding have stayed at around 80 % of the base aluminum and aluminum alloy until now.
In these studies, deep drawing tests were also conducted, and limited drawing ratios from 1.7 to 1.9 have been obtained [1-4]. However, with these exceptions, there is still not enough research on formability, that is, the second problem of steel/aluminum TWBs. As with formability, galvanic corrosion properties, that is, the third problem of steel/aluminum TWBs, has not been studied well. To date, some immersion tests have been conducted with steel/aluminum TWBs welded by double-electrode gas metal arc brazing [6] and butt laser welding [7].
In this case, since friction welding involves solid-phase joining performed below the melting point of the materials. Kumar et al. [8] conducted experiments on friction welding of aluminum alloy and mild steel with a weld strength of 136 MPa was obtained. Kimura et al. conducted friction welding of 6063 aluminum alloy and SUS304 stainless steel with a joint efficiency of about 70 % was achieved without formation of flash [9]. It is thought that such strengths are not sufficient for bars or tubes to be used for metal forming as TWBs.
Nevertheless, results from combined-cycle corrosion tests for steel/aluminum TWBs have rarely been reported as yet. Especially on friction welding, material flows from the inside to the surface making burrs in the welding process. So, relative motion of two raw materials at the area becomes smaller, and there are some possibilities that some joining faults occur at the center of the interface. By observing fractured surfaces in both of steel side and aluminum alloy side, progression mechanism of galvanic corrosion would be clarified in some extent, including the effect of such a joining fault.
In this study, to obtain fundamental experimental data for the corrosion properties of steel/aluminum TWBs, dissimilar TWB tubes of S45C steel and 6000 series aluminum alloys were fabricated using friction welding, and combined-cycle corrosion tests were conducted. First, the effects of natural aging on welded TWB tubes during corrosion testing were studied. Then, in combined- cycle corrosion testing, variations in appearance and strength of welded joints were investigated with an increasing number of cycles. In addition, fracture surfaces obtained by tensile testing were observed using an optical microscope to investigate the mechanism of corrosion progression and of variation of joint strength.
2 Test materials and experimental method
2.1 Test materials and friction welding
As test materials, tubes made of steel (JIS S45C) and aluminum alloys (JIS A6061-T6 and JIS A6063-T6) were used. The outer diameter, inner diameter, and length of the tubes were 26 mm, 20 mm, and 50 mm respectively. The end face of tubes was machined flat with a lathe, and a general-purpose milling machine (SEV-B, ENSHU Ltd.) was used for friction welding.
The friction welding procedure is shown in Fig. 1. First, an aluminum alloy tube was mounted to the milling machine chuck, and then a steel tube was placed on a non-rotatable but parallel movable stage so the tubes were face to face. Then, the aluminum tube was rotated at a predetermined rotation speed of 3000 rpm, and the steel tube on the opposite side was fed toward the rotating tube Fig. 1(a). After the moving tube contacted the rotating tube, the friction process started Fig. 1(b). In general, although friction pressure was kept constant during a predetermined holding time, which is called the friction time, due to a lack of a friction pressure function in the milling machine used here, force was applied by pushing at a constant feed rate in this study. The pushing force and friction time were set to be 1.0 mm/min and 60 s, respectively. During the friction process, material near the contact interface was heated and softened. Thereby, as the moving tube was pushed into the rotating tube, this softened material was pushed out in a radial direction, forming flash (a bulge of excess material) at the weld Fig. 1(c). When the friction time was complete, the aluminum tube rotation was stopped, and an upset pressure was applied to the steel tube to bond the two tubes Fig. 1(d). Like the friction process, this upset process was controlled by the pushing force and upset time. In this study, the pushing force and upset time were set to be 1.2 mm and 1.0 s, respectively. These conditions for friction welding are summarized in Table 1.
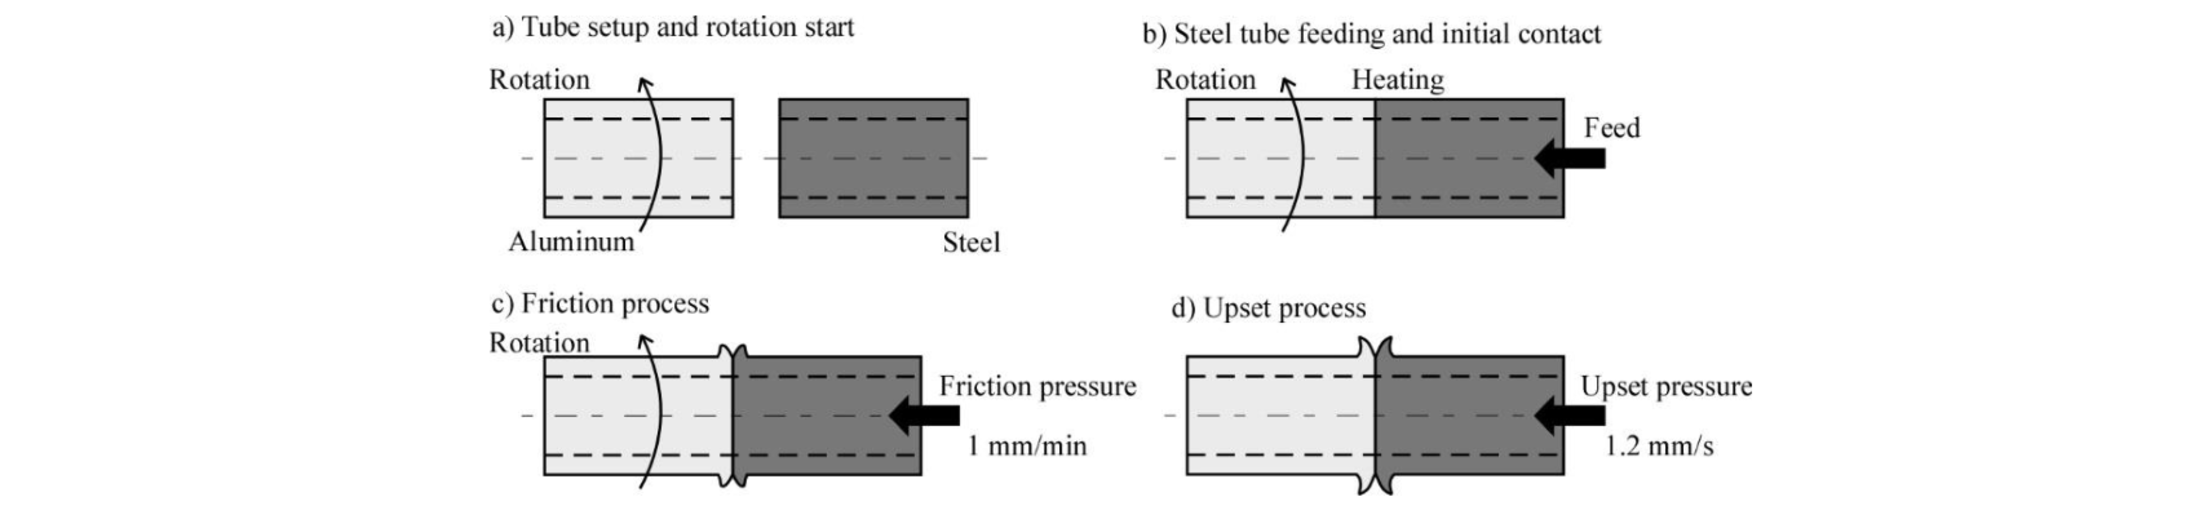
Fig. 1. Schematic illustration of friction welding of two tubes. a) Tube setup and rotation start, b) Steel tube feeding and initial contact, c) Friction process, d) Upset process.
Table 1. Conditions of friction welding.

After joining, the flash was removed using a lathe and the tubes were cut into six pieces with the same width by wire EDM, as shown in Fig. 2, to be used as test pieces.

Fig. 2. Cutting a tube into specimens.
2.2 Natural aging test
Before performing the combined-cycle corrosion test, the change in joint strength by natural aging for 9 days (540 hours) was investigated to confirm the effect of natural aging on the combined-cycle corrosion test. Test pieces obtained from welded tubes were placed in a desiccator maintained at room temperature (about 20 °C) and humidity of about 0 to 10 %. One test piece was taken out every 1.5 hours up to 6 hours after joining. Between 6 and 12 hours after joining, test pieces were taken out every 3 hours, and every 12 hours after 12 hours. Finally, after 4 days (96 hours), test pieces were taken out every 3 days. Test pieces removed from the desiccator were used to measure joint strength.
2.3 Combined-cycle corrosion test
In this study, to investigate variation of joint strength of steel/aluminum alloy TWB tubes with simulated outdoor usage, we conducted combined-cycle corrosion testing, which is a kind of accelerated corrosion test. In this test, dry and wet conditions are alternated. The combined-cycle corrosion test was performed under the conditions specified in Japanese Automotive Standards Organization (JASO) M609 and JASO M610. The test conditions are shown in Table 2. Under these conditions, it has been confirmed that carbon steel (JIS SPCC) produces corrosion substances equivalent to 1 year of atmospheric exposure testing in three to six cycles. The combined-cycle corrosion tester (CYP-90A, Suga Test Instruments Co., Ltd.) shown in Fig. 3 was used for the testing. As shown in Fig. 4, specimens were placed so that the steel end (JIS S45C) was on the bottom, and specimens were tilted 20° so that the outside surface of the tube faced the spray side. Combined-cycle corrosion testing were conducted for up to 60 cycles (20 days, corresponding to about 10 years to 20 years). One test piece was removed from the combined-cycle corrosion tester every 9 to 12 cycles to be used for observation and tensile tests.

Table 2. Conditions for combined-cycle test (JASO M 609, M 610).

Fig. 3. Combined-cycle corrosion tester. (a) Wide view of corrosion tester, (b) Close-up of corrosion chamber,
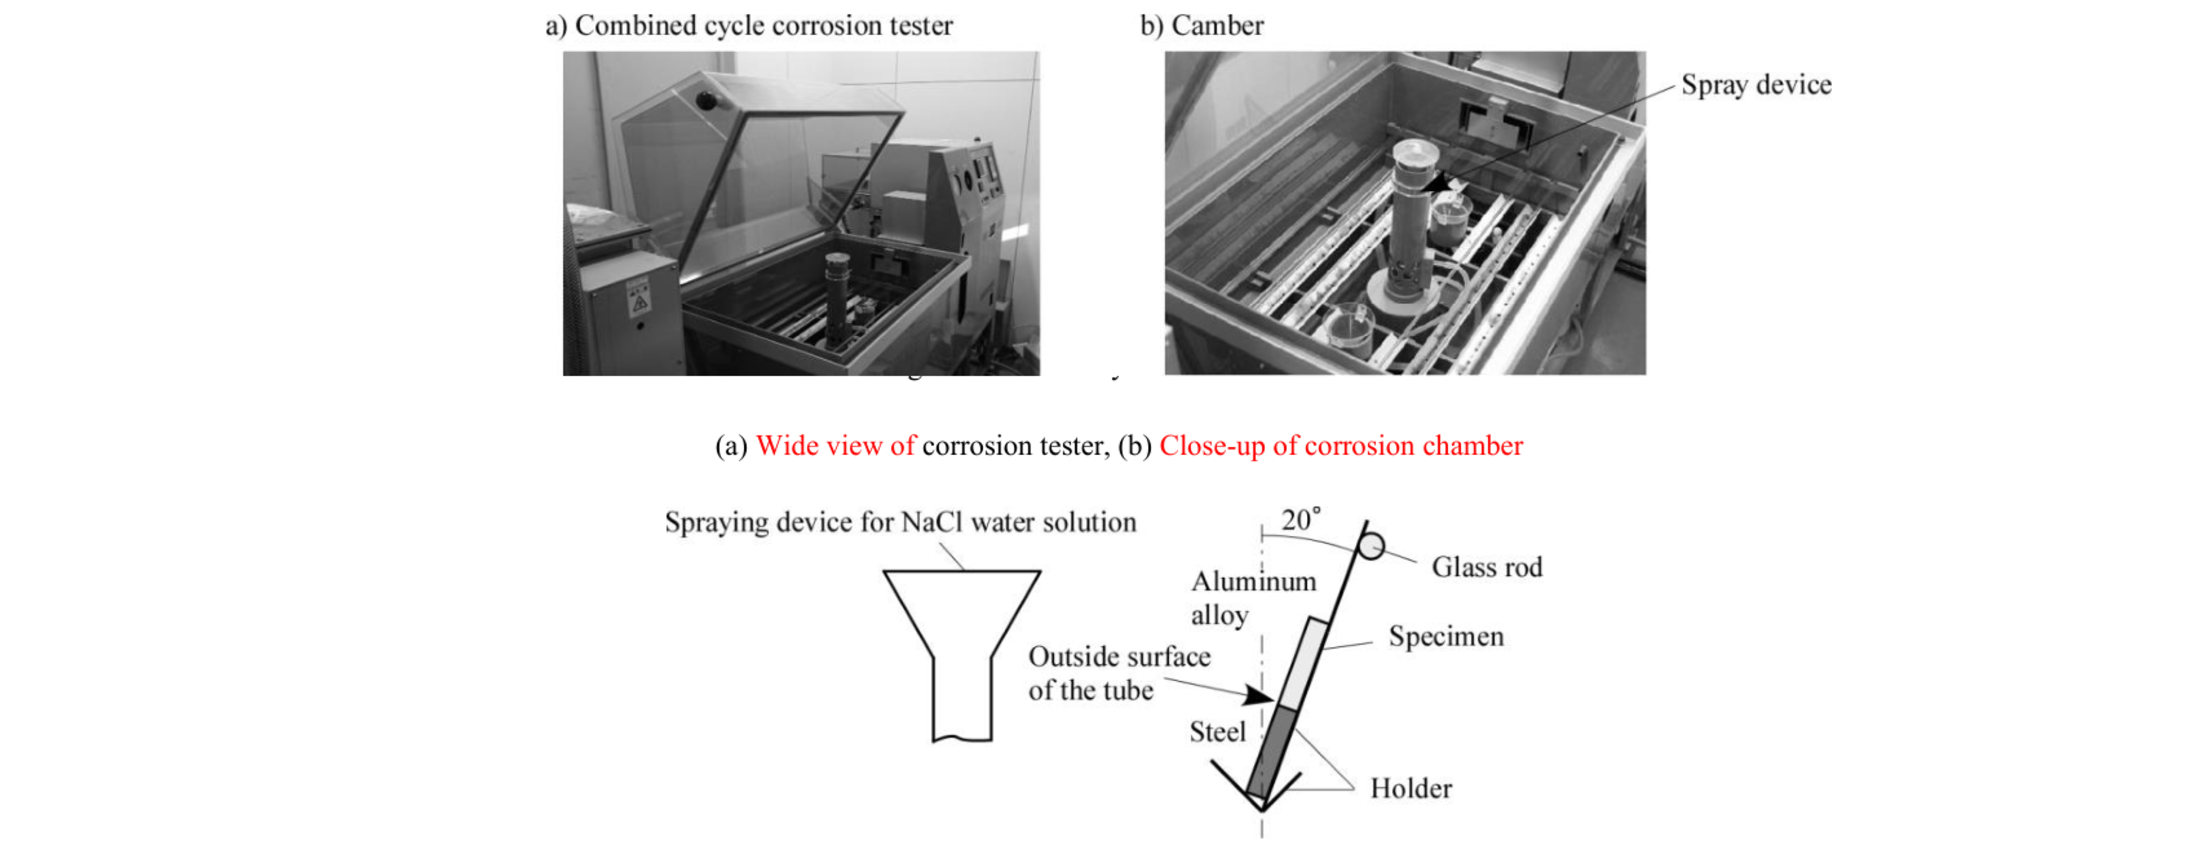
Fig. 4. Positioning of specimens in test chamber.
2.4 Tensile testing and observation of surface and crack fractures
After test pieces were removed from the combined-cycle corrosion tester, water on the specimens was wiped off with a rag, and the specimens were dried in air. Then, the specimens were photographed with a camera. Likewise, the appearance of the naturally aged test pieces was also photographed with a camera after they were removed from the desiccator. The outside surface of the welded tube was defined as the front surface, and the inside surface was defined as the back surface. After observing the appearance, tensile testing was performed.
The joint strength was evaluated with a tensile tester (Autograph AGS-J, Shimazu Corp.). The initial distance between chucks was 50 mm and the tensile speed was 3 mm/min. The tensile direction was perpendicular to the welded interface. The joint strength was evaluated using the load at fracture and the initial cross-section area.
Finally, fracture surfaces of test pieces were observed with a microscope.
3 Results and discussion
3.1 Variations in appearance and joint strength by natural aging
The appearances of welded test pieces placed in a desiccator for 12 hours and 384 hours after welding are compared in Fig. 5. In this figure, S45C/A6061 test pieces and S45C/6063 test pieces are also compared for both the outer and inner surfaces with respect to their original tube shape. Although some differences were observed, especially near the weld interface because different samples were compared, it can be confirmed that the appearance of the test pieces changed little after 15.5 days had passed. Fig. 6 shows variations in joint strength by natural aging 9 days after welding. In this figure, experimental results for both the S45C/A6061 joint (solid symbols) and S45C/A6063 joint (open symbols) are shown together. It was found that S45C/A6061 joints were stronger than S45C/A6063 joints. It is thought that this result does not directly mean that welding A6063 to steel is difficult, but merely that the welding conditions adopted here would be more suitable for A6061 welding. Review of the experimental results shows that, although there is some scatter in the joint strength data, S45C/A6061 joints had a strength of almost 150 MPa and the strength did not vary much after natural aging for 9 days. As for the S45C/A6063 welds, the joint strength was about 90 MPa and also did not vary after 9 days of aging.

Fig. 5. Appearance of welded joint test pieces placed in desiccator. (a) Appearance after 12 hours, (b) Appearance after 384 hours,

Fig. 6. Variations in joint strength by natural aging.
3.2 Results of combined-cycle corrosion tests
The appearances of test specimens subjected to combined-cycle corrosion testing are shown in Fig. 7. In Fig. 5, S45C/A6061 test pieces and S45C/A6063 test pieces are also compared for both the outer and inner surfaces from the original tube shape. In this case, as mentioned above, the surfaces that had been the outer side of the welded tubes correspond to the spray side in the combined- cycle corrosion test, and inner surfaces of welded tubes correspond to the holder side. From this figure it is seen that, as the number of cycles increased, corrosion products such as red iron oxide and white aluminum oxide already covered the entire surface of the spray side after only three cycles. As for the holder side surfaces, although almost no rust was observed on the test pieces after three cycles, red iron oxide and white aluminum oxide covered the entire surface after 12 cycles, matching the appearance of the spray side surfaces. In Fig. 7(c), it is seen that red iron oxide naturally peeled off from the steel surface and flowed down the aluminum alloy surface.
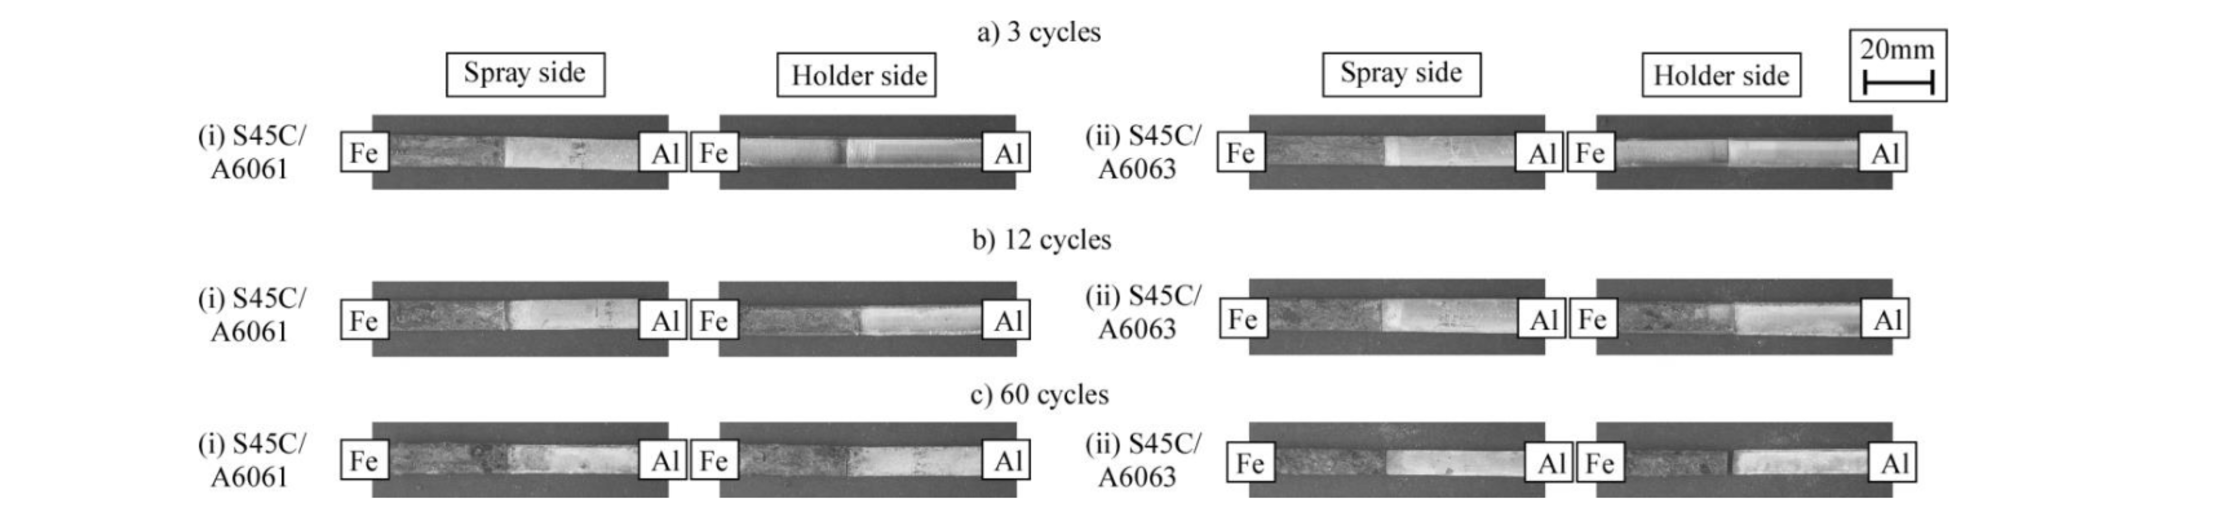
Fig. 7. Appearances of welded joint test pieces after combined-cycle corrosion test.(a) After 3 cycles, (b) After 12 cycles, (c) After 60 cycles.
Fig. 8 shows the variation of joint strength as the number of cycles increased in combined-cycle corrosion testing. As in Fig. 6, experimental results for both S45C/A6061 joint (solid symbols) and S45C/A6063 joint (open symbols) are shown together. From this figure, it is found that the strength of the S45C/A6061 joint retained its initial value, which was about 190 MPa, and was a little higher than that obtained in previous natural aging tests for about 30 cycles (corresponding to 5 to 10 years of atmospheric exposure). A clear decrease was observed after 30 cycles, and the joint strength dropped to about 110 MPa after 36 cycles (corresponding to 6 to 12 years). Finally, after about 50 cycles (corresponding to about 8 to 16 years), the joint strength fell to almost 0 MPa. As for the S45C/A6063 joint, its initial strength, which was about 90 MPa as obtained in natural aging test, was retained only until 12 cycles and decreased drastically to almost 0 MPa during the next 15 cycles (total of 27 cycles, corresponding to about 4.5 to 9 years of atmospheric exposure). The decrease rate of the joint strength was almost the same for the S45C/A6061 and S45C/A6063 joints, at about 8 MPa/cycles on average after the drastic strength decrease started.

Fig. 8. Variation of joint strength during combined-cycle corrosion test.

Fig. 9 Fracture surfaces of combined-cycle test specimens. (a) After 3 cycles, (b) After 12 cycles, (c) After 60 cycles.
Fig. 9 shows the fracture surfaces of corrosion test pieces observed using an optical microscope after tensile testing. In this figure, fracture surfaces of both the steel and aluminum ends are shown. The S45C/A6061 and S45C/A6063 joints are compared. Because it is generally considered that fracturing occurs in the aluminum near the interface or, if they exist, intermetallic compound layers at a welded interface, the fractured surfaces of strong joints would expose aluminum or intermetallic compounds on both the steel and aluminum sides. Thus, the white fractured surfaces seen in Fig. 9(a) indicate fracture on the aluminum alloy side. In contrast, oxides appear dark grey in a grey-scale image. Looking the figure more carefully, some oxides were seen near upper side (spray side) in all specimens. This indicates that corrosion had started progressing little by little from surfaces at this stage. As for the S45C/A6061 joint, the fracture surfaces shown in Fig. 9(b) were covered with a slightly grey color near the surface, which means corrosion progressed gradually from the surface. As for the S45C/A6063 joint, although the fracture surface looks brighter than the S45C/A6061 joint, especially in the center of the surface, such areas had a machined texture, indicating that the weld was poor. And, on the steel end, some oxide was seen in wide area near right and left edges and a little area of the center. This would indicate that these areas had been already separated by progress of corrosion, and that there were some joining faults existed in the center area. Such existence of faults would have made progress of corrosion faster. In Fig. 9(c), it is seen that the fracture surface of the S45C/A6061 joint had an entirely dark color, which means that red iron oxide permeated the whole interface. For the fracture surface of the S45C/A6063 joint, although some bright regions remained around the center of the fracture, it is also considered from the low joint strength that they would be areas that were poorly welded. From these results, it was found that corrosion progressed gradually from the surface into the weld interface, ultimately decreasing the joint strength. After 12 cycles (corresponding to about 2 to 4 years) of combined-cycle corrosion testing, however, the joint retained its initial strength to some extent, and corrosion progressed slowly. Finally, after about 50 cycles (corresponding to about 8 to 16 years), a thick oxide layer intruded into the whole interface and the joint consequently failed. This tendency would develop quicker when the actual weld area decreases. Therefore, it is considered that the S45C/A6063 joint lost strength more quickly.
4 Summary
In this study, steel and 6000 series aluminum alloys were joined by friction welding to conduct combined-cycle corrosion testing. JIS S45C and A6061-T6 and A6063-T6 were used as welding materials. Welded joints did not show clear natural aging strengthening after 9 days. Combined-cycle corrosion testing was conducted for up to 60 cycles, which corresponds to about 10 to 20 years of atmospheric exposure testing. The spray side surface of welded joints was covered with red iron oxide and white aluminum oxide after three cycles, and the holder side surface was also covered with oxides within 12 cycles. The strength of the S45C/A6061 joint was about 190 MPa, and this strength persisted over about 30 cycles. After that, the joint strength decreased radically and became 0 MPa at 50 cycles. The strength of the S45C/A6063 joint was lower than that of the S45C/A6061 joint, at about 90 MPa. It is thought that this difference in joint strength was mainly caused by the welding conditions not being optimal for A6063. The strength of the S45C/A6063 joint retained its initial value only for 12 cycles and decreased drastically to almost 0 MPa after 27 cycles. The decrease rate of joint strength was not very different between the S45C/A6061 and S45C/A6063 joints, and about 8 MPa/cycles on average after the drastic decrease started. From observation of the fracture surfaces, surfaces within interfaces that were not welded well started being covered with thin oxide layers gradually from the surface by the end of 12 cycles. When the entire interface surface was covered with a thick oxide layer, the joint strength became about 0 MPa.
Acknowledgements
This study was supported by the Japan Society for the Promotion of Science (JSPS), KAKENHI Grant-in-Aid for Scientific Research (C) Number JP20K05153.
