1 Introduction
Joining technology is decisive for the performance of an automobile body [1,2]. That is why a crucial part of the car body development process fluctuations is the consideration of the joining technology [3]. In recent years, car body development was driven by lightweight design [4] and product variety [3]. As a result of lightweight design, different materials have to be joined, which can be achieved by the use of mechanical joining such as clinching or riveting [1]. After the design process, the materials and the geometry of the components as well as the joining design are specified. The individual joining points characterize the joining design, by their technology and parameters, as well as their spatial arrangement [5]. In the subsequent production process, manufacturing inaccuracies as well as scattering in the properties of semi-finished products and sheets result in properties that deviate from the nominal design. This scattering is not taken into account in a nominal design [6]. However, the scattering in the properties of the sheet metal parts also influences the forces in joining points, even if the properties of them are identical. The question arises to what extent these deviations lead to different loads in the joining points and how this affects their potential design.
The location and the parameter, e.g. the undercut in a clinched connection, of a joining point depend on each other. Although there is much research on the design of joining points, the actual load of a point is only used indirectly, e.g. in topology optimization [3]. With the knowledge of how a joining point is loaded, an optimization of the joining point geometries and thus ultimately a load-optimized joining point design could be enabled [7]. For this purpose, quantities are required that describe the loading in a joining point. In this paper it is shown how joining force scattering induced by material deviations can be described with ellipses. For this reason, the values of the properties of the sheet metal parts of the underbody are described probability- dependent. Subsequently, two FE-model set ups for stiffness analyses are created. After performing a Monte Carlo analysis with each model, the scatter in the joining points is evaluated.
2 Method
This section begins with the introduction of quantities with which the joining force vector and its scattering can be described and evaluated using the normal force-shear force diagram. Then the model set up of a car body model with deviating sheet metal part properties in the underbody is described.
2.1 Quantities describing a joining force
A joining force F̲ can be represented vectorially. In the local coordinate system r, s, t the vector F̲ can be decomposed into the three share vectors F̲N, f̲s and f̲t as shown in Fig. 1 A. The r direction is perpendicular to the connected sheets. The s and t direction lie in the plane of the sheets. The shear force vector F̲S , which is the sum of f̲s and f̲t is also drawn. The absolute values of these vectors are calculated according to Table 1. With those values the load ratio LR (1) and the orientation angle β(4) can be calculated. β, LR, FN and FS are sufficient to describe a joining force without a vector representation.
The load ratio is a measure for the normal force share of the joining force and can be calculated according to (1). If LR equals zero, the joining point is loaded by shear only. In other cases, the sign of LR indicates whether the normal force component is a tensile force – then LR is positive - or a compressive force - then LR is negative. In Fig. 1 B the normal and shear force and the angle α is depicted. Equation (2) shows the α-LR relation [7].
The orientation angle β is the angle between the unit vector of the s-axis and the shear vector F̲S . It derives from the dot product which is stated in (3). The angle β indicates how the shear force share of the joining force is oriented. It takes a value of -/+ 180 ° and is calculated according to (4). In Fig. 1 C the orientation angle β is shown in the s,t-plane.
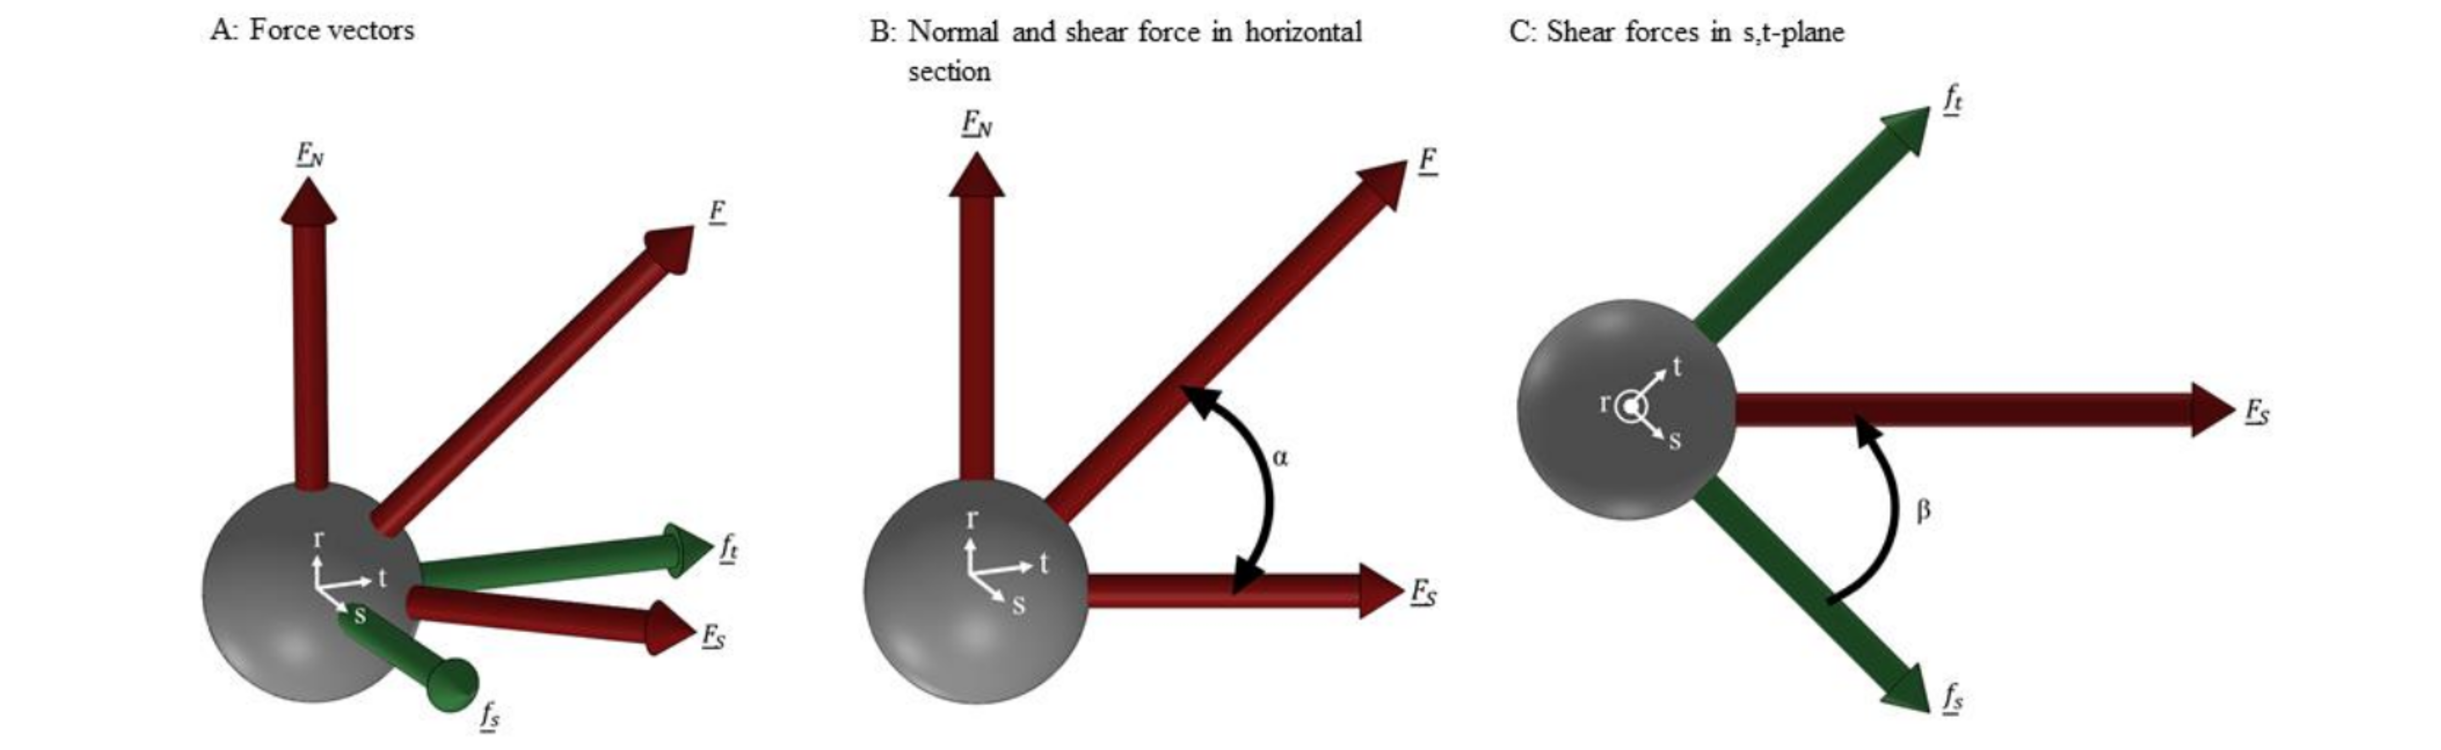
Fig. 1. Forces and quantities in a joining point.
Table 1. Vector representation and absolute value of the force vectors.

Load Ratio LR [7]:

α-LR-relation [7]:

Dot product of F̲S and unit vector of s-axis:

Orientation angle β:

2.2 Quantities describing the scatter of the joining force
If a joining force scatters all four sizes can vary. The change of the orientation angle β can be evaluated independently of the other quantities, by calculating the maximum, minimum and the percentiles.
A direct evaluation of the other three quantities, FN , FS and LR is not effective for evaluating the scattering, since the quantities are dependent on each other. Therefore the normal force-shear force diagram is used and further quantities are defined by the use of this diagram. In Fig. 2 A there is a normal force shear force-diagram for illustration purposes without axes values. Different force values in a joining point are represented by dots. The green boundary curve and the enclosed area is calculated by an implementation of the alpha shape algorithm [8,9].
The boundary curve is approximated with an ellipse (Fig. 2 B) to be able to perform a numerical evaluation. The ellipse is derived by a least square fitting algorithm as described in [10] and [11]. In the general equation of an ellipse in the shear force-normal force diagram (5) can be seen that the shape and the position of the ellipse is described with only four quantities. These are the center point CP (FS,center, 𝐹 𝑁,center), the semi-major axis a, the semi-minor axis b and the angle of rotation θ. In order to describe the shape of the ellipse with one value, the semi-minor is divided by the semi-major axis. This ratio will be called semi axes ratio SAR further and is calculated according to (6). SAR has a value between zero and one and with increasingly smaller value the ellipse is more elongated, as shown in Fig. 2 C.
General ellipse equation in the (FS, FN)-diagram with the semi-major axis a, the semi-minor axis b and the orientation angle θ (composed of rotation matrix and ellipse equation [12]):

Semi Axes Ratio SAR:

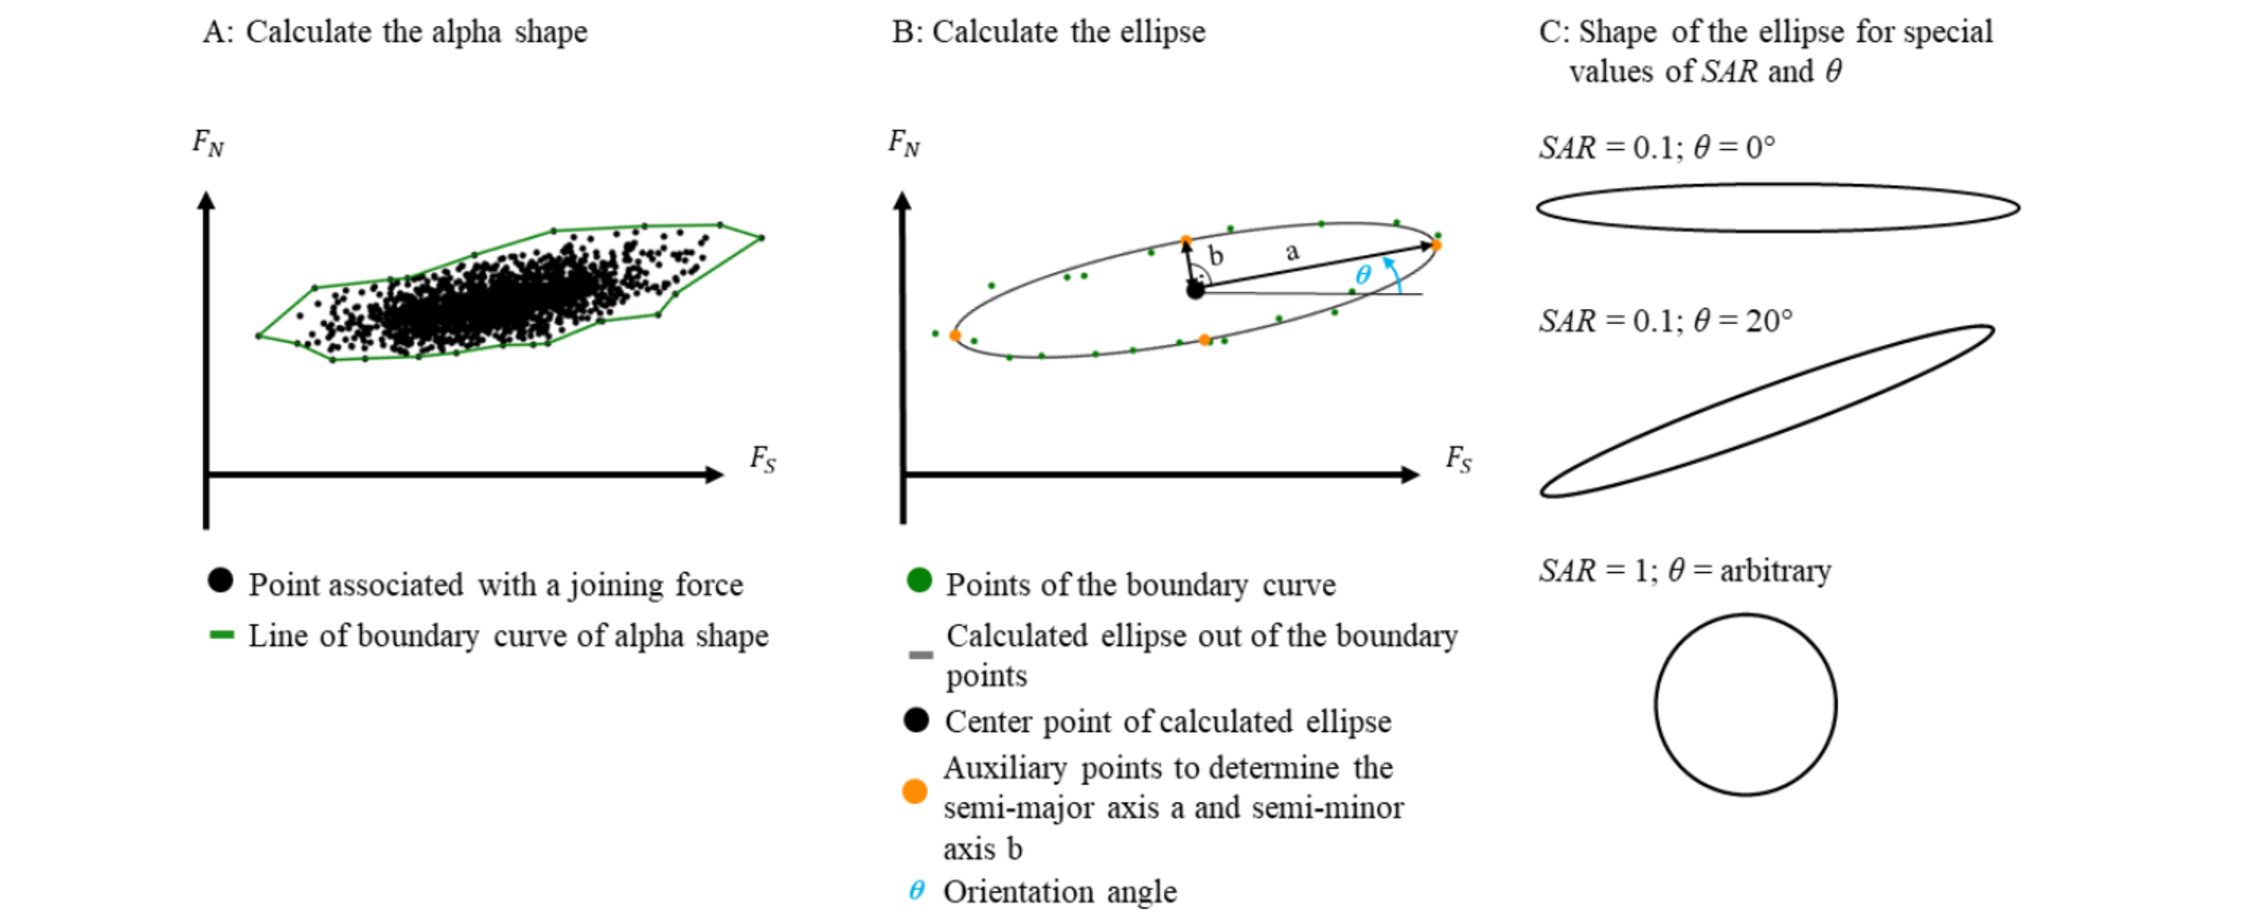
Fig. 2. Evaluation of scattering using the normal-shear-force-diagram.
For getting the frequencies of the forces, the area is divided into small bins and the number of points in each bin is counted. The distribution can be displayed in a 2D-histogram as shown in Fig. 3 A. With an assumed standard normal distribution, isolines of the probability function can be calculated and displayed as lines in the same diagram, as shown in Fig. 3 B. In Fig. 3 C three specific confidence lines are drawn directly in the histogram. These are also approximated with an ellipse, as shown in Fig. 3 D.
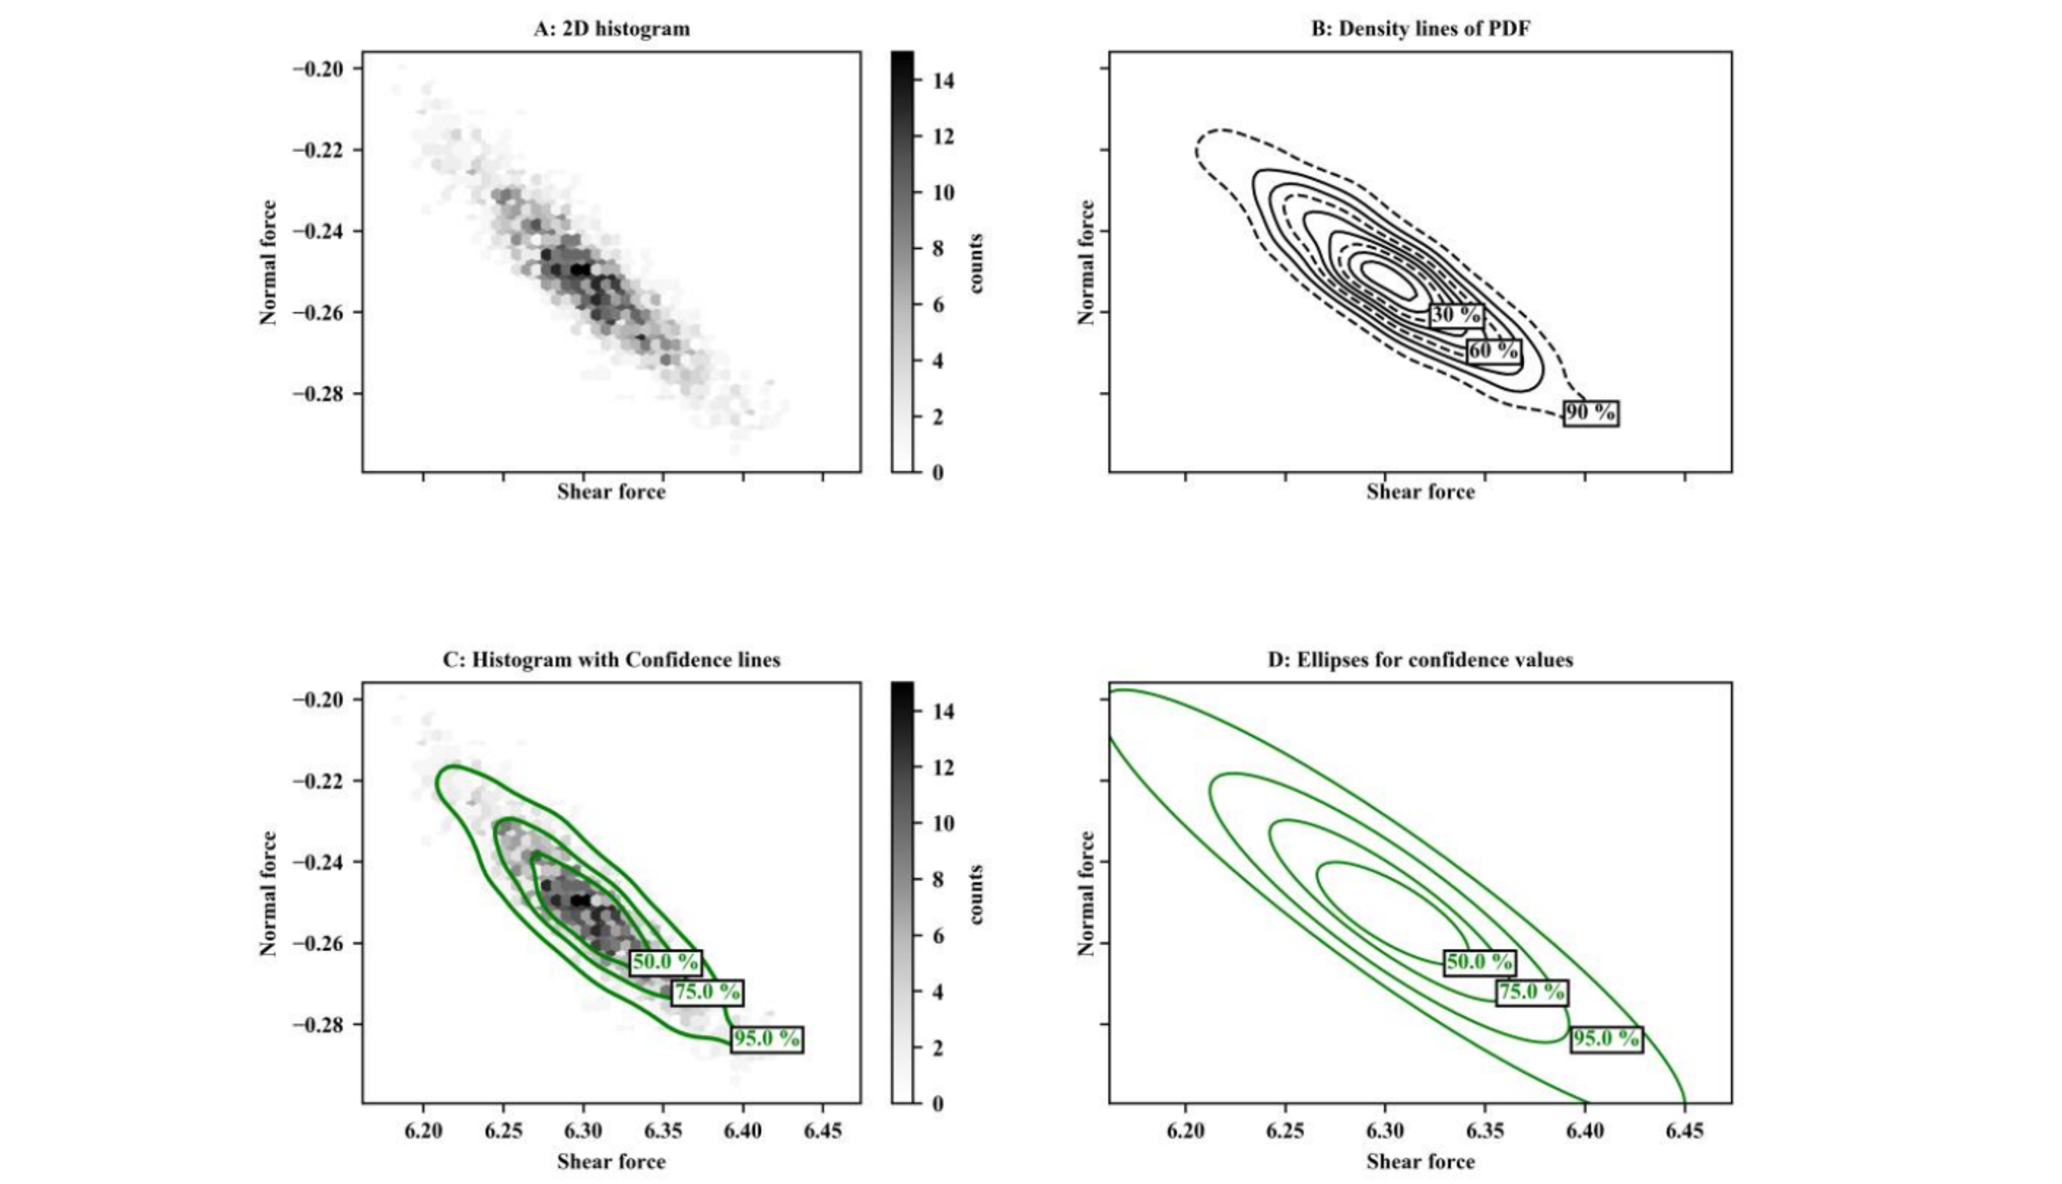
Fig. 3. In the normal force-shear force diagram, there is plotted: A: Histogram of the joining forces, B: Density lines, C: Histogram with confidence lines, D: Ellipses of the confidence lines.
2.3 Parameterized car body model
The method is applied to investigate the joining point scatter in the underbody of a steel car body. This assembly model is derived from the crash model of the Honda Accord 2011 [13]. In the derived model, it is assumed that all body components are made of steel and that all joining points have the same elastic stiffness. Since this research is in line with the author's research on clinch points, a clinch point model is assumed for the joining points. The advantage of using a car body is that it contains a large number of joining points and components, which together result in a complex geometry. The complexity of this assembly makes it possible to obtain versatile stress states in the clinch points from a real mechanical structure. In the model, Fig. 4, the sheet thickness and the stiffness of the components of the underbody are parameterized. The sheet thickness fluctuate in their tolerances range with a normal distribution around the mean value. The assigned standard deviations are listed in Table 3. The Young’s modulus fluctuates with a normal distribution with a standard deviation of 0.2 MPa. The joining points are modelled with a beam with mutually independent stiffness [14]. The stiffness values of the beam are shown in Table 2.

Table 2. Stiffness values of the beam representing the joining points.
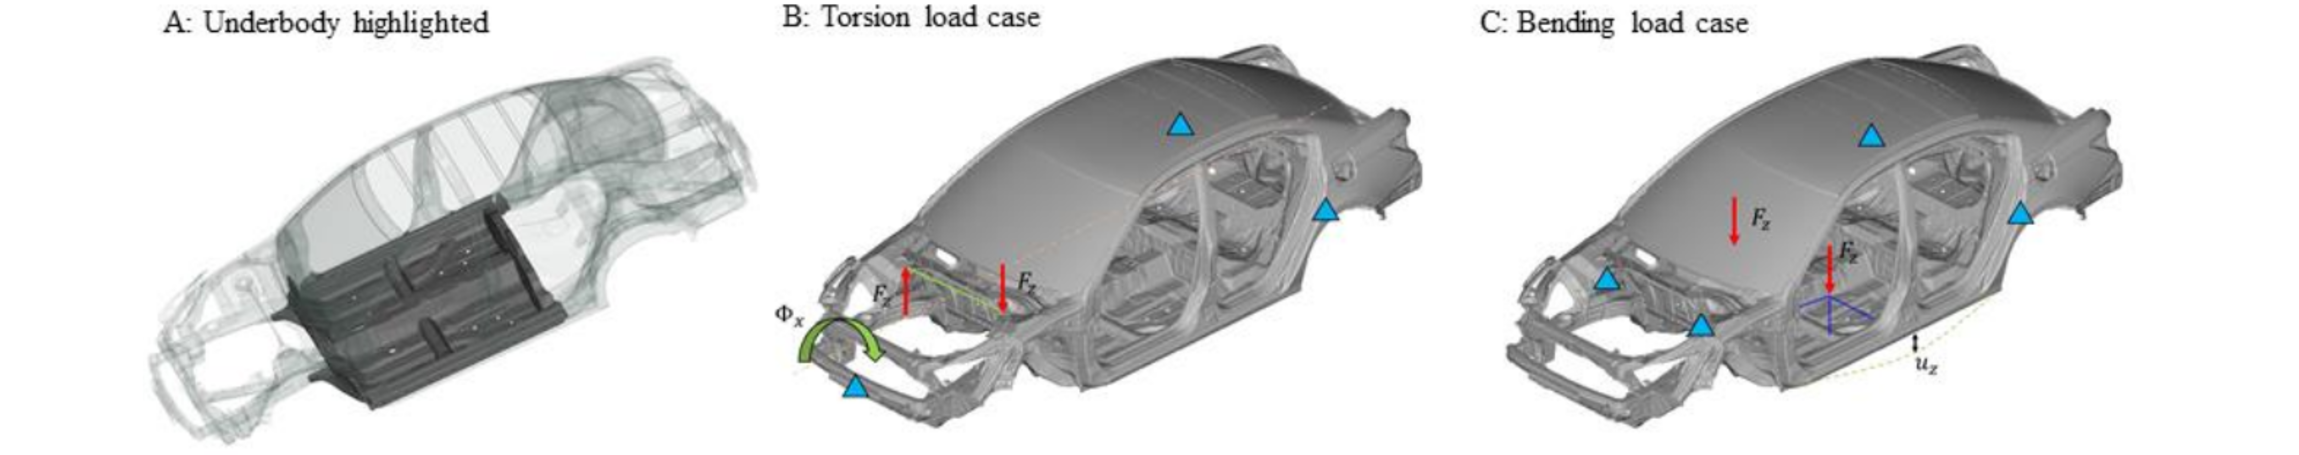
Fig. 4. Car body model with highlighted underbody and load cases.
Table 3. Standard deviations of the sheet thicknesses.
3 Results
In the underbody, there are 1276 joining points which get evaluated. First of all, it is investigated whether the scattering causes a significant change of the load ratio in the joining points. Therefore, the minimum, the maximum and the median values of LR of all joining points are plotted against the initial LR values in Fig. 5. The initial LR are calculated from the simulation with nominal sheet thicknesses. From these diagrams, it can be seen that the median coincides with the expected LR, which is the value of the simulation with the nominal properties and that the tolerance range is approximately symmetrical to the median. The deviation from the minima and maxima to the 45-degree line is very little, which means that the LR value scatters very little in most points.

Fig 5. Maximum and minimum load ratio against initial load ratio.
Since the change of the LR can result from a change in the shear or normal force, the joining point force changes are evaluated according to the method from Fig. 2. If the individual ellipses are generated and the center of the ellipse, the expected force and the median force value is plotted, the last two points almost coincidence. They are almost always slightly offset from the center of the ellipse on the main axis.
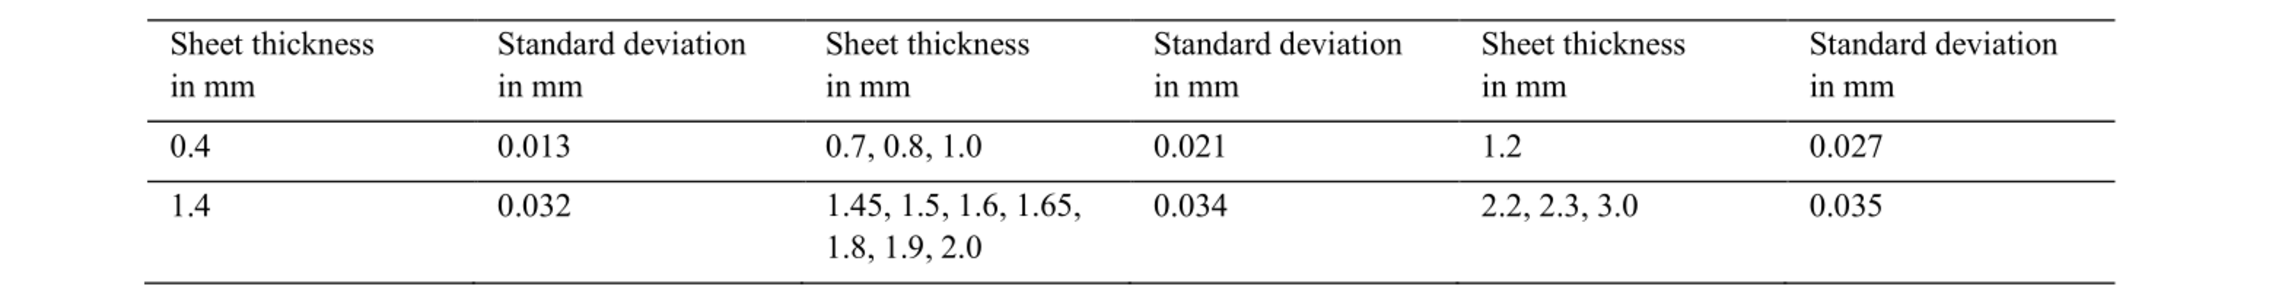
By plotting the frequencies of the SAR values in a histogram, there are many ellipses with a SAR smaller than 0.2 – the scattering of the shear force is at minimum 5 times higher than scattering of the normal force - as shown in Fig. 6. This means that for both load cases, the scattering of the forces in the force diagram lies in a strongly elongated ellipse for most of the joining points. The frequencies of the corresponding θ values of these ellipses are shown in Fig. 7 and scatter around zero degrees. Since θ describes the angle between the large ellipse axis and the horizontal axis, this means that the ellipses are almost parallel to the shear force axis. It can be concluded that the shear force scatters much more in the joining points than the normal force.
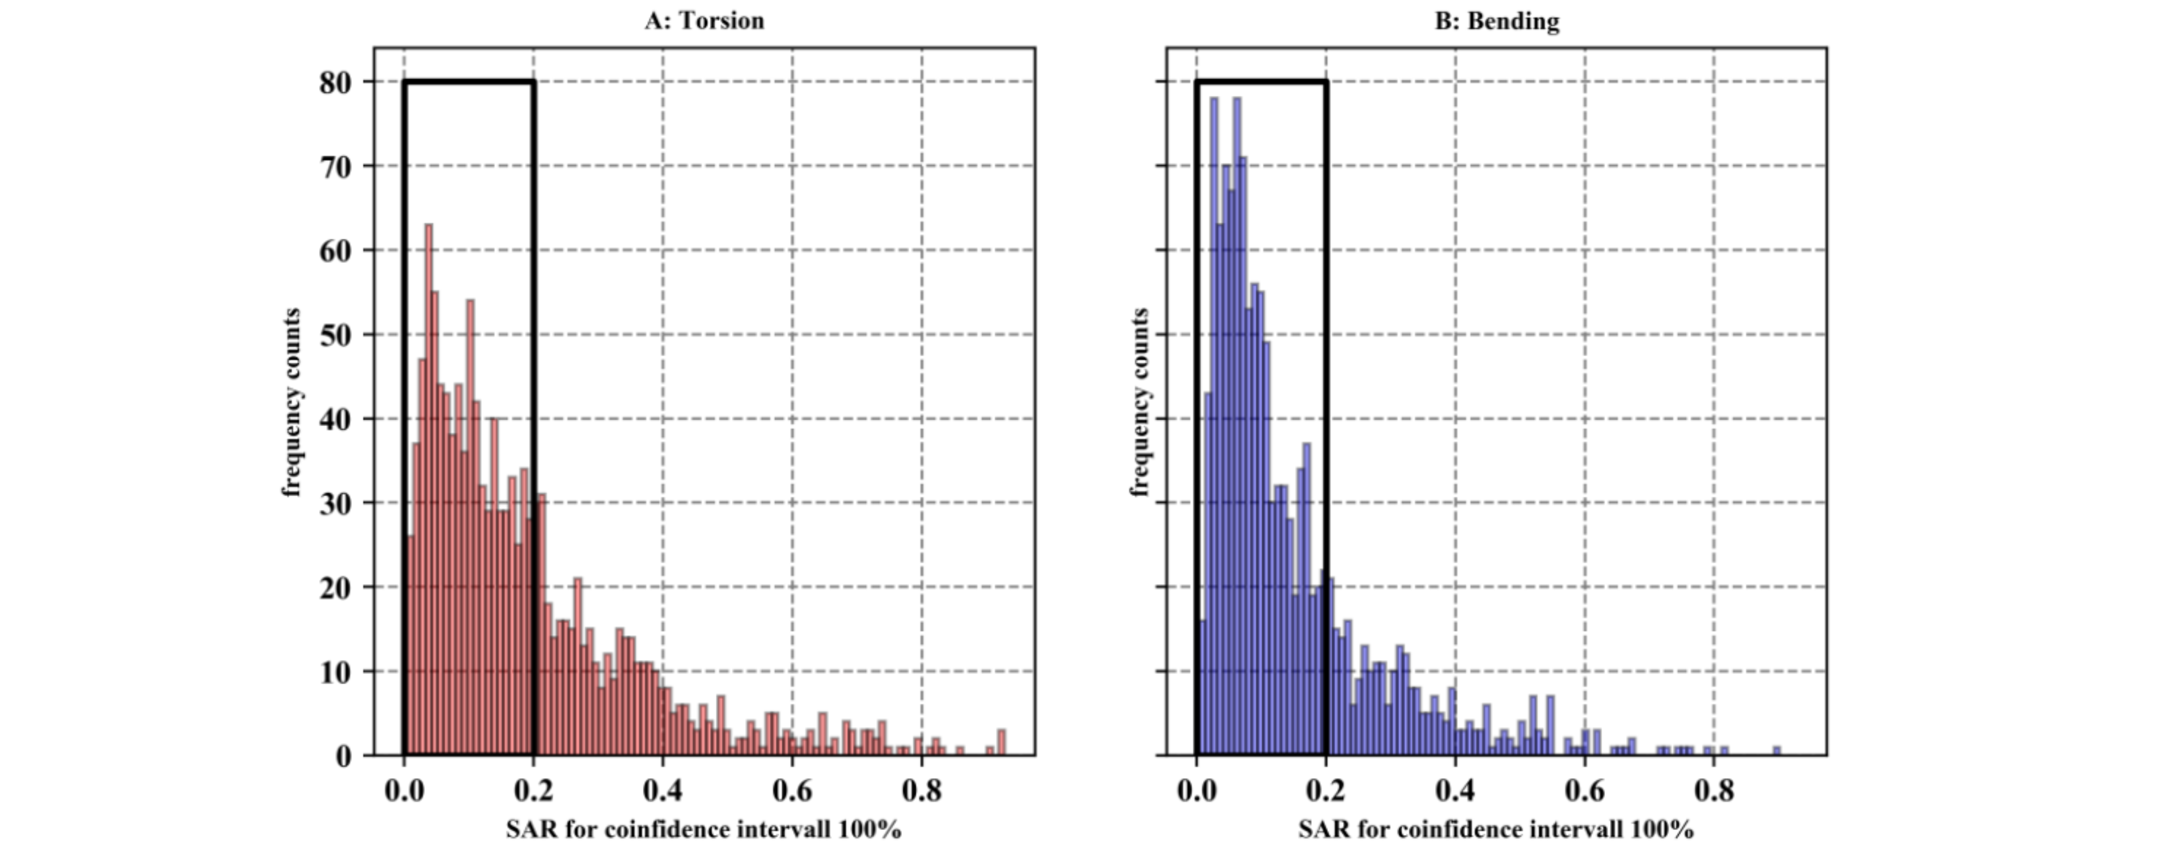
Fig. 6. Histograms of the semi axes ratio SAR of the calculated ellipses.
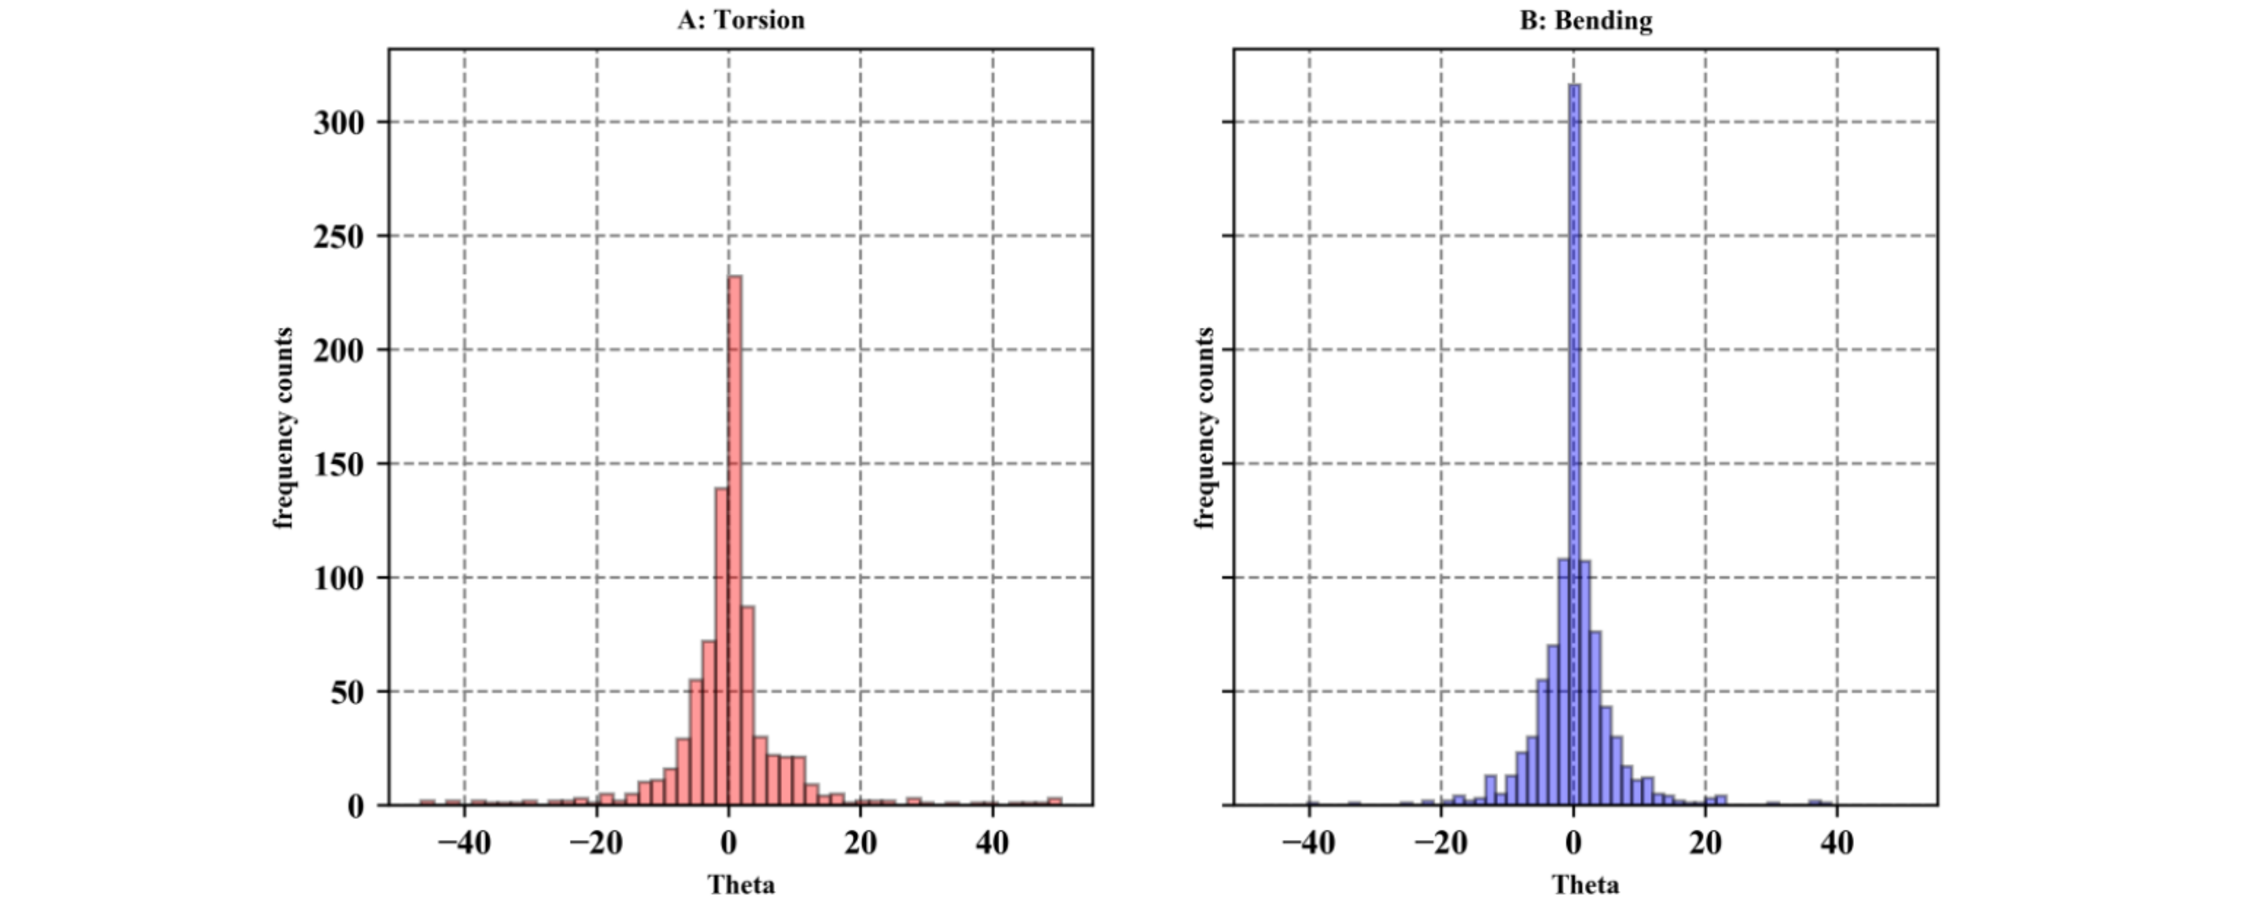
Fig. 7. Histograms of the theta values of the ellipses with a semi axes ratio less than or equal to 0.2.
4 Discussions
Finally, two questions are clarified. First, is the dominant change in shear force observed only when absolute quantities are considered, or is it also observed when relative changes are considered? Second, are the load ratio and the shape of the ellipses related?
To answer the first question, the ellipse axes of joining points with a SAR less or equal to 0.2 (same like in Fig. 6 and Fig. 7) are divided by the shear or respectively the expected normal force from the simulations with nominal thickness and stiffness. If the joining points are divided into the three groups, similar percentage change of shear and normal force (range +/- 30 %), significantly greater percentage change in shear force and significantly greater percentage change in normal force, the following result is obtained. In 45 % of the cases, the normal force change is more dominant, in 25 % the shear force change is determinant and in 17 % of the joining points the percentage change of normal and shear force is approximately equal. This means that approximately half of the joining points that have a significantly greater change in their shear force in absolute values, have a greater scatter in their normal force in relative terms.
For the second question, all joining points of the underbody are divided according to their nominal LR values (1) into only shear (LR between -0.1 and 0.1), tensile and shear load (LR greater than 0.1) and compression and shear load (LR less than -0.1) and again the histograms for the semi axes ratio SAR and the angle θ are created and plotted in Fig. 8. These histograms show that the joining forces with normal force shares scatter much less often only in the shear force. The histograms of this group show a significantly lower proportion of joining points with a small SAR value. At the same time, they show significantly higher frequencies with larger SAR values. When evaluating θ for the clinching points with a normal force share, the shape of the histograms is much wider and flatter as can be seen in Fig. 9 and there are less counts for θ equal 0. This means the dominance of the small θ angles is much lower than for the joining points which are exclusively loaded to shear. These observations mean that shear-dominated joining points to a large extent only scatter in their shear force due to the manufacturing tolerances. At the joining points which are loaded with a normal force component, a tendency to pure shear force scattering exists, but is less strongly.

Fig. 8. Histograms of the SAR values of all joining points of the underbody clustered by the load ratio LR.
Fig. 9. Histograms of the θ values of all joining points of the underbody clustered by the load ratio LR.
5 Conclusions
The joining point and their scatters show similar characteristics in both load cases. This is expected since the joining points of a car body are mainly loaded by the parallel movement of the overlapping surfaces in the flanges. Four observations are going to be discussed in the following:
-
Firstly, the median values of the joining forces coincident with the values obtained when calculating the car body with its nominal properties. This is due to the fact that a large number of simulations have been performed and all parameters have been varied symmetrically with a Gaussian distribution.
-
Secondly, in percentage terms, the normal force components scatter more than the shear forces, which can be explained by the fact that the bending stiffness of a sheet metal decreases more than the elongation stiffness with the reduction in the sheet thickness.
-
Thirdly, the absolute scatter of the shear force in the joining points is significantly greater than the scatter of the normal force. This results from the shear force domination in the joining points. Due to the load case and the position of the joining points in the overlap surfaces, those are loaded much more on shear than in normal direction.
-
Fourthly, the results show that the lower the shear dominance in a joining point, the more evenly the joining force scatters into both force shares.
The investigations show further that for linear load cases, joining point scatter can be described with ellipses in the force diagram. This has three decisive advantages. Firstly, it can be assumed that the load characteristics are preserved for linear loads. This means that with increasing load the ellipse is enlarged by a factor and shifted on a straight line. Secondly, the center, the semi axes ratio of the ellipse and the orientation angle are sufficient to describe an ellipse. Thirdly, these ellipses can be generated for any desired confidence interval and the scattering probability can be taken into account. In the next step, efforts will be made to superposition the fluctuation of the joining forces caused by different loads and investigations about the influence of the joining location.
Acknowledgements
The funding by the Deutsche Forschungsgemeinschaft (DFG, German Research Foundation) – TRR 285 – Project-ID 418701707, subproject B01 is gratefully acknowledged. Thanks are also due to the Paderborn Center for Parallel Computing (PC2) for funding this project with the computing time provided.
