1 Introduction
Numerical methods like the finite element method have great importance for car body development [1]. The results depend on the quality of the used material model, which describes forming and failure behavior. At high strain rates, structural elements behave differently compared to the case of quasi-static loadings. Material characteristics such as yield strength and elongation at fracture are affected by the loading speed. Even the start of instability and necking depends on the strain hardening coefficient and strain rate sensitivity. Therefore, the strain rate dependency of materials for strain rates up to 1,000 s-1 [2] and the failure behavior [3] has to be taken into account in crash simulations. For the detection of instability before failure, models like CrachFEM [1] or DIEM (Damage Initiation and Evolution Model) [4] can be used. They consider different failure modes and multi-axial states of stress. The current standard experiment for the investigation of strain rate dependency is the high-speed tensile test as described in a guideline of FAT (Forschungsvereinigung Automobiltechnik) [3]. Generally, multi-axial loadings are not considered. In sheet forming simulations, material failure at multi-axial loading is described by forming limit diagram (FLD). Some failure models use the FLD to describe the beginning of instability in crash simulation [5]. In certain cases the dynamic FLD is calculated by means of a tensile test but not verified by experimental data. Even in the FAT guideline [2], the need for characterization at multi-axial loadings and high speeds is pointed out. FLD can be used for the description of the material behavior at multi-axial loading. Usually, FLD is determined quasi-statically at 1.5 mm/s. Since the forming speed has a great influence [6], the usage of experimentally determined quasi-static FLD also at high strain rates (>100 s-1) leads to large uncertainties and thus can be hardly used in crash simulations. A possibility for the determination of FLD at high forming rates is the dynamic Nakajima test. The presented results of the high strength steel Usibor 1500 show the necessity of the determination of the dynamic FLD.
2 Material and Specimens
The tested material is an AlSi coated 22MnB5 (Usibor 1500). It was annealed for five minutes at 950 °C in an oven and quenched 30 s at 15 MPa in a flat tool. The chemical composition of the tested press hardened steel is pointed out in Table 1. The mechanical properties of the 1.5 mm high strength steel are listed in Table 2; all tests were done along the transverse rolling direction.
Table 1. Chemical composition of the press hardened steel in weight percentage.
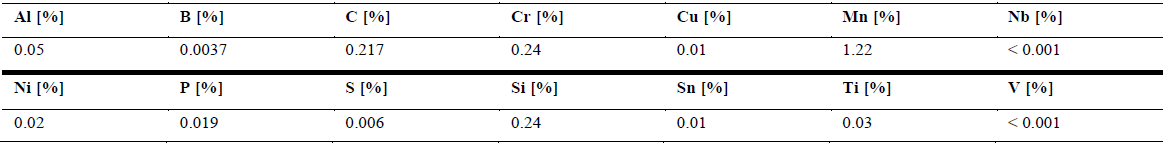
Table 2. Mechanical properties of the press hardened steel.

Some tensile tests with different quasi-static (0.00027 s-1 and 0.0027 s-1) and dynamic (160 s-1) strain rates were done for characterization of tensile properties. The different quasi-static and dynamic strain-rates were chosen in order to determine the strain hardening and strain rate sensitivity of the material. The stress-strain curves (a) and the yield curves (b) of these quasi-static and dynamic tensile tests are shown in Fig. 1. One can note that no obvious strain rate sensitivity can be found in the quasi static regime. However, an increase of strength of more than 200 MPa can be noted at the dynamic tensile test. The reason for this strain rate sensitivity can be seen in the hardness of 455 HV5 and in the microstructure which is presented in Fig. 2. It is not a fully martensitic microstructure and therefore the strain rate sensitivity can be noted, which could be proved by Bardelcik, too.[7]
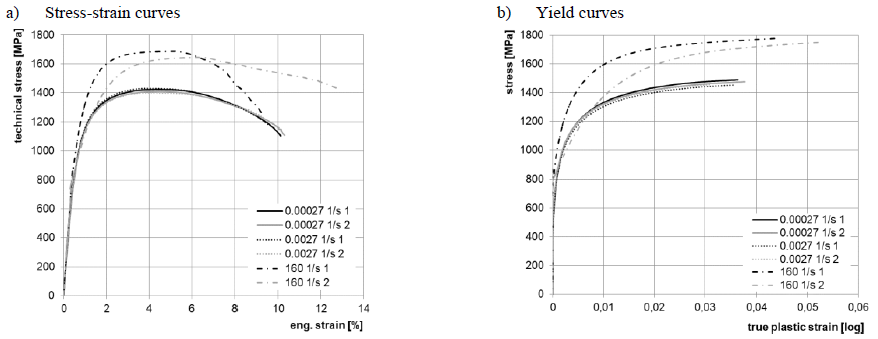 Fig. 1. (a) Stress-strain and (b) Yield curves of tested material at different quasi-static and dynamic strain rates along rolling direction
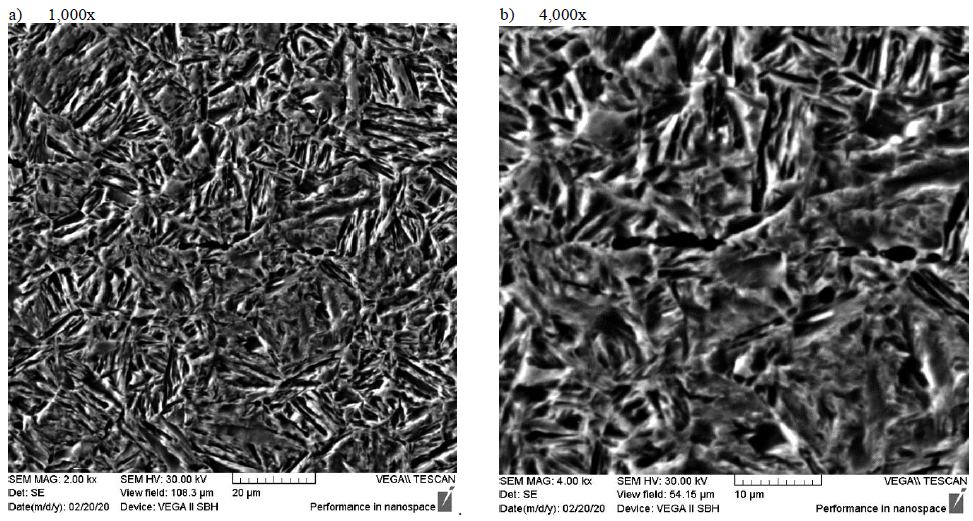 Fig. 2. Scanning electron microscope images of the martensitic microstructure of the tested presshardened Usibor 1500 a) 1,000x, b) 4,000x
3 Nakajima tests
According to ISO 12004-2, five different notched specimens are used for the determination of the forming limit curve (FLC) [8]. To ensure an even division between uniaxial and multi-axial strain states in the FLD, the sample width have to be chosen carefully. The examined specimens with their different geometry are presented in Fig. 3. Furthermore, the sprayed stochastic pattern is illustrated. It enables optical measuring and examination with cameras according to AM3 – “evaluation of situation directly before crack initiation” as pointed out in ISO 12004-2 [8]. The multilayer lubrication system provides a centered crack initiation at quasi-static and dynamic tests.
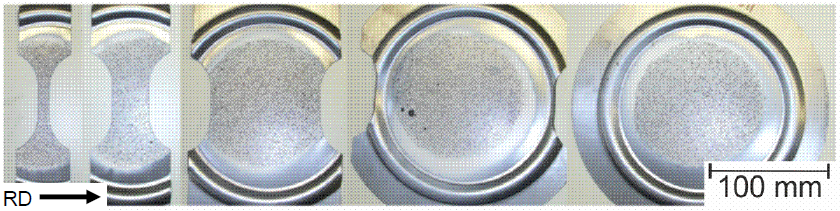 Fig. 3. Geometry of the tested Nakajima specimens.
The material is tested in the quasi-static and dynamic Nakajima tests. In Fig. 4 the test rigs for quasi-static (a) and high-speed nakajima tests are shown. The quasi-static FLD was determined in the quasi-static Nakajima test rig, which is presented in Figure 4 a). The presented quasi-static results were recorded with a measuring frequency of 15 Hz with a 5M-camera system of the “Gesellschaft für optische Messtechnik” (gom). Therefore, two cameras were installed above the test rig. The evaluation was made with the related Software Aramis. The changes in the greyscale pattern are evaluated with a correlation algorithm. The three-dimensional changes are transformed into major- and minor strains.
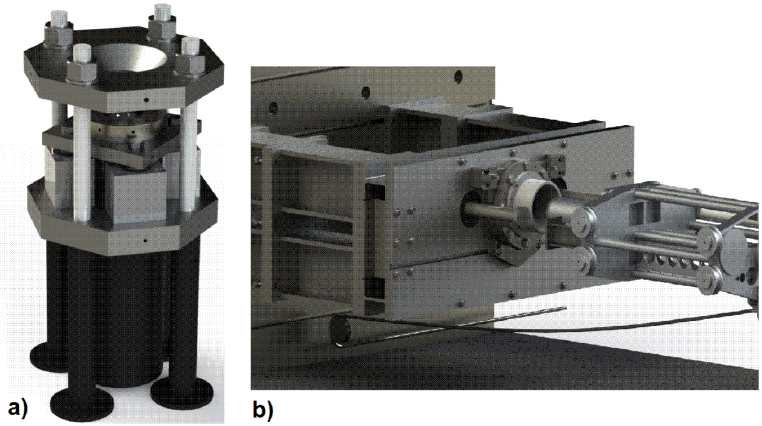 Fig.4. a) Quasi-static test rig for Nakajima tests b) Dynamic test rig for Nakajima tests at loading speeds until 20 m/s.
The dynamic Nakajima tests were performed in a slider-catapult. The slider and the clamping for the specimen are presented in Fig. 5 b). The test rig was developed for executing dynamic cupping tests at velocities up to 20 m/s. Therefore, a six meter long slideway is the basis. In its inside, the slider with the Nakajima-stamp is accelerated by a hydraulic system.
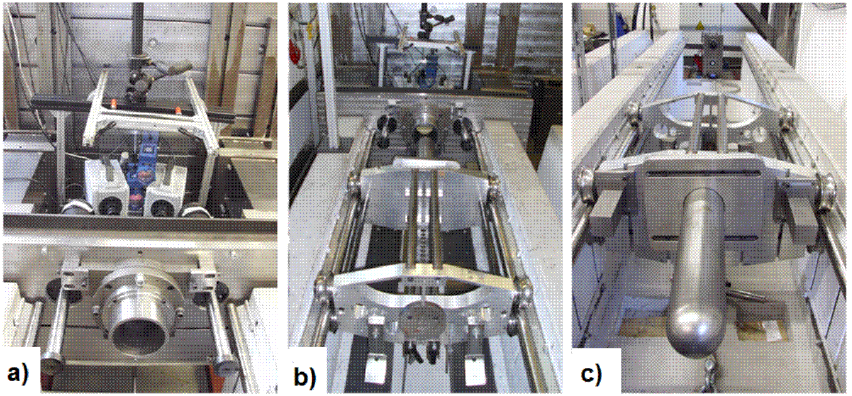 Fig. 5. a) Shock absorbers, blank holder, die and high-speed camera system for 3D recording at frequencies up to 100.000 Hz and evaluation with Aramis b) General view of the test setup c) Hydraulically driven catapult slider (up to 20 m/s) with Nakajima punch in a 6 m leading rail
At the end of the slideway, the slider strikes the test setup with the appropriate velocity. The specimen is clamped between the die and blank holder on the test setup and deformed until failure by the stamp striking on the specimen. Two shock absorbers are installed sidewards for damping the slider directly following.
As shown in Fig. 5 a), two high-speed cameras are mounted behind the test setup. They record the deformation of the specimen with frequencies of up to 100,000 Hz. Furthermore, the fixed blank holder and die and the two shock absorbers are visible. The catapult slider at the end of the leading rail is presented in Fig. 5 b). In the background, the test setup is visible, too. The holders for the steel cable are shown among the slider in the foreground. The acceleration of the hydraulic cylinder is transmitted to the slider by that steel cable. The catapult slider with the Nakajima punch with a diameter of 100 mm is shown in Fig. 5 c). The dynamic Nakajima tests were performed at a loading speed of 10 m/s. To determine the forming limits, each experiment is recorded by 3D high-speed camera system at a frequency of 10,000 Hz and is then evaluated with the software Aramis. The chosen multilayer lubrication system provides a centred crack initiation at quasi-static and dynamic tests.
4 Crach Model
One of the considered theoretical models for predicting FLC at high strain rates offers the numerical algorithm CRACH as part of the modular material and failure model MF GenYld+CrachFEM 4.2. The algorithm CRACH follows the basic ideas of Marciniak and Kuczynski [9] by using a geometrical imperfection in the sheet as a trigger. It is described by the parameter d. Its initial value is calibrated from one experimental limit strain in one tensile test. There exist two different ways of deriving the limit strain. On the one hand, it is possible to determine from the distribution of the major strain in the middle of the specimen at the onset of unstable necking. This method is henceforth referred to as internal limit strain and can be evaluated by the cross-section method which is used in the experimental tests of this study. On the other hand, the external limit strain can also be derived by measuring the thickness and width of the broken specimen at the border of the localized necking area. For deriving the input data for CRACH, this could be an advantage when no optical measurement in the experimental tests is available. These two types of limit strain could not only serve as different input data but also as two possibilities for prediction of FLC. However, in the case of CRACH, the imperfection has a smooth geometry as presented in Fig. 6. The inhomogeneity d leads to a reduction of the initial sheet thickness h0 and therefore to the initial sheet thickness inside the localized neck h ̃ as described by:

Furthermore, CRACH uses an orthotropic definition of the sheet plasticity via the input of Lankford parameters and an isotropic-kinematic hardening behavior for consideration of multistage deformation with nonlinear strain paths. For taking into account the strain rate dependency and strain hardening, a strain rate dependent hardening model is used. In this case, a combined Swift/Hocket-Sherby hardening model was used for approximation of quasi-static and dynamic yield curves. Through a comparison of hardening behavior for two strain rates in the quasi-static regime and in the dynamic regime, the quasi-static strain rate sensitivity and the dynamic strain rate sensitivity, which serve also as input for CRACH, are determined. All these input data can be derived from quasi-static and dynamic uniaxial tensile tests.
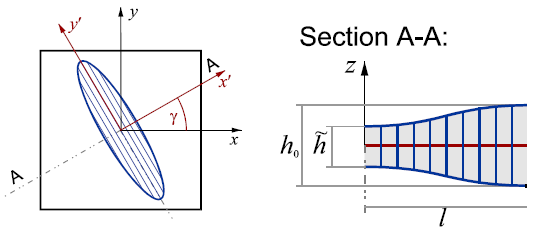 Fig. 6. Schematic description of initial imperfection leading to localized necking.
5 Modified maximum force criterion
Based on the flow curves and the r-values along different loading directions, it is clear that the investigated 22MnB5 does not show strong stress anisotropy, while a certain level of r-value anisotropy is not negligible. For this specific feature of the yield and flow behavior, the non-associated Hill48 anisotropy plasticity model, which has been successfully applied to previous studies [9; 10], is chosen as the yield criterion. In the model, the yield function is reduced to Mises plasticity due to the isotropic yield behavior, while the flow potential is calibrated based on the r-values obtained from tensile tests along different loading directions. The detailed equations and calibration procedure are referred to [11]. As discussed by Lian et al. [11], the anisotropic hardening and r-value evolution could have a significant impact on the forming limit behavior of steels. However, it is observed for the selected material, the flow curves from different loading directions have no obvious deviation during strain hardening. Therefore, the evolving feature of the plasticity model is not taken into account.
The MMFC proposed by Hora et al. [13] is employed in the current study as a localization criterion. This criterion is based on the well-known maximum force criterion, as shown in Eq. (2), initially developed by Considère indicating the onset of diffuse necking in a uniaxial tensile condition.

However, as further indicated by Hill [12], the onset of diffuse necking is an early indicator for more general and local instability, which is corresponding to the localized necking or localization. Localization develops in a diffused neck and during its development, it is evident that there is a clear stress state change, from a pre-defined linear stress path to a plane strain tension. The change of the stress state gives rise to additional plastic deformation and increases the formability. Based on this observation, Hora et al. [13] proposed the basic form of the MMFC. However, there is not only the change of the stress state in the diffused neck but also the change of the local strain rate. The increase of the local strain rate in the diffused neck can be significant even if the global deformation of the structure remains quasi-static. Therefore, Hora et al. [13] further extended the MMFC into a more general form based on the theory initially proposed by Ghosh [14]

where 𝜎11 and 𝜀11 are, respectively, the major principal stress and strain; 𝛽 is defined as the ratio between the major and minor principal strain rate, 𝛽≡𝜀̇22𝜀̇11⁄=const; and 𝜀̅̇ is the local equivalent strain rate. For strain rate sensitive materials, this additional term could have a non-negligible influence on the final forming limits.
In the current study, based on the plane stress condition, the general-form MMFC is combined with the non-associated Hill48 model. For detailed implementation procedure and corresponding equations, the readers are referred to Lian et al. [11] and Hora et al. [13].
6 Results and discussion
In Fig. 7 the results of the experimental quasi-static and dynamic Nakajima tests of the tested 22MnB5 are presented in an FLD. The forming limits are the results of the maximum interpolated bell-shaped curves. This “position-dependent cross-section method” for evaluation is the actually applied method according to DIN ISO 12004-2. In general, the poor forming limits of the press-hardened material are visible. The minimal major strain of 0.04 can be found in the case of quasi-static plane strain tension. The maximum major strain at the instability of 0.25 is observed in the case of dynamic biaxial stretching. Furthermore, higher forming limits at beginning instability can be noted for the press-hardened steel in the dynamic case, except the area between plane-strain and uniaxial tension, represented through the specimen with a 45 mm width. Here it seems as if the forming limits of the press-hardened steel are hardly influenced by the high forming velocity.
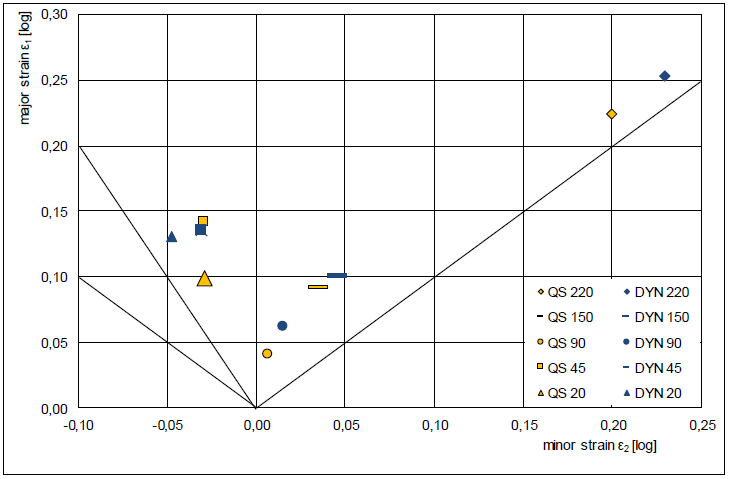 Fig. 7. Quasi-static and dynamic forming limits of 22MnB5, according to section fit method (ISO 12004).
When looking at the strain paths at the quasi-static and dynamic tests in Fig. 8 a very nonlinear strain path in the dynamic Nakajima test can be found for this specimen (45 mm width). In this case, the forming starts with biaxial stretching before it changes to uniaxial strain. A possible reason could be the loading speed and needs further investigations.
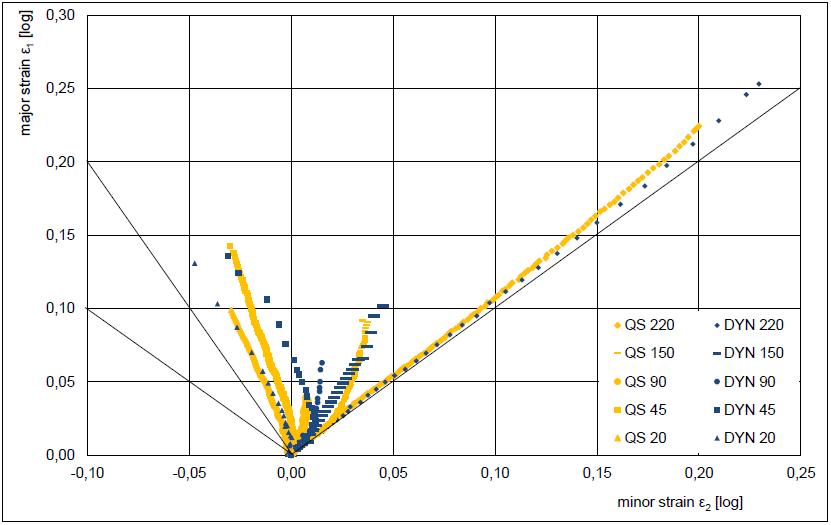 Fig. 8. Comparison of strain paths at quasi-static and dynamic Nakajima tests.
To sum up, higher forming limits can be reached in dynamic Nakajima tests. This tendency could be proved at dynamic Nakajima tests at uncoated 22MnB5 in [15]. Against the background of the increasing ultimate tensile strength and yield strength [7] of the press-hardened, isotropic steel, the material constricts later and therefore higher forming limits can be reached. In the quasi-static case, the forming concentrates very local at quasi-static loading. In contrast, the beginning necking gets supported by the strain rate hardening and therefore the increasing yield strength in the dynamic case. Cause of this, the local necking takes place at higher forming limits. But before the local necking, the adjacent area deforms and higher forming limits could be reached.
The predicted quasi-static and dynamic FLC by both the CRACH model and MMFC are presented in Fig. 9 together with the experimental data. For the CRACH prediction, the external limit strains, which correspond to the zone out of the severe localization zone, are plotted in Fig. 9(a). The quasi-static prediction gives a very good agreement to the experimental data, especially at the plane strain condition and on the right-hand side of the FLD. On the left-hand side, it underestimates the limiting strains, especially at the uniaxial tension stress state. For the dynamic condition, the prediction is higher than the quasi-static case on the left-hand side of the FLD and a lower trend is found towards the equibiaxial tension. Therefore, the prediction for uniaxial tension is slightly improved, although an underestimation still exists. For the biaxial tension side, the prediction is somewhat lower than the experiments.
The prediction by MMFC combined with the non-associated Hill48 model is shown in Fig. 9(b). As the flow curves for the material along the rolling direction, diagonal direction, and transverse direction are in general similar. Therefore, isotropic yielding and hardening are assumed. However, the r-values for different loading directions are all not zero and they are taken into the calculation by using the non-associated Hill48 model. For the quasi-static case, the prediction also shows an overall very good agreement for all the investigated stress states. For the uniaxial tension region, due to the inconsistency in the experimental data, it fails to capture the forming limits by the specimen with a sample width of 20 mm, while gives an excellent prediction for the geometry with a 45 mm sample width. More experimental data in the region with slightly different geometries are needed to validate the model prediction.
For the dynamic case, the MMFC prediction shows an overall increase of the forming limits compared to the quasi-static case, which agrees well with the experimental observation. For the plane-strain tension condition toward the equibiaxial tension, the prediction overestimates the forming limits slightly. On the left-hand side of the FLD, the predictive capability is not consistent again as the quasi-static condition. The MMFC slightly overestimates the forming limit strains for the specimen with the sample width of 45 mm, while overshoots the geometry with 20 mm sample width largely. Despite the experimental consistency, one reason or this possible overestimation could also be the assumption of isotropic yielding and hardening. The uniaxial tension test results show such a phenomenon; however, the flow curve under biaxial loading could also impact the forming limits prediction for both the left and right sides of the FLD. In addition, the current formulation is based on the strain rate effect only, the adiabatic heating effect on the softening of the stress–strain curve is taken into account. However, its secondary effect on the strain path change and indirectly on the forming limits are not included in the model. A further extension of the MMFC to properly render the strain rate and temperature effects is an on-going topic for the prediction of the FLC under dynamic conditions.
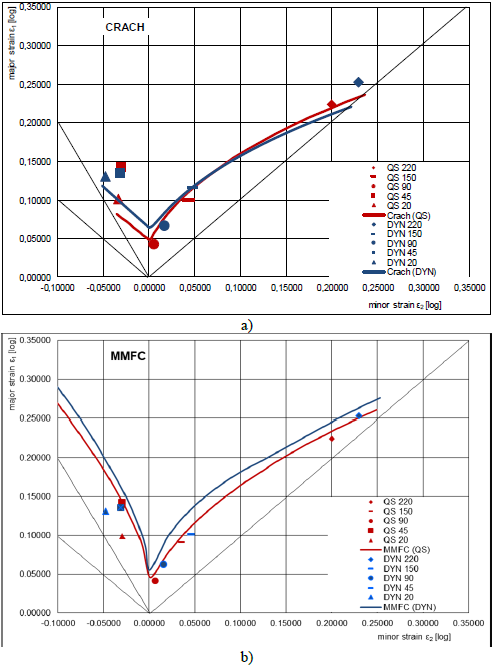 Fig. 9. Experimentally determined and theoretically predicted forming limits (a) prediction by CRACH model and (b) prediction by MMFC.
7 Summary
Within this paper, results of experimental quasi-static and dynamic Nakajima tests with the high strength steel Usibor 1500 have been presented in form of FLC. As illustrated by results of both FLC, there is an influence of the loading velocity on the multi-axial forming behaviour. In addition to the experimental determination, FLC of dynamic condition was theoretical determined by two different methods: on the one hand, the prediction was done with the algorithm CRACH, which is part of the modular material and failure model MF GenYld+CrachFEM 4.2, based on an initial imperfection theory. On the other hand, the FLC was predicted by the extended MMFC. Both different theoretical models consider the materials strain rate dependency. Both models give quite a reasonable prediction for the quasi-static condition. However, for the dynamic condition, even if the three different FLCs show similar tendencies, no complete accordance of resulting FLC can be noticed. It indicates that the challenging experimental conditions do not only result in complexity in testing and measurements, but also in the numerical models. A more comprehensive material model, e.g. considering the adiabatic heating effect shall be further explored for an improve FLC prediction under dynamic loading conditions.
