1 Introduction
Additive manufacturing (AM) is one of the strongest driving forces to shorten the material/product development cycle in Industry 4.0, as it builds complex-shaped products by adding material layer-upon-layer from the raw materials, skipping the long production line in conventional manufacturing [1] and to finish the product directly on the market [2, 3]. During fabricating customized products with advanced attributes by AM, rapid heating above the melting temperature, and solidification of the molten material occurs numerous times as the re-heating/re-cooling processes. Additively manufactured metal components are subjected to thermal treatment cycles [4]. Thus, the microstructure of an AM part can result in a large difference from the one by conventional manufacturing processes e.g. casting, or forging. The observed microstructural features including the porosity, grain size, grain shape, crystallographic texture, etc. affect material mechanical properties in return. Therefore, it is important to bridge the correlation between microstructure and mechanical properties, and understand the influence of the corresponding AM processing parameters, to realize process optimization and materials design.
Selective laser melting (SLM) is one representative of the powder bed fusion (PBF) technology. Studies have been performed previously in AM technique on many metals. Kok et al [6] carried out a critical review on experimentally investigated microstructure and mechanical properties and pointed out that the increased heterogeneity and defects in AM microstructure would bring profound anisotropy behavior, compared to their conventionally manufactured counterparts [7-9]. It was noted that the epitaxial columnar grain is a common microstructure morphology in AM metals, and the grain long axis is normally along the building direction (BD) [10], which causes the plastic anisotropy and even offers possible damage initiation site. For AM steels, the existing studies mainly focus on the austenite stainless steel, and the report on the AM martensite steel in terms of the anisotropic investigation is still blank in the literature, especially on the fine-scale in-depth investigations of the relationship between microstructural heterogeneities and their anisotropic mechanical properties.
This study focuses on the systemically characterization and analyses of the anisotropic plasticity behavior of a precipitation hardening stainless steel (PH1) by AM. The progress starts from geometry design and specimen manufacturing of the AM PH1 steel, followed by experiments on mechanical property characterization, mainly the anisotropic plastic responses. Section 2 gives an overview of AM PH1 steel production including specimen geometry design, material chemical composition, material production, and specimen manufacturing procedure. Section 3 introduces the lab-level mechanical testing techniques, i.e. the tensile testing coupling digital image correlation (DIC) method including the sample preparation, testing setup, and post-process for data analysis. Section 4 is the preliminary mechanical testing results and discussion.
2 Material production
2.1 Material printing layout
Analogously to traditional manufactured materials, e.g. the rolling direction-transverse direction-normal direction coordinate system of cold-rolled metals, the anisotropic responses of AM materials are investigated in terms of the different directions in the manufacturing space as well. For AM materials, the manufacturing space is formed by the building direction along the z-axis and the building plate (x-y plane), which is composed of the recoater direction (RD) along the x-axis and transverse direction (TD) along the y-axis. Similar to rolling direction of rolled materials, the building direction is normally regarding as the focused direction of AM materials. There are two methods to manufacture the anisotropic specimens. The first one is similar to the traditional method by producing large material plates or sheets and then cutting targeted specimens along aimed investigation directions. The second method is directly producing blocks or specimens with closed dimensions for testing along varying investigation directions. In this study, the second method was chosen, and the anisotropic mechanical responses were characterized by the uniaxial tensile testing. The outline of the tensile specimen was 110 mm × 20 mm × 1.5 mm. Considering 3-5 parallel mechanical tests for each loading condition and the allowance for the finish, the blocks with dimensions of 120 mm × 25 mm × 15 mm were printed. The longest dimension is printed along the focused direction. The investigation directions are building direction, transverse direction, and recoater direction, marked with BD, TD, and RD respectively, as shown in Fig. 1.
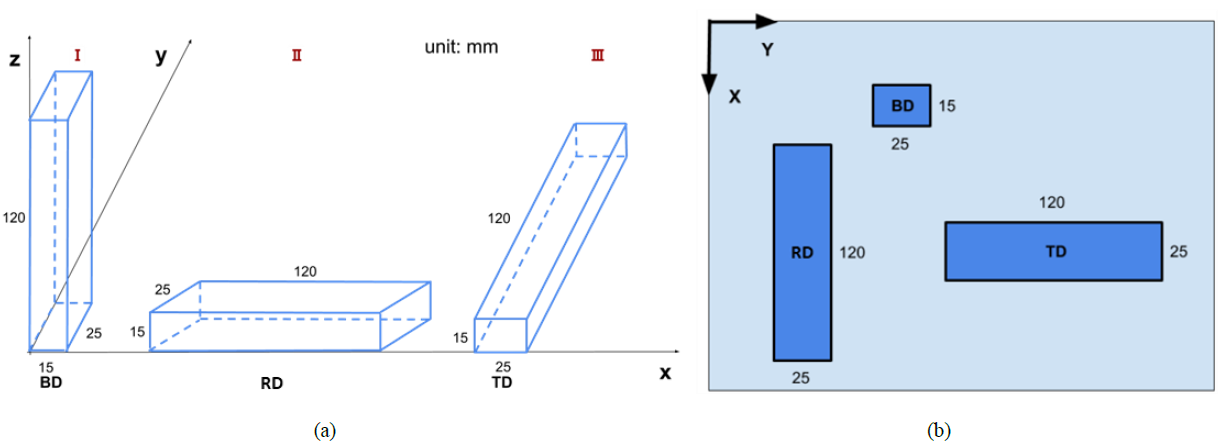
(a) 3D sketch of the printing plan, (b) 2D projection of the AM specimens on the building plate.
Fig. 1 Layout of AM PH1 specimens (unit: mm).
2.2 Material composition
The samples were fabricated from the pre-alloyed stainless steel PH1 fine powder provided by Electro Optical System (EOS) GmbH, Germany. The nominal composition (in wt.%) of the powder is shown in Table 1. The relative density of powder raw material is approximate 100% (7.8 g/cm3).
Table 1 Chemical composition of PH1 powder, wt.%

2.3 Specimen manufacturing
The material was printed by an EOS M290_400W machine. The rotating scanning strategy was employed with 67° rotation in each layer. The base plate temperature was set around 100 °C. A consistent production parameter set recommended by EOS was employed for all printed PH1 blocks. After printing, no additional heat treatment process was applied, therefore, the original printed microstructure is preserved. The blocks were wire-cut by electrical discharge machining (EDM) to obtain the final tensile specimen geometry according to the drawing in Fig. 2. The dog-bone outline is used for the uniaxial tensile testing with a gauge length of 30 mm, a width of 6 mm, and a thickness of 1.5 mm.

Fig. 2 Tensile test sample geometry. (unit: mm)
3 Mechanical testing
3.1 Specimen preparation
The digital image correlation (DIC) technique was used to measure the displacement during the tensile testing. The full-field displacement could be obtained by the optical DIC system. High surface quality is required for the DIC tensile specimens. After EDM, if the specimen surface flatness was not good enough, additional grinding and polishing preparation was conducted. The observed specimen surface is lacquered with an even coating layer of white paints as background to ensure the image quality. Besides, to improve the spatial resolution and displacement sensitivity of the DIC measurement, a pre-designed optimal feature pattern with 1800 dpi resolution [11] was printed on a tattoo paper. Then the pre-printed transparent tattoo paper further adhered to the specimen surface. The finally prepared specimen is shown in Fig. 3 (a). A detailed tattoo paper pattern can be seen in Fig. 3 (b) and with a zoom-in of the localized area in (c).
3.2 Tensile testing setting up
The uniaxial tensile testing was performed at room temperature with a Zwick/Roell Z020 screw-driven tensile testing machine, which has a maximum load capacity of 20 kN. To start the tensile testing, the specimen of AM PH1 was gripped at each end and stretched along its length direction at a constant crosshead velocity in the universal tensile test machine until it fractures. The applied load and full-field displacement at the uniform deformation zone were measured using a load cell and an optical DIC system, respectively. The chosen constant crosshead velocity was 0.9 mm/min, and for the specimen gauge length of 30 mm, it corresponded to the quasi-static strain rate of 5×10⁻⁴ s-1 before necking. 3 parallel tests were conducted for each loading condition.
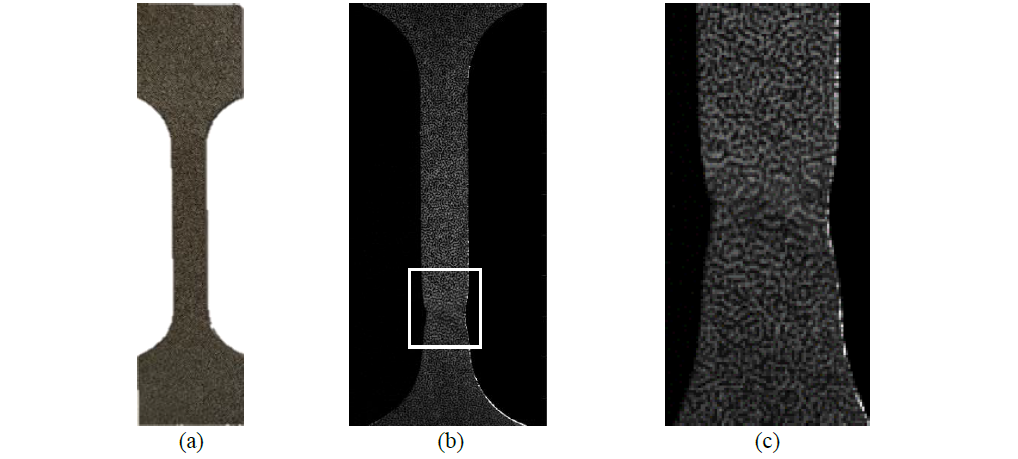
(a) Before the tensile testing, (b) Last deformation image before fracture, (c) the zoom-in of the highlighted area in (b) with a focus on the severe localization.
Fig. 3 Specimens with 1800 dpi DIC pattern.
The testing set-up is shown in Fig. 4. Lighting conditions were improved by utilizing indirect diffuse lighting, which minimized reflections from the material surface. A spotlight was placed behind the specimen and the light is reflected from two curved curtains made of projector screen canvas, located in front of the specimen. Observations by the DIC camera were done from an opening between the curtains. The DIC camera detector had a resolution of 20 pixels/mm. The device recorded pictures at a detection rate of 2 Hz during testing. Fig. 3 (b) shows an example of the DIC image of the last deformation frame before the final fracture. It can be seen that the pattern on the tattoo paper is still consistent even if there is strong localization.

Fig. 4 Uniaxial tensile testing set-up with DIC system and indirect diffuse lighting.
3.3 Post-process for data evaluation
In terms of testing result evaluation procedure, from the measured force–displacement data, both the engineering stress–strain curves and the flow curves can be calculated, as well as the Lankford coefficients (r-values) evolution curves. With the measured force F by the load cell, displacement 𝛥𝑙 by DIC and initial specimen dimensions (length 𝑙0 , width 𝑤0 , and thickness 𝑡0), the engineering stress 𝜎E, engineering strain 𝜀E, true stress 𝜎T, and true strain 𝜀T are calculated as follows:

The true plastic strain along the elongation direction, i.e. length, is calculated according to equation (5) [12]:

where 𝑆0 is the original cross-sectional area, 𝑚E is the slope of the elastic part of the stress curve. The true plastic strain along the transverse direction, i.e. width, is calculated according to equation (6) with the material Poisson's ratio 𝜈:

According to the constant volume rule during the plastic deformation, the true plastic strain along the third direction, i.e. thickness, is calculated according to equation (7):

The Lankford coefficient, i.e. r-value, is defined as the ratio of the true plastic strain of width and thickness directions:

The results are shown in Section 4.
4 Results and discussion
The anisotropic behavior of AM PH1 steel is characterized by the engineering stress–strain, the true stress–strain, and the r-values, as shown in Fig. 5 and Fig. 6. The parallel tests along each direction show good repeatability on the results. The AM PH1 steel has a yield strength (YS) close to 900 MPa and the ultimate tensile strength (UTS) higher than 1000 MPa along all loading directions. Meanwhile, a large deviation in uniform and fracture elongation can be observed when the loading direction varies. The fracture elongation can reach around 10% along RD/TD but only around 7% along BD. The r-value of AM PH1 steel is always smaller than 1 and increases with strain evolution, which means, the plastic deformation along the specimen thickness directions is always larger than it along the width directions, no matter which manufacturing direction of the specimen is.
Distinct anisotropic response of the AM PH1 steel can be observed from these results. Generally, the RD and TD results are similar or almost overlapping with each other, especially for the stress–strain responses. This is caused by the rotating scanning strategy. During the material production, the laser scanning direction (SD) is not always along the RD, instead, it rotates 67° between each layer to avoid spattering and improve the quality of printed specimens. Therefore, at the macroscopic level, with the specimen thickness much larger than the scanning layer thickness, the defined RD and TD shall be identical. More generally, the macroscopic mechanical property along any direction on the RD-TD plane shall be consistent, which is reflected by the stress–strain curves and the r-values of the materials tested along RD and TD.
Meanwhile, the curves along BD is far away from the curves of RD and TD, especially in terms of the elongation or strain behavior. The similar yield strength values along different loading directions can be observed. However, the UTS along BD is more than 100 MPa higher than that along RD/TD, which is also related to the anisotropic strain hardening behavior [13, 14]. The BD specimens have the shortened uniform and fracture elongation compared to the RD/TD specimens, and lower strength. The evolution of the anisotropic behavior is also shown for both stresses and r-values, as presented in Fig. 6. For the true stress, the difference between BD and RD/TD is reduced. A hypothesis is proposed to explain the anisotropic behavior of the investigated AM PH1 steel. The reason for the different macroscopic mechanical properties shall be related to the microstructure information, which is strongly affected by the production process. Since there is no post AM heat treatment was performed in this study, the microstructure of specimens is directly resulted from the additive manufacturing process. As aforementioned, a consistent production parameter set was employed for all printed PH1 blocks in this study. However, due to the different block geometries, i.e. dimensions of the printed blocks (Fig.1), the thermal history within these blocks might differ from each other. For instance, as the BD block has a relatively smaller cross-section (on RD-TD plane, 15 mm × 25 mm), a shorter laser scanning path is expected on each layer. The material will go through more frequent repeats or even continuously heating. The continuously thermal effect time is increased, which might result in the continuously abnormal grain growth along the BD. The big and heterogeneous grain size will lead to reduced ductility. While for the RD and TD specimens, the cross-section on the RD-TD plane is much larger (120 mm × 25 mm). Therefore, the thermal effect along the BD might be also reduced, which might lead to the smaller grain size in these specimens and the grain size distribution shall also be more homogeneously compared to the BD block. The smaller and more homogenous grain size distribution shall take responsibility for the higher strength and distinctly increased uniform and fracture elongation of the RD/TD specimens. In addition, the different thermal field and history would also bring different grain shape and crystal orientation distribution. For example, the continuously abnormal grain growth along the BD might bring an extremely small grain shape aspect ratio (length ratio between the shortest axis and the longest axis) and strong texture in the BD specimen. Due to the technique’s limitation, thermal history cannot be recorded during production. The microstructure analysis is planned to verify the proposed hypotheses. The electron backscatter diffraction (EBSD) measurement will be carried out to analyze the grain size, shape, and orientation distributions, which shall be helpful to reveal the reason for the macroscopic anisotropic properties of AM PH1.
Furthermore, more fine-scale in-depth investigations of the relationship between microstructural heterogeneities and their anisotropic mechanical properties shall be carried out by the numerical simulation approach. An artificial 3D representative volume element (RVE) coupling crystal plasticity (CP) method [15] can be employed for bridging the microstructure and anisotropic behavior. The CP parameters can be calibrated based on the reference material microstructure and flow curve along BD. The numerical approach including models and parameters can be validated by tensile response along other loading directions. With the calibrated CP model and parameters, a series of RVEs with variable microstructural features can be generated as a virtual laboratory to reveal the anisotropic behavior in terms of AM microstructure. Moreover, post AM heat treatment can be conducted to adjust the final microstructure. Therefore, a future study could be expected on the influence of heat treatment on plastic anisotropy.
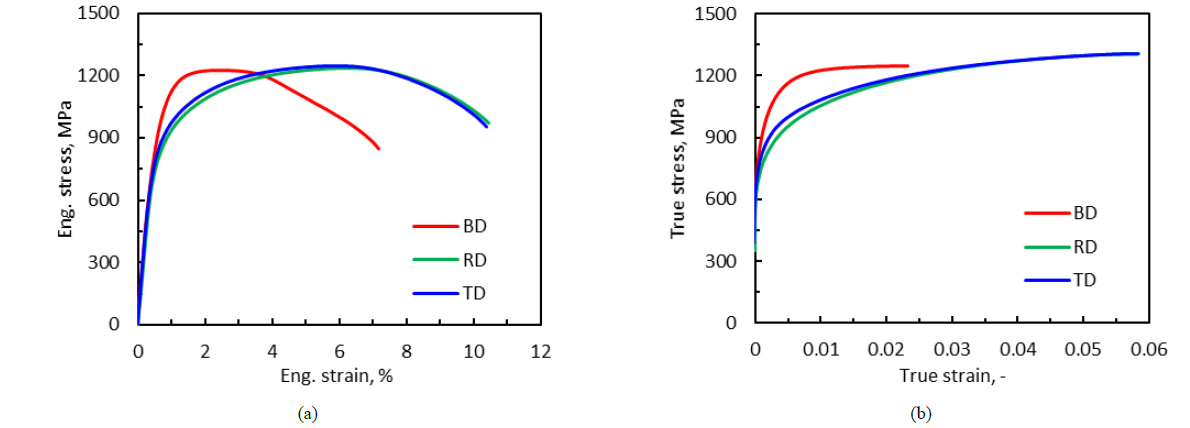
Fig. 5 Stress–strain responses of AM PH1 steel along BD, RD, and TD uniaxial loading.
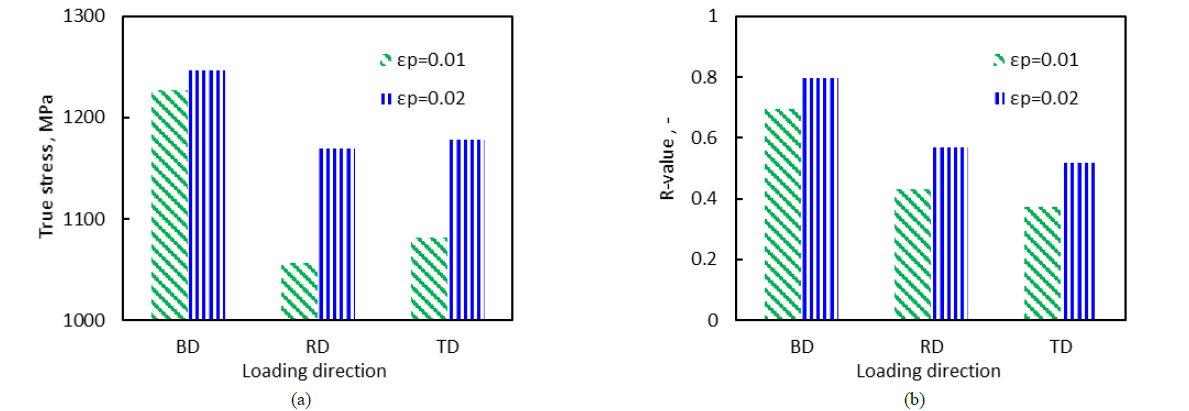
(a) True stress, (b) R-value.
Fig. 6 Anisotropic responses of AM PH1 steel along BD, RD, and TD uniaxial loading at the true plastic strain of 0.01 and 0.02.
5 Conclusions
In this study, the anisotropic behavior of additive manufacturing PH1 stainless steel was investigated. Specimens were produced and elongated along the building direction, recoater direction, and transverse direction to study the plastic anisotropy behavior of the materials. With the same processing parameters, similar tensile properties are found for the samples tested along recoater and transverse directions; however, very distinct behavior is discovered for the test along the building directions. A hypothesis is proposed to explain the macroscopic anisotropic behavior, that the printing geometry also influences the grain size, shape, and texture of the AM materials. Therefore, a detailed microstructure analysis process is designed as an on-going study. Furthermore, the numerical laboratory shall be built up to obtain the quantitative relation between the AM microstructure and mechanical properties. The post AM heat treatment effect on final microstructure and anisotropic behavior can also be considered in the future study.
Acknowledgments
The authors gratefully acknowledge Mr Janne Peuraniemi and Mr Kim Widell from the Advanced Manufacturing and Materials group of the Department of Mechanical Engineering at Aalto University for their support on material manufacturing and mechanical testing.
