1 Introduction
Lattice structures, as cellular materials, received great attention in the last two decades for their benefits, such as high strengthto-weight ratio, heat exchange, load bearing, excellent energy absorption, and minimizing material requirements [1,2]. Additive manufacturing (AM) technology, capable of fabricating geometries in almost all types of shapes, gave high push to this type of structures [3-5]. In general, a lattice structure is an architecture formed by an array of spatially arranged unit cells with edges and faces. One of the most important characteristics in analyzing the mechanical behaviour of these structures is the distinction between stretch- and bending-dominated structures [1,5,6]. Stretch-dominated lattice structures show relatively superior strength and stiffness, so that can be employed to bear loads. On the other hand, the strength of bending-dominated lattice structures is relatively low, but they are more useful to absorb energy [7]. Moreover, the mechanical properties can be affected by many factors such as cells morphology and size, cells regularity (stochastic or periodic) and nevertheless bulk material [8]. In stochastic structures, the cells and their shapes are arranged in unsystematic probability distribution whereas in periodic lattice structures the cells are arranged along separate axis. Several materials can be employed in the manufacture of these structures, including metals, polymers, ceramics, composites, etc. and they are of interest for structural chemists, biologists, engineers and material researchers.
In this paper stretch-dominated lattice structures have been considered. In details, a 3D periodic lattice structure of different cell size, TPMS (triply periodic minimal surface), made of epoxy resin by DLP technology was studied. In contrast to manually generated structures, TPMS structures are mathematically generated by using various algorithms [9,10] and do not require postprocessing procedures to refine and connect the lattices. The Gyroid cell was considered. A comparison between 8x8x8 mm3 unit cell and a scaffold of the same dimensions but made with units of 4x4x4 mm3 was performed. Mechanical compression tests, at different strain rate (10-3 to 5x10² 1/s), were carried out to investigate the compressive behavior of the single cell and the scaffold. Dynamic tests were performed by a direct spit Hopkinson bar [11-13]. Cells struts of different thickness have been considered too. A constitutive model to assess the experimental findings has been calibrated.
2 Material and methods
2.1 Material and specimen design
The Digital Light Processing (DLP) is a type of 3D printing technology belonging to the VAT Polymerization. The great advantage of this technology is the capability to combine very high precision with low printing time [14]. In this study, all specimens were printed by means of a commercial DLP printer (Anycubic Photon S) able to print a wide range of 405nm photosensitive resins (Fig. 1). The material is a commercially available high-quality resin named Value, Prima Creator product. The resin has a composition of 40-50 epoxy thermoset, 20-40 monomer, and 3-5 photoinitiators in wt.% (Prima creator datasheet). Furthermore, this resin has a crystal-clear transparency.
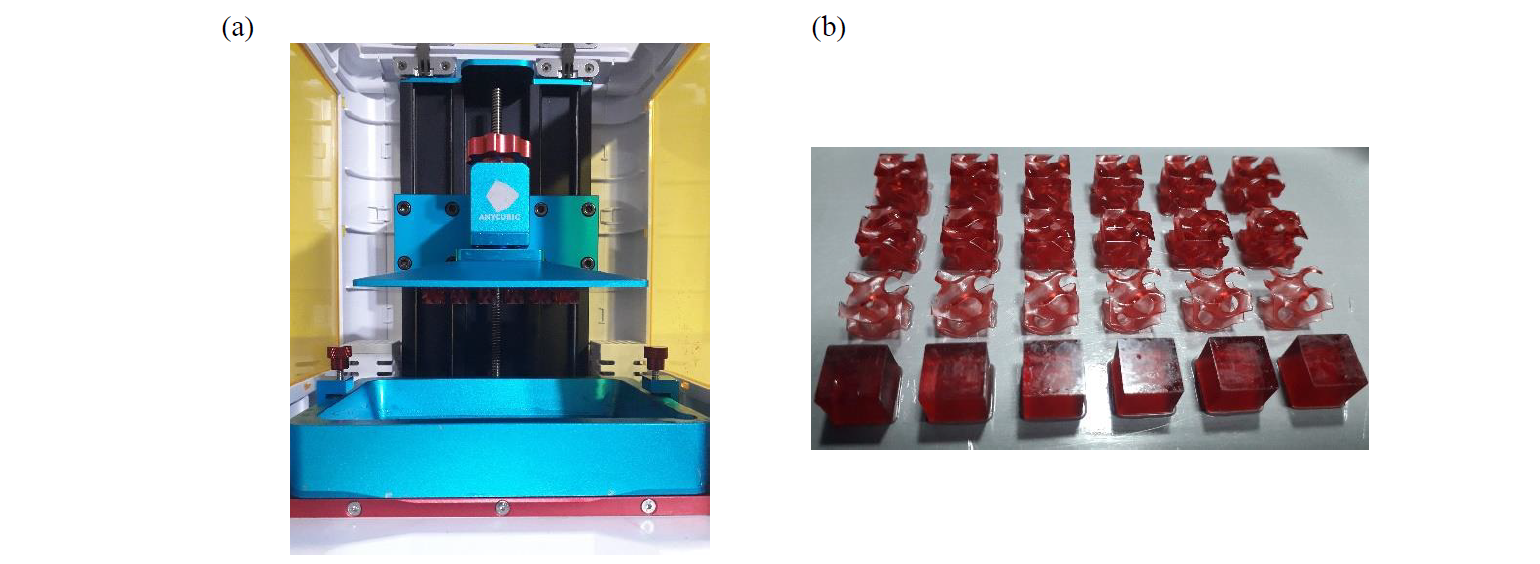
Fig. 1. 3D printing: (a) Anycubic 3D printer (b) Printed specimens
There are many variables in the DLP printing process, such as exposure time, layer height, bottom layers number, supports, and so on. Thus, the definition of the process parameters is crucial for this Additive Manufacturing technology. The process parameters, listed in Table 1, have been previously tested in the laboratory and ensure the best choice in strength and printability.
Table 1. Process parameters
|
Parameters |
Value |
Unit |
|
Layer height |
0.05 |
mm |
|
Bottom Layers (BL) |
5 |
n° |
|
Time exposure BL |
50 |
s |
|
Time exposure layer |
5 |
s |
|
Off exposure |
3 |
s |
|
Post-Treatment |
Sunlight: 2 |
h |
All specimens were printed without rafts and quickly removed by the building platform. The lattice structures were perfectly self-supported for this kind of AM technology even if they present a hollow shape. Hence, they were printed without supports, preserving high resolution details.
The entire pre-processing was programmed in Ntopology™ software. The features of the shape specimens are reported in Table 2. The cellular structures were of TPMS Gyroid type, with different sizing but similar density. The Gyroid structures were designed into Ntopology software due to its peculiarity in modelling lattice structures. Then, the STL format files of all specimens were exported to the slicing software Photo and the Mesh format files were exported to the FE model software Hypermesh.
Table 2. Gyroid Specimens.
|
Dimension [mm] |
Cell |
Thicknesses [mm] |
Designation |
|
|
Unit cell 8 |
8x8x8 |
8 |
1 1.5 2 |
C8 x tX (X = 1, 1.5, 2) |
|
Scaffold unit cells 4 |
8x8x8 |
4 |
0.5 0.75 1 |
C4 x tY (Y = 0.5 ,0.75, 1) |
In order to measure the properties of the base material, a solid cube of 8 mm side has been printed with the same parameters as in Table 1. Instead, the cellular structures had the same external dimension but with different elementary Gyroid structure, as shown in Fig. 2. The unit Gyroid cell with edge 8 mm is repeated 1 time in the base material cube, whereas the cell with edge 4 mm is repeated 8 times inside it.
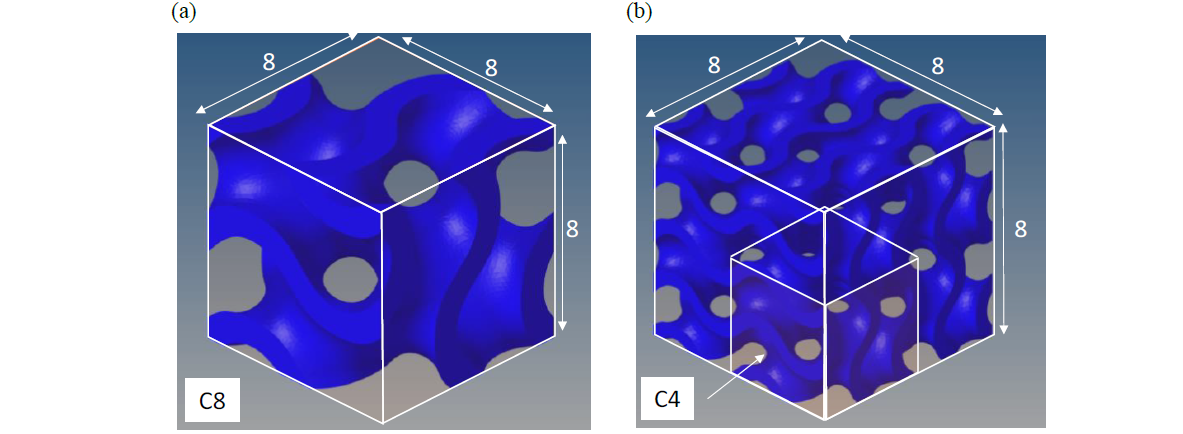
Fig. 2. Gyroid (a) unit cell 8 and (b) scaffold of unit cells 4.
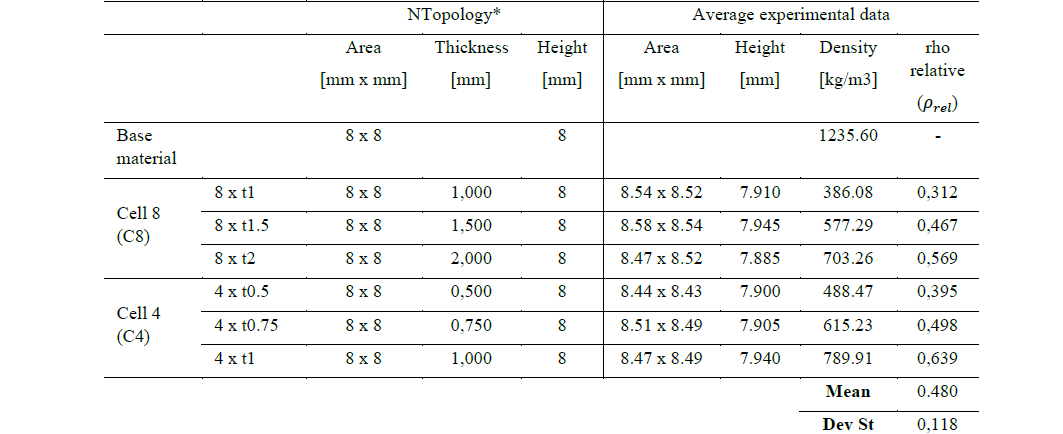
Then, the printed specimens were measured to verify the relative density and the size accuracy (Table 3).
Table 3.Details of Gyroid specimens for quasi-static and dynamic tests.
2.2 Equipment
Quasi-static compression tests were performed by a universal tensile machine equipped with a 50kN load cell (Zwick/Roell® Z050, Fig. 3a), whereas dynamic ones by a split Hopkinson bar (Fig. 3b) [15,16]. The latter, available at the lab of Polytechnic University of Marche is a direct tension-compression Hopkinson bar made of three aligned bars, named pre-stresses (3m), input (7.5m) and output bar (4m). In this machine, the sample is placed between the input and output bar and is deformed by a compression pressure wave generated by pre-loading in tension the pre-stressed bar and its subsequent sudden release. Acquiring the input and output waves, by properly placed strain-gages, it is possible to obtain the stress-strain flow curves. More details are reported in [17]. Dynamic tests have been recorded by a Photron® SA4 at 100 kfps.
Molykote©MoS2 grease was used to reduce the friction between the samples/fastener interface.
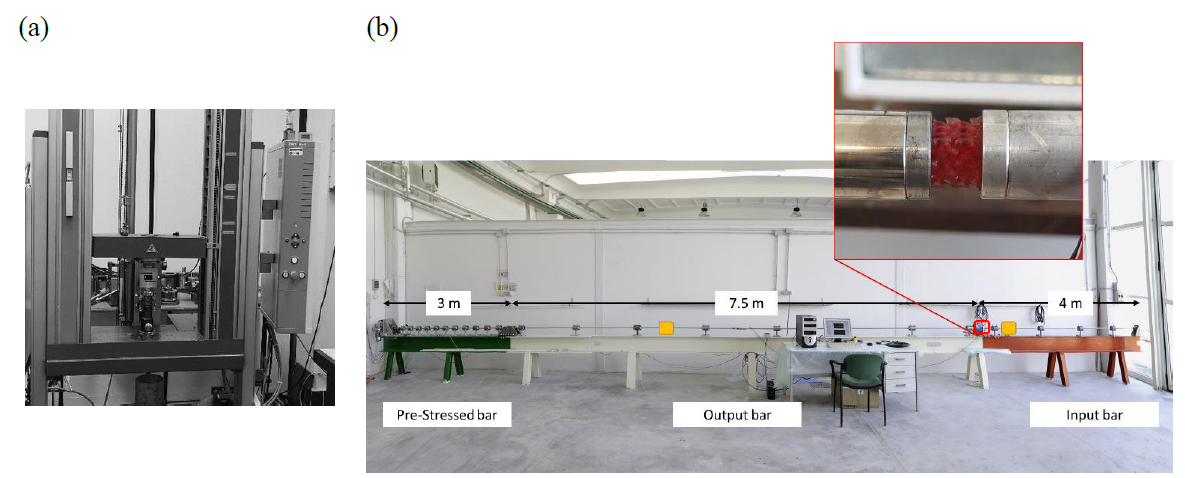
Fig. 3. Equipment (a) Tensile machine, (b) Hopkinson bar.
2.3 FE models
Two 3D FE model have been prepared by Optistruct/Radioss available in Hyperworks. The material law has been modeled as piecewise linear obtained experimentally. A mesh sensitivity analysis was performed to evaluate the element size effect too. Tetra elements with a mean size of 0.1 mm have been chosen as optimum in term of results and computational cost. Both models are shown in Fig. 4.
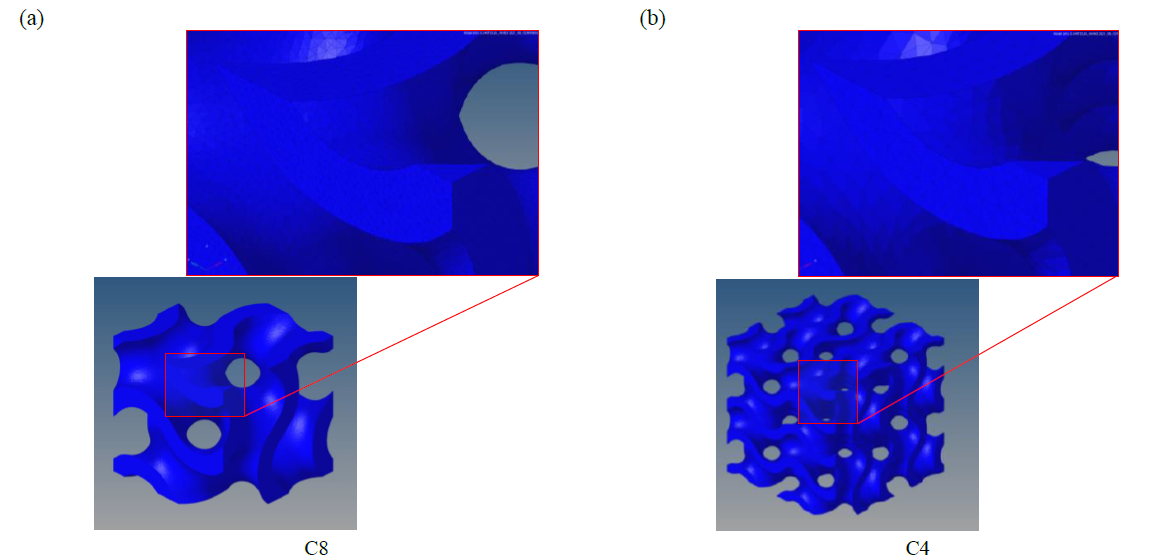
Fig. 4. Mesh details of (a) unit cell 8 and (b) scaffold of unit cell 4.
3 Results and discussion
3.1 Quasi-Static and dynamic behaviour
Quasi-Static tests have been carried out for both the base material in bulk form and the unit cells and scaffold ones. The engineering and true stress–strain flow curves of the base material are reported Fig. 5, while all tests results of unit cell and scaffold are reported in Fig.6.
By analyzing the quasi-static curves, it is possible to observe a reduction of cell resistance passing from the base material to the lattice structures, due to the lower amount of material present within the same considered cross-section. Conversely, the mechanical behaviour improves with the same cell type as the Gyroid thickness increases. All samples showed a brittle failure.
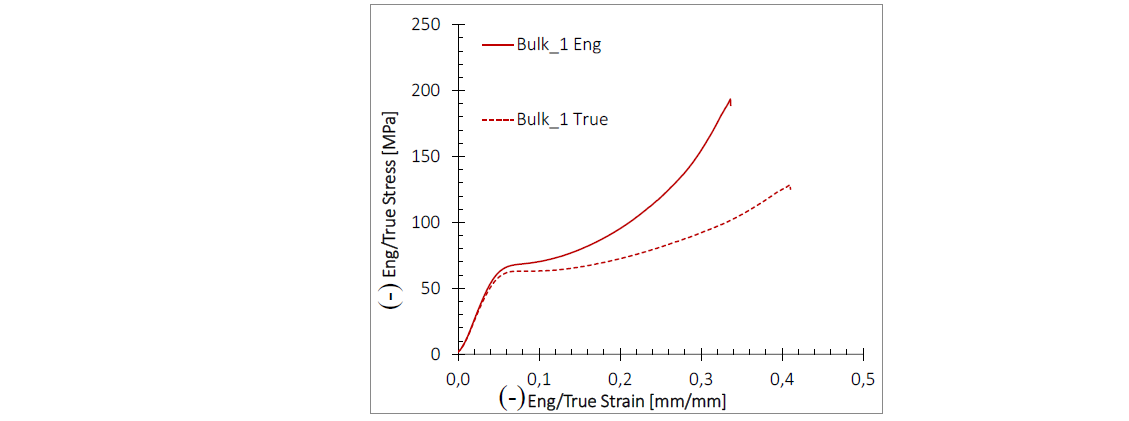
Fig. 5. Base material: Engineering and true stress-strain curves.

Fig. 6. Eng. Stress-Strain curves for (a) unit cell 8 and (b) scaffold of unit cell 4.
The dynamic test results are here reported to highlight the strain rate sensitivity of this material. Figures 7a, 7b and Fig. 8 show the mechanical behaviour, presented in terms of engineering stress–strain curves. Strain rate affects both the strength and elongation to failure. In particular, the latter decreases as strain rate increases.
The brittle behaviour revealed in quasi static tests is confirmed and accentuated in dynamic ones.
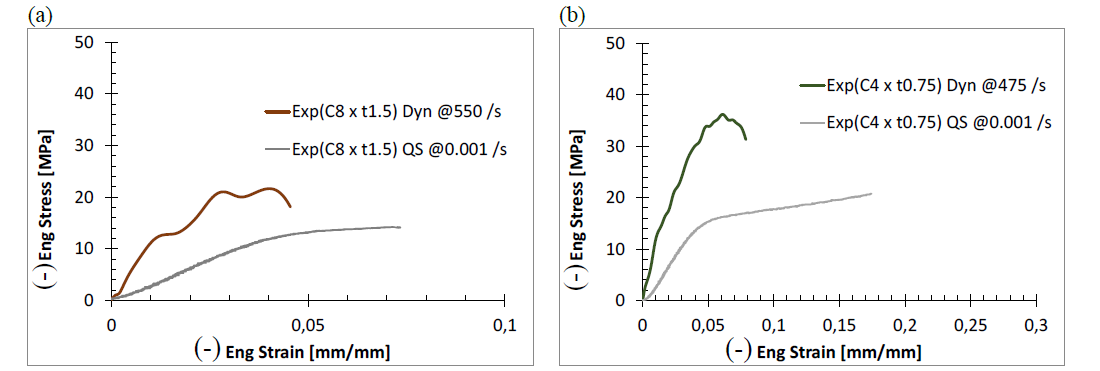
Fig. 7. Eng. Stress-Strain curves for (a) unit cell 8 and (b) scaffold of unit cell 4.
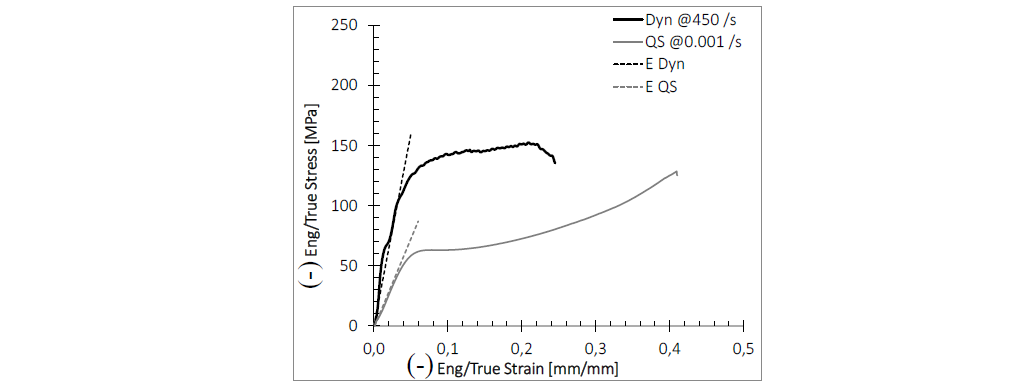
Fig. 8. True. Stress-Strain curves for the base material.
Another characteristic of these Gyroid units is the dependence of mechanical properties on relative density. The relationships between strength, failure strain and Young modulus with relative density are presented in Fig. 9 and Fig. 10. Here it can be observed that the resistance typically increases roughly linearly with relative density for both structures (Fig. 9c,10c). The yield stress has been evaluated as in Peroni et al [18], by intersecting the linear elastic part with the linear plastic one. Finally, also the Young modulus increases linearly with relative density (Fig. 9a, 10a).
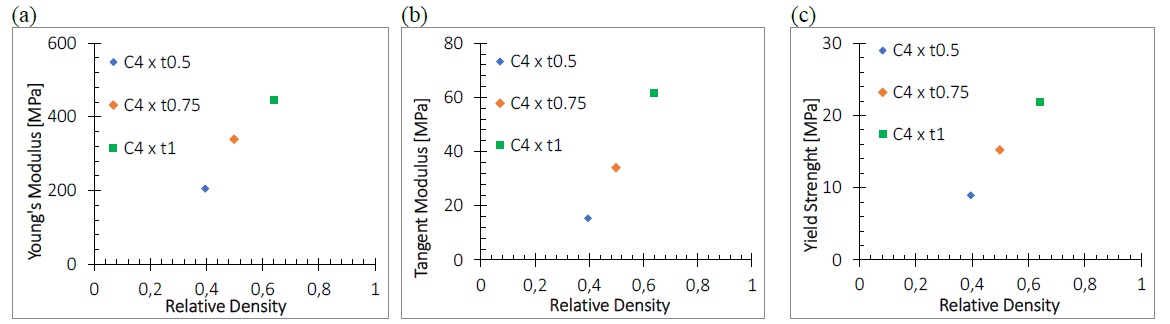
Fig. 9. C4 - Relative density effect: (a) Young Modulus, (b) Strain to failure and (c) Strength to Relative Density
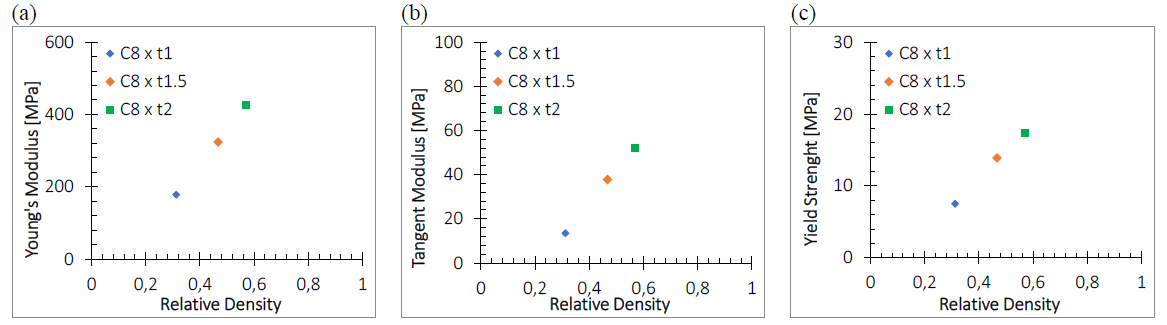
Fig. 10. C8 - Relative density effect: (a) Young Modulus, (b) Strain to failure and (c) Strength to Relative Density
The relationship between the cell mechanical properties and relative density may also depend on the cell size. At this point of the research, the comparison of results is limited only to the study of the 2 structures presented.
The following figures (Fig. 11) report additional experimental data, exhibiting an overall linear trend for the Young's modulus and tangent modulus over the range of relative densities investigated. This behavior deviates from the more common GibsonAshby [19] observed in lattice structures. Moreover, the discrepancy was found also from other authors [20, 21].
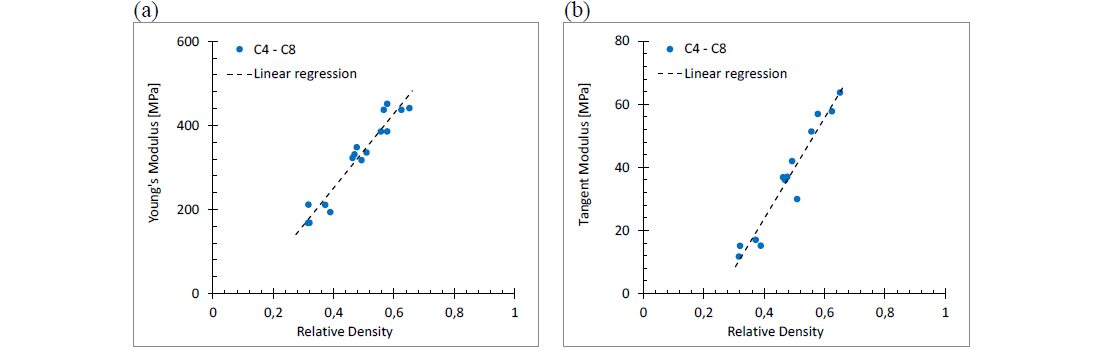
Fig. 11. Young's modulus and tangent modulus to relative density for both structures
Further, as far as the strain to failure is concerned, it appears to be lower for the cell structures if compared with the bulk material; moreover, the strain to failure seems independent on the relative density for the tested conditions (Fig. 12). Finally, the scaffold unit cell 4 shows higher strength and ductility than the cell 8 structure.
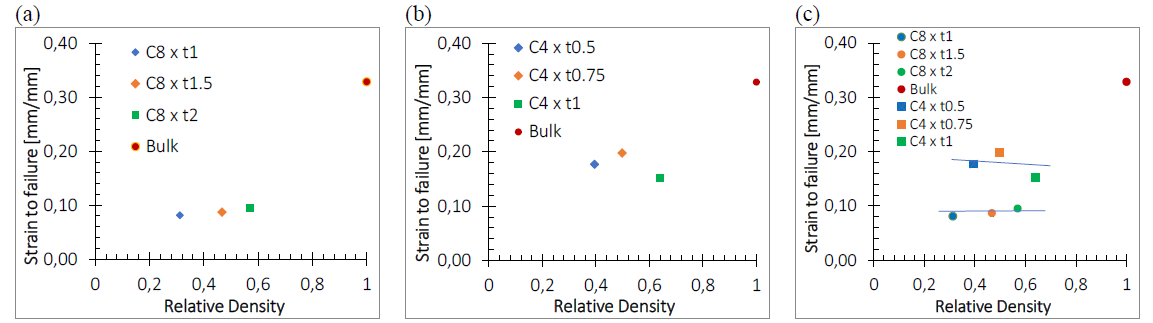
Fig. 12. Relative density effect on strain to failure (a) unite cell 8, (b) scaffold of unite cell 4 and (c) comparison between them
3.2 Analytical material model
Experimental tests were implemented for the material characterization. The first step was to find, between the several material formulations, the one which better reproduces the experimental evidence. In the present work, Bi-linear law, expressed by equation (1), was chosen. The material parameters have been imposed to be dependent on the relative density.

where E, ET and B are the Young modulus, Tangent modulus and a material constant, respectively. The latter is expressed by equation (2).

Then, the second step was to define in the previous analytical formulation, utilised to describe the constitutive law of the cellular material, the effect of the relative density (𝜌𝑟𝑒𝑙).
By observing the trend of Young modulus and Yield strength as function of 𝜌𝑟𝑒𝑙 in Fig. 9a and c, a linear regression between E-𝜌𝑟𝑒𝑙 and 𝜎𝑦-𝜌𝑟𝑒𝑙 can be noticed. For what concern ET, the trend is similar, as for the previous variables (Fig. 9b). Hence, for all these points, a simple equation is reported in (3):

where 𝑚𝐸,𝐸𝑇,𝜎𝑦 and 𝑞𝐸,𝐸𝑇,𝜎𝑦 are the coefficients whose value are reported in Table 4.
Table 4. Equation coefficients

These linear regressions between E-𝜌𝑟𝑒𝑙, 𝜎𝑦-𝜌𝑟𝑒𝑙 and ET-𝜌𝑟𝑒𝑙 can be used by engineers in designing and verifying the components made of Gyroid lattice structure; however, engineers should be aware that the validity of the model is limited to the specified unit cells and for the range of relative density here considered, reasonably from 0.25 to 0.65.
Fig. 13 reports the results of the analytical formulation superposed on the experimental curves for the relative densities ρrel = 0.312, ρrel = 0.467 and ρrel = 0.569 of C8x1, C8x1.5 and C8x2 structures.
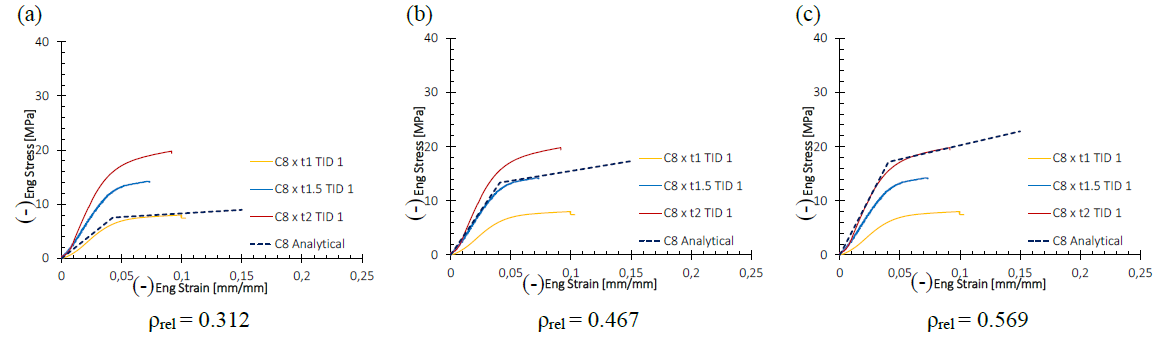
Fig. 13. Stress-strain curves: comparison between experimental and analytical for unite cell 8 (C8)
3.3 Numerical verification: Mesoscale
Numerical simulations have been carried out to assess the role of the base material. Both 3D of unite cell (C8 x t1) and scaffold (C4 x t0.5) were prepared, as shown in Fig. 2. The base material has been modelled as piecewise linear. The compression tests of the two structures have been prepared sandwiching them between 2 rigid planes ( Fig. 14a). The equivalent plastic strain distribution for scaffold C4 x t0.5 is shown in Fig. 14b.
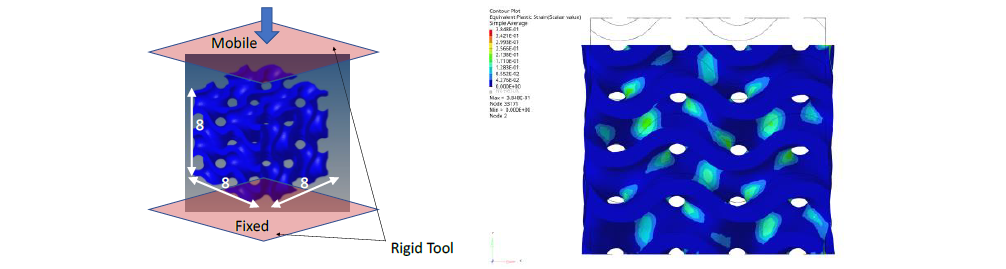
Fig. 14. Schematization of compression numerical simulation (a) and the equivalent plastic strain (b)
Fig. 15 reports the results in term of engineering stress-strain curves for both models. For what concerns the unit cell C8 there is a discrepancy between the numerical simulation and the experimental ones with an underestimation for flow curve response for cell with higher thickness; a good representation can be noted for the lower cell thickness. Conversely, a good response is obtained for structure with unit cell of 4mm. The observed difference could be affected to a limitation of the printing process which does not respect the thickness imposed. For both cell types, the elastic stiffness is very well-estimated.
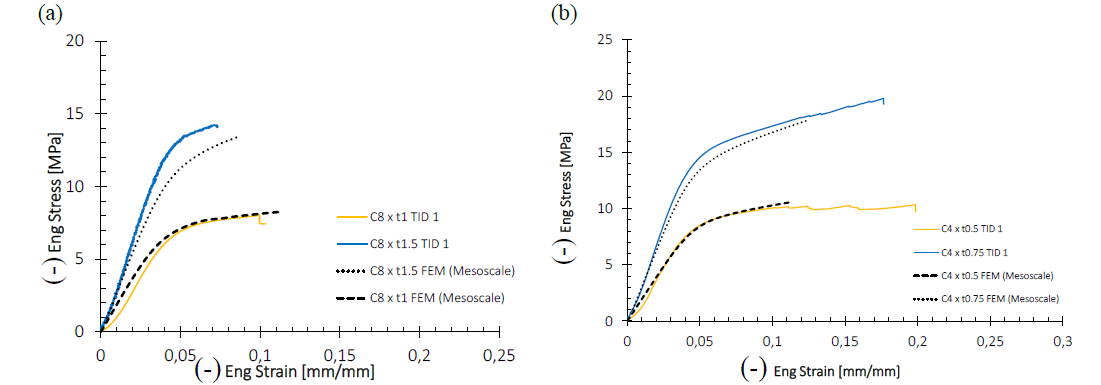
Fig. 15. Eng. Stress-Strain curves for (a) unit cell 8 and (b) scaffold of units cell 4.
4 Conclusions
In this paper, an experimental campaign of characterization of lattice structures manufactured with DLP technology has been carried out. In particular, elementary cells with Gyroid structure have been printed by varying the internal thickness. In addition, a comparison between the unit cell and a scaffold made by cells of reduced size has been made. The experimental results showed a dependence of the engineering stress-strain curves on the relative density. In addition, the material is very sensitive to strain rate variations, significantly increasing its resistance under dynamic conditions.
The quasi-static behavior of the lattice structures has been verified in the mesoscale by means of the characteristic curve of the bulk material. An equivalent bi-linear analytical model has been identified for a future macroscale investigation. In the latter, the constitutive parameters have been found dependent on the relative density with linear functions. The correspondence in terms of engineering stress-strain curves between experimental, mesoscale and analytical ones allows to simplify substantially the FEM modeling process of complex lattice structures, using an equivalent material.
