1. Introduction
Incremental forming is a low volume, high complexity suitable process for industry 4.0 and agile forming. The accuracy of the formed part has become more important from a cost reduction point of view because any increase in production volume due to the trial and error of the calibration process can result in an additional cost increase. Thus, there has been much research for developing an accurate model for predicting the incremental forming operation where the majority of the effect has been seen in using the finite element method (FEM) [1].
Compared to single point incremental forming (SPIF), two point incremental forming (TPIF) can achieve a more complex geometry by utilizing a die as back support. The die allows the introduction of compression during forming by squeezing the material between the tool and the die, which improves formability by increasing hydrostatic pressure. However, there have been reports of geometric deviation in the undeformed region in the middle where a convex surface was observed, which is supposed to be flat since no forming was done. This phenomenon has been named the bulge effect or pillow effect [2] due to its resemblance to a bulge or a pillow. This bulge is an inherent defect of the incremental forming process because the forming operation is conducted from out to in most cases. While it is possible to do the forming from in to out, it would require a specially created die that provides support during forming and a more complicated tool path scheme.
The bulge or pillow phenomenon has been observed by a few researchers and investigated for its origin. Ambrogio et al. [3] reported the pillow effect while trying to provide a statistical model for compensating for geometrical errors. Hussain et al. [4] tried to correlate forming parameters with bulge formation using the response surface method. It was shown that bulge increases with the step size increase, decrease with higher wall angle, and decrease with higher hardening exponent. While the work suggested that there exists a combination of processing parameters that minimize the amount of bulging. The influence of the hardening exponent was further observed by Al-Ghamid et al. [5]. In the succeeding work by Hussain et al. [6], it was shown additionally that stress ratio, which is affected by the different combination of process parameters, may impact the pillow height. Isidore et al. [7] tried to predict the bulging effect using finite element simulations with different process parameters. It was shown that compressive stress created during forming that is influenced by the different combination of process parameters seems to correlate with the pillow effect. While these studies provided a connection between bulge/pillow tendency and process parameters, they could not completely explain the bulge mechanism.
Shin et al. [8] provided a quantifiable explanation based on the material movement during incremental forming. If the formed geometry achieves the ideal geometry of the design where it observes the conservation of volume, there would be no bulge occurring. However, since incremental forming is an accumulation of deformation and each revolution of the tool achieves incremental deformation, it is difficult for the formed surface created during each revolution of the tool to observe the volume conservation. The difference in the volume is pushed forward during forming and gets accommodated at the end of the process in the undeformed section. In correlation with other researchers' work, the connection they have made between process parameter and bulge height can be complemented with the theory where the different combination of process parameters would result in a different amount of material movement and the different amount of bulge. The 2-D bulge was approximated to a beam buckling model and validated against the experiment based on material movement calculation.
The ability to predict bulge profiles in the undeformed region allows one to tune the process parameters so that the minimum amount of bulge occurs, which allows one to retain higher formability due to additional squeeze while still achieving the geometric accuracy. To predict the bulging phenomenon, a reliable model for 3-D bulge prediction is required. The conventional approach to predicting the bulge relies on the finite element method (FEM). The challenge of accurate bulge prediction relies on the accuracy of the model, which requires a small element size. However, it is very difficult to have both a high-resolution model with a small element size and an acceptable computation cost. Thus, a novel analytical model is proposed to predict the 3-D bulge profile based on a weighted summation method that considers material movement by utilizing a shape function. The model considers the effect of process parameters and part geometry with a single variable, an input material movement at the boundary, as the boundary condition. A shape function is introduced, which remains uniform regardless of different squeeze factors for given geometry to serve as a baseline bulge profile. Based on the derived shape function, the 3-D bulge profile is calculated based on the weighted summation method. The final result is compared with the experiment and validated. It was observed that the developed model was capable of predicting bulge with 5% of the computation cost of that of the FEM model with a deviation of the maximum height of less than 0.05mm.
2. Experimental Setup
Experiments are performed on a TPIF setup custom built over a Cincinnati HMC 400-EP CNC milling machine. A truncated cone with 67° wall angle, 157 mm opening diameter, and 55 mm depth is selected for investigation. A hemispherical-ended tool with an 8 mm diameter is employed to fabricate it on a 1.64 mm thick AL 7075-O sheet. Other process parameters such as step size and feed rate are kept constant at 0.5 mm and 42 mm/sec, respectively. A spiral-type toolpath is generated using the parameters mentioned above for the experiment, and MoS_2 is applied on the sheet surface to minimize friction between the tool-sheet interface. The forming forces are recorded in three principal directions throughout the experiment using a spindle mounted Kistler force sensor. The parts were scanned using a Hexagon, 75-series, Romer Absolute Arm with an integrated laser scanner. The parts were secured on an anti-vibration table. The resulting polygonal models were accessed and calibrated based on the known thickness of the undeformed material. Cross-sections were extracted to make a comparison with the predicted profile.
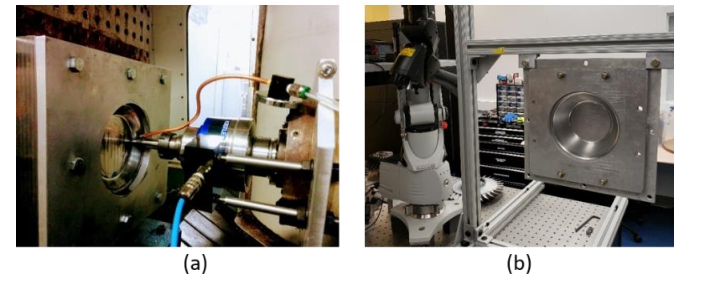 Fig. 1 The experimental setup of bulge analysis
(a) Showing the experimental setup for cone fabrication for two point incremental forming, and (b) laser scanner for part geometry measurement
3. Analytical Model for Bulge Prediction
3.1 Shape function
A shape function is introduced to account for the shape of the profile at an arbitrary location. This shape function provides a baseline function that will be scaled and translated based on the location of the node that makes up the region of interest. Different analytical functions were introduced to find a fit between experimental shape functions. The investigated shape functions include the sine function, 2nd order polynomial function, and ellipsoidal function. The comparison was made between the experimental bulge profile and different shape functions by normalizing the bulge height to 1 and the bulge width to 2 with the origin at the middle (Fig. 2 (a)).
While different convex functions qualify for shape function, the polynomial function with varying degrees seems to be the most suitable candidate for the shape function. The varying degree of polynomial allows the shape function to accurately portray the experimental shape of the bulge while allowing easy integration for calculation of the length of the arc. The shape function plays a key role in calculating the height of the bulge based on the base length and the additional material that is pushed in during the forming operation. Depending on what the shape function looks like, a different amount of additional material is required from that shape, as seen in Fig. 2. (b). The ellipsoidal function with the base length of 100mm requires almost two times more additional material to achieve the same height of bulge than that of 2nd order polynomial or sine function.
The normalized bulge shape function for TPIF cone 67° with 0% and 2.54% effective squeeze shows that they have the same shape function. It can be observed that the shape function depends on the part's geometry and not on the squeeze factor. The shape of the geometry, such as wall angle and tool shape, imposes a boundary condition on the edge of the undeformed section such that any addition of material results in the bulge that has a similar shape but is scaled by a constant value.
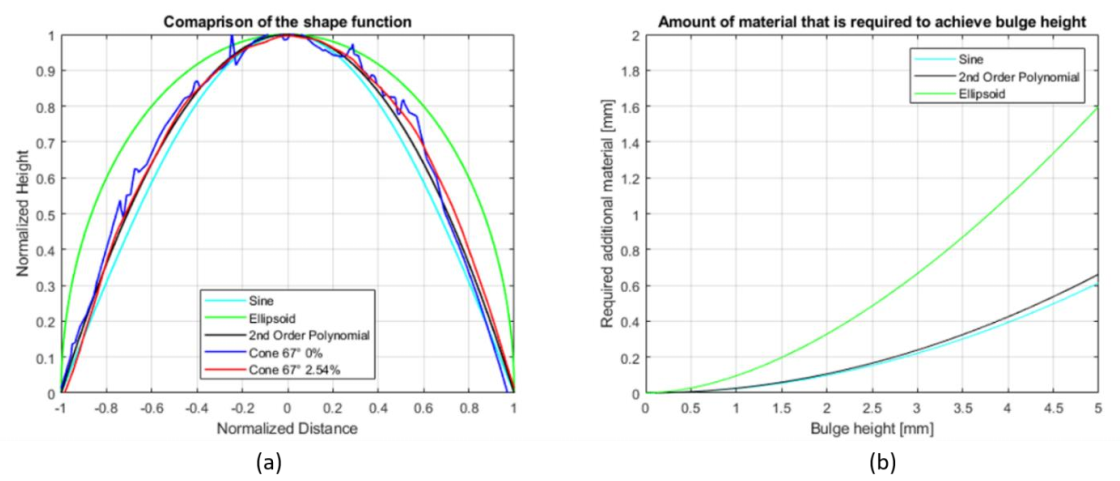
Fig. 2 Various shape function for cone 67°
(a) Comparison of various shape function versus cone 67° bulge profile, and (b) calculation of required material for achieving bulge height based on a base length of 100mm
3.2 The weighted summation for calculation of nodal bulge height
In the work of Shin et al. [8], a method of bulge prediction was presented based on approximation of the 2-D profile as beam buckling where the profile with the added material had to bend and buckle to fit the given geometric constraint. While this method provided some understanding of predicting the 2-D bulge profile, it could not predict the 3-D bulge profile. The bulge geometry calculation for a 3-D surface is more difficult compared to a 2-D profile based on cross-section analysis because depending on where the node is located in the undeformed region, the shape of the calculated bulge might be different in the horizontal direction versus the vertical direction. The prediction of a 3-D profile requires considering the effect of the material movement in a continuum sense, which happens at all of the boundaries between the undeformed and the deformed sections. The region of interest is discretized into a finite number of nodes. A novel weighted summation method with the shape function is utilized to calculate the bulge height for each of these nodes. The shape function provides a normalized baseline profile by taking into account the geometric effect of the part and incorporating it as the boundary condition, while the weighted summation method approximates the effect of the continuum while considering the different boundary conditions. The material accumulation is calculated using a separate algorithm and is not present in this work.
First, the undeformed region is represented by a finite number of nodes inside its boundaries. The n denotes the total number of nodes. For each node Ni(xi,yi,0) in the flat surface, has the corresponding Ni'(xi,yi,hi) the bulge profile. For each node, the vectors that are normal to the boundary are calculated where m denotes the total number of lines found to be normal to the boundary, as shown in Fig. 3 (a and b). For each jth vector, the corresponding line with the largest angle between the two lines is found. The sum of the two is inputted into the shape function as shown in equation (1) to calculate the intermediate height hj.

Where hj denotes the intermediate height for jth pair, f the shape function, lk the length of the vector lk which pairs lj having the largest angle. To calculate the weights for the weighted summation method, the ratio of Rj is calculated for each jth line. This ratio allows the weights to emphasize the nodes that are closer to edges so that as the node approaches the edges, the height converges to zero. The ratio Rj is calculated using equation (2)

where Rj is a ratio of the larger value between the pairs to the sum of the two. The final weight is calculated based on how much each of the ratios influences the intermediate height. Weights wj for each of the intermediate heights are calculated as shown in equation (3).

Finally, the bulge height Hi is calculated as the weighted summation of the intermediate heights using the calculated weights as shown in equation (4).

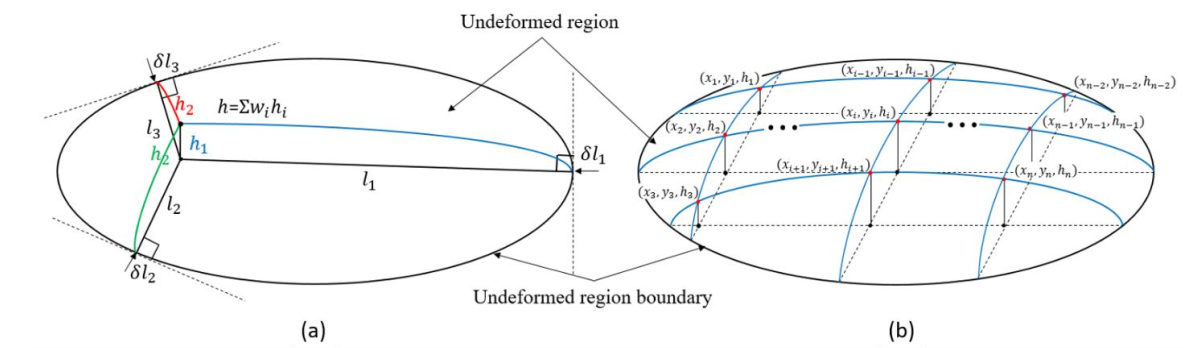 Fig. 3 The diagram of the bulge calculated algorithm based on the weighted summation method
(a) The weighted summation method based on the calculation of the intermediate height values, and (b) discretization of the surface where the height of each node is calculated to obtain the full 3-D profile.
4. Validation
The predicted 3-D bulge profile of the analytical model is compared with that of the experimental measurement. Two cases for the 67° cone, one with 0% squeeze factor and the other with 2.54% effective squeeze, are investigated for model validation. The proposed algorithm is applied using the calculated normalized shape function. The node points within the undeformed region and its boundaries are calculated. The weighted summation method is then applied to calculate the local height at the corresponding location. Once the local height at each node is calculated, the 3-D surface is generated. Figures 4 and 5 show the comparison between the experimental 3-D profile and the modeled 3-D profile for 0% and 2.54%. The result shows that the predicted result is well matching with the experimental bulge profile.
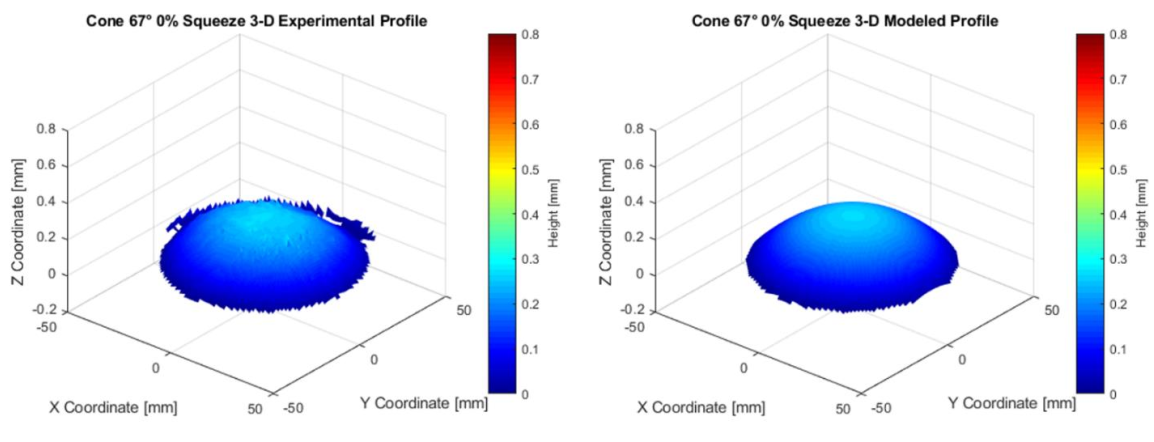 Fig. 4 Comparison of the experimental and modeled 3-D profile for cone 67° 0% squeeze
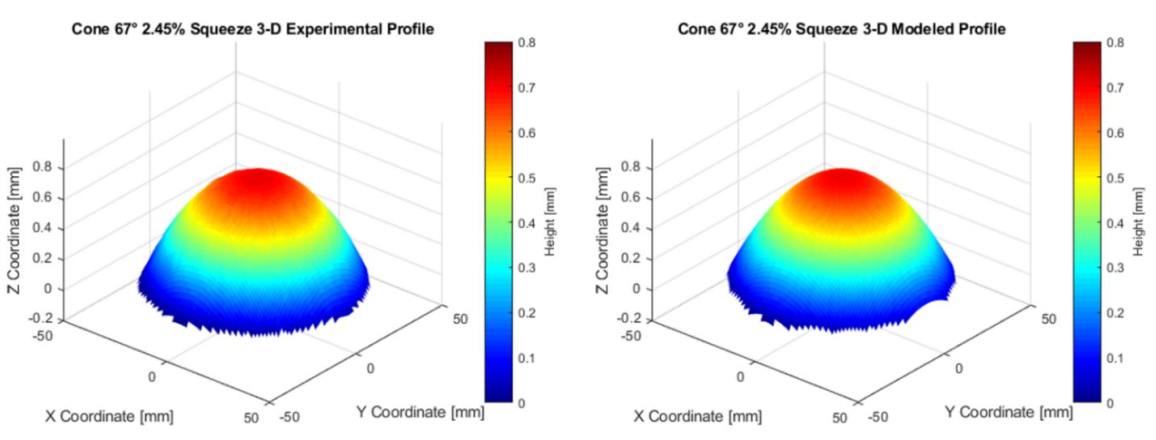 Fig. 5 Comparison of the experimental and modeled 3-D profile for cone 67° 2.54% squeeze.
To show a direct comparison between the experimental profile and predicted profile, the comparison is made between the cross-sectional profile of the surface represented by wireframes as shown in Fig. 6, where the red lines represent the experiment and the blue lines represent the predicted profile. The bulge profile spans from around -50mm to 50mm, and the exact end values differ due to preprocessing of the date where edges with fillets were trimmed off. The maximum height matches very well with the maximum height of 0.2626mm for the 0% squeeze and 0.7109mm for the 2.54% squeeze. The cone with the higher squeeze factor of 2.54% resulted in a higher bulge. The additional squeeze would mean more material is being pushed forward every iteration of the tool revolution. The amount which deviates from the volume conservation would be accommodated in the undeformed section, contributing to the bulge.
Squared error (SE) values were calculated for each node point to check how much the modeled surface deviates from the experimental surface. The SE for 0% squeeze was 0.3860 while SE for 2.54% squeeze was 4.1015. Considering that a prediction that has the maximum height at peak point off by 0.1mm would result in the SE of around 20, and 0.05mm would result in the SE of around 10, the deviation in the predicted results can be considered minimal.
The computational cost associated with the model was less than 5% of running the finite element model, where a typical finite element model of a cone would take around 20hours. In contrast, the analytical model finished within an hour. However, it is possible to increase the number of nodes within the undeformed region, resulting in a higher computational cost.
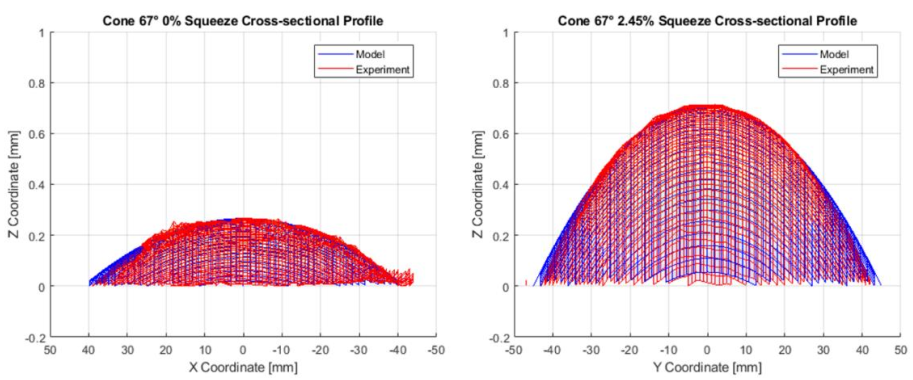 Fig. 6 Comparison of the cross-sectional profile of the surface represented by wireframes where the blue color denotes the modeled surface and red denotes the experimental measurements
5. Conclusion
The geometry prediction in incremental forming plays a vital role in assessing the applicability of the incremental forming and choosing the appropriate process parameters suitable for optimal geometrical accuracy. While the formation of the bulge has been considered less important since most of the interest has been focused on the region where actual deformation is taking place, the bulge formation plays an important role in achieving geometric precision since it is still part of the functional geometry. The conventional method of predicting the bulge based on FEM has proven to be computationally expensive, with there being a trade-off between accuracy and computation cost. The newly proposed analytical model can capture the bulge profile by utilizing the shape function and the weighted summation method. The shape function was obtained by analyzing the bulge profile of the formed part. It was found that the shape function for the 0% squeeze and 2.54% squeeze had an analogous shape function where scaling by a scalar amount would result in the same shape. The geometric constraints around the undeformed region seem to impact the shape function, and future work will be conducted further to prove the relation between shape function and geometric constraint. The validation was conducted on two different 67° cones, 0% squeeze, and 2.54% squeeze. The 3-D profile comparison of the modeled prediction and experimental measurement was well matching with minimal error. The squared error analysis suggests that both predictions had less than 0.05mm difference in the bulge height. The model provided prediction with less than 5% of the computational cost of that of the FEM model.
Acknowledgments
This research was funded by DOD-ONR N00014-14-20002-LIFT 0007A-4 through the American Lightweight Materials Manufacturing Innovation Institute(LIFT). Also, special thanks to Boeing (Dr. Ravi Verma) for supporting this research.
