1 Introduction
Products obtained via SuperPlastic Forming (SPF) have very good characteristics, due to the almost total absence of spring-back, which determines high shape accuracy. However, compared to conventional forming processes (i.e. stamping), SPF is quite expensive in terms of both energy consumption (elevated temperature are necessary to manufacture the components) and characteristic cycle times (superplastic properties occur at very low strain rates) [1]. But, irrespective to such drawbacks, SPF is attractive due to its ability to allow the manufacture of very complex shapes in a single step, thus eliminating or drastically reducing assembly and or stamping steps, thus allowing a comprehensive cost reduction. Furthermore, if materials such as the so-called "light alloys" (Aluminum, Titanium and Magnesium alloys) – notoriously poorly formable at room temperature – are used, the high temperatures at which they must be worked represent a cost, in any case, due. In addition, when high deformations are required, large thinning may characterize the component, thus limiting its functionality or affecting the total weight (thicker blanks are necessary to fulfill requirements on the minimum required thickness of the component). The adoption of materials such as Ti and Mg alloys for biomedical purposes pays particular attention to the issue linked to the thickness of the prosthetic implant; in fact, this aspect becomes of fundamental importance for the final characteristics of the implant, which must not be excessively rigid and, therefore, reduce osseointegration through stress shielding effects (Ti alloys) and have a thickness such as to guarantee its bio-absorbability in a controlled manner (Mg alloys). For this reason, the thicknesses must be accurately controlled for the implant to fully perform its repairing function [2,3].
Different methods exist able to avoid excessive thinning after the forming process: (i) direct and reverse bulging; (ii) movable male die assisted forming [4]; (iii) preforming sheets by different approaches [5,6] just to name a few of them.
In this scenario and among the other light alloys, Mg alloys appear to be very attractive for several structural and biomedical applications due to their very competitive strength/weight ratio, which is also quite close to those of the human bone [7]. As anticipated, Mg-based metals, including pure Mg and its alloys, are becoming increasingly popular in the medical industry due to their biodegradability [8]. The actual limitation of the use of Mg and its alloys is mainly due to its mechanical and deformation properties. Fortunately, despite the low formability at room temperature resulting from Hexagonal Close-Packed (HCP) crystal structure which has a low number of atomic slip planes, as temperature increases, additional slip systems and deformation mechanisms become active [9], thus improving the formability [10] and drastically reducing spring-back phenomena [11]. In such a way a drastic increase of the material deformation properties can be obtained [12,13]. In addition, Mg and its alloys show superplastic properties that are likely to be employed industrially.
A robust design of the manufacturing process, in particular if the thickness of the component has to be properly designed, necessarily involves the adoption of the Finite Element (FE) approach, since the correct prediction of the deformation behavior under specific process conditions (i.e. temperature and strain rate) play a key role in the process design [14]. Despite various constitutive models able to catch the deformation behavior of the AZ31B Mg alloys at high temperature are available in literature, few considers the microstructural changes undergone by the material during the manufacturing process.
To summarize, the adoption of localized heat treatments aimed at the microstructural modification of a material before it is processed to obtain the final component is a very promising method; however, in order to optimize both the heat treatment parameters and the areas to be treated, an integrated numerical/experimental approach is essential. Considering this aspect, in the present work, the attention was focused on the effects of a selective Laser Heat Treatment (LHT) applied to a commercial AZ31B-H24 Mg alloy sheet before their deformation under superplastic conditions (bulge tests at 450°C and by applying an argon gas pressure equal to 0.7MPa) [15]. Results could be thus obtained in terms of dome height vs time, thickness distribution; in addition, the microstructure of both the undeformed sample (after the laser heat treatment) and the bulged one was investigated in order to analyze the microstructure evolution. Bulge tests using laser heat treated samples were also simulated adopting the material constitutive model proposed by Carpenter et al. [16] and implementing the grain size distribution experimentally measured.
2 Material and methods
2.1 Investigated Magnesium alloy
Specimens for experimental trials were obtained by cutting a single AZ31B-H24 Mg alloy sheet with an initial thickness equal to 1mm. The chemical composition of the investigated alloy is proposed in Table 1.
Table 1. Mg alloy AZ31B-H24: Chemical composition limits [Weight %]
![Table 1. Mg alloy AZ31B-H24: Chemical composition limits [Weight %]](docannexe/image/1555/img-1.png)
2.2 Experimental method
The heat treatments were conducted by adopting a diode laser (wavelength equal to 980nm) with 1kW as maximum power and a square spot (100mm2). The laser was assisted by a pyrometer capable of modulating the power ensuring a constant temperature value on the sample.
Two different temperature conditions were investigated (400 and 450°C) setting the dwell time to 10s. During the heat treatments, the spot was kept stationary in the central area of a circular sample (diameter: 75mm). A schematic of the heat treatment unit is proposed in Fig. 1a.
Subsequently, bulge tests were conducted on samples in both As-Received and pre-treated conditions using the experimental setup shown in Fig. 1b. The whole equipment was heated using a shell oven. To acquire the temperature and the dome height during the tests, a K-type thermocouple continuously in contact with the center of sample and directly connected to a magnetostrictive linear position sensor was used.
Bulge tests were conducted under superplastic conditions [17,18] at 450 °C with a gas Argon pressure of 0.7MPa; tests were stopped when the dome height was equal to the die cavity radius (22.5mm), thus avoiding any contact with the bottom part. Two replications were performed.
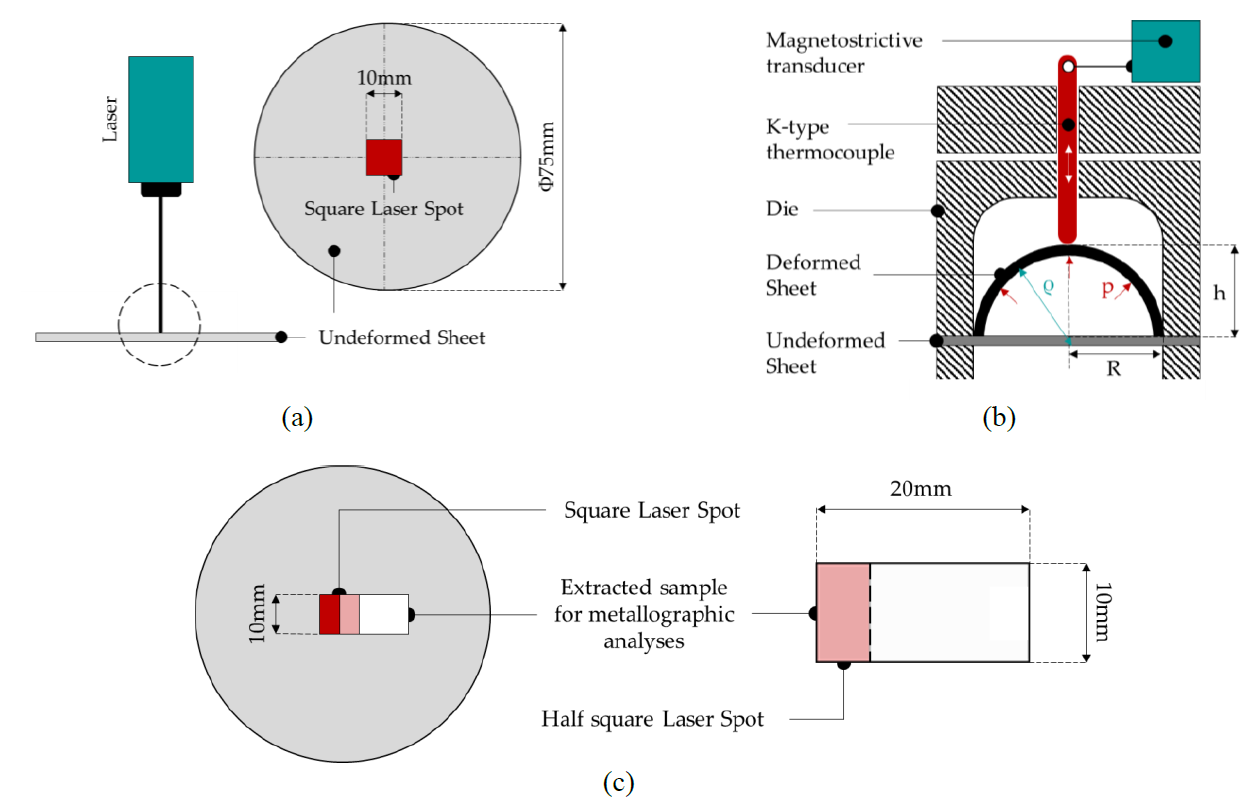
Fig. 1 Scheme of the experimental setup adopted to perform selective Laser Heat Treatments (a), Bulge tests (b) and the extraction of the sample for metallographic analyses (c).
The microstructure evolution after the laser heat treatment was observed – after each experimental condition – by means of a light microscope (Nikon AZ100M). For this scope, each sample for the metallographic observation was extracted by the heat-treated specimen as shown in Fig. 1c (the surface of the sample was analysed instead of its transversal section), mounted, properly grinded without any adoption of water to prevent corrosion or oxidation of the sample and etched by immersing the sample for 5 sec in Acetic-Picral (5 mL Acetic Acid, 6 g Picric Acid, 10 mL Water, 100 mL Ethanol). In particular, as schematized in Fig. 1c, 20mm long and 10mm wide samples were extracted by the central area (in correspondence of the spot laser) starting from the center. The mean grain size (MGS) was evaluated according to the ASTM Standard [19].
2.3 Numerical modeling
Thanks to the symmetry of the adopted setup, the 2D axial-symmetric model shown in Fig. 2 was created using the commercial finite element software ABAQUS. The non-axial-symmetric effect of the squared laser spot on the blank was neglected.
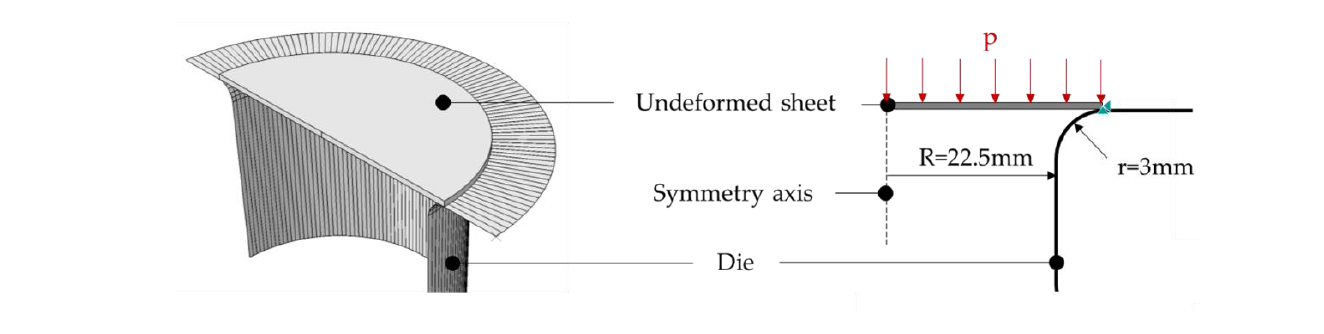
Fig. 2 Scheme of the FE model adopted to simulate bulge tests (a) and grain size distributions implemented in the numerical simulation (b).
The cylindrical die cavity and the sheet were modeled as rigid and deformable, respectively. The undeformed sheet, encastred at the periphery in order to simulate the blank holder action, was meshed with 0.2 mm 4 nodes axisymmetric elements. A uniformly distributed pressure was applied on the upper part of the sheet for simulating the action of the argon gas. A friction coefficient of 0.1 was adopted.
The grain size distributions along a radial path experimentally obtained were associated to the undeformed sheet and implemented in the numerical simulations, directly implemented in a FORTRAN subroutine. In the same subroutine the material model proposed by Carpenter et al. [16], capable to predict the grain growth, was implemented; the constants obtained in the same reference were used for the present work, except for the initial grain size (d0). Finally, the effect of anisotropy was not considered in the present work.
3 Results and Discussion
The micrographs obtained for both treated samples show a significant variation in the mean grain size, passing from the not-affected zone (in the as-received condition) to the center of the treated circular sample. Considering also de As Received condition, the three different microstructure in the center of the circular undeformed sheet are compared in Fig. 3.
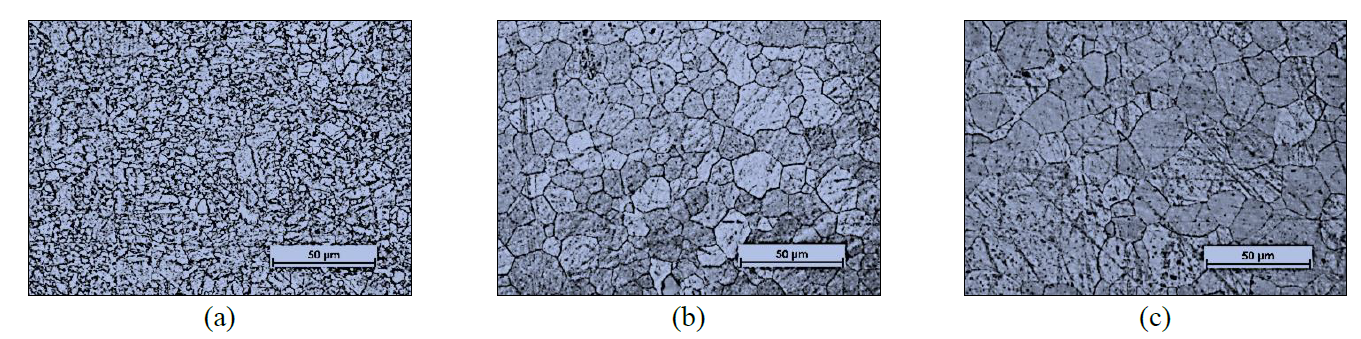
Fig. 3 The obtained micrographs referred to the As-Received condition (a), LHT at 400°C (b) and 450°C (c).
The effect of the laser heat treatments appears rather marked from the comparison with the initial condition, in which an average grain size of 7.73mm was calculated [19]. The maximum grain dimension is equal to 12.76 and 17.92μm for the heat treatment performed at 400 and 450°C for 10s, respectively. The grain size distribution obtained from experimental laser heat treatments are depicted in the graphs of Fig. 4. As it is possible to see, the effect of the laser heat treatment conducted setting the target temperature to 450°C was more pronounced; in fact, the curve concerning the treatment at a higher temperature - at least considering the affected area - is constantly above the one obtained setting the temperature to 400°C. At the same time, considering the same dwell time (10s), the extension of the affected zone increases with the temperature (12.4mm at 400°C and 16.4mm at 450°). The experimental grain size distribution was fitted using a sixth-degree polynomial curve (R-square value larger than 0.994).
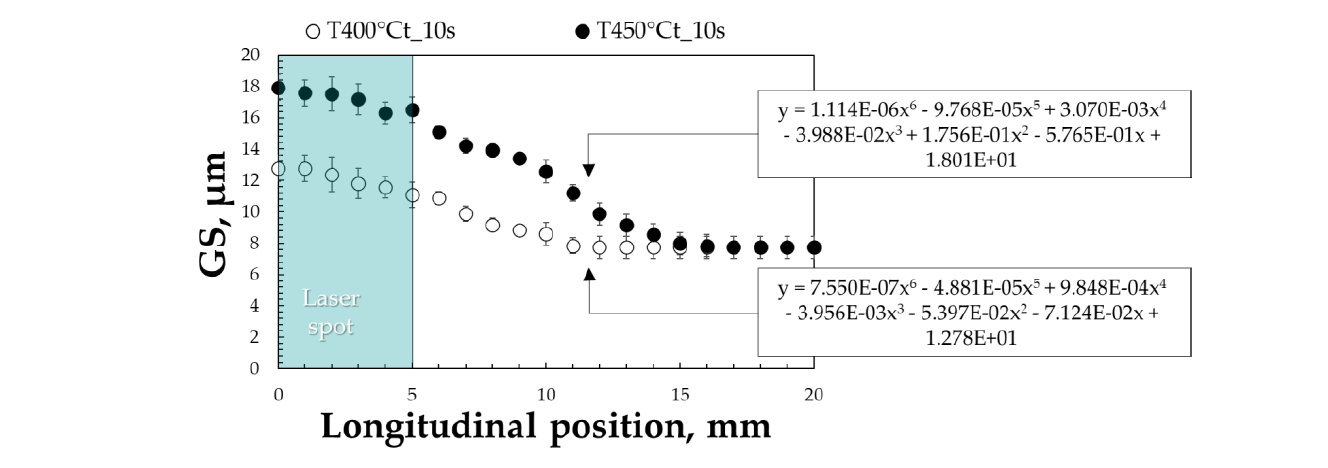
Fig. 4 Grain size distribution obtained after the laser heat treatments performed at 400°C (a) and 450°C (b) for 10s.
Experimental results from bulge tests are reported in the Fig. 5 in terms of dome height vs time and thickness distributions along the radial path. Considering the viscoplastic behavior of the material during the test, the dome height evolution with respect to the forming time is capable to highlight how the material, subjected to the same level of pressure, changes its way of deforming, with particular reference to the strain rate.
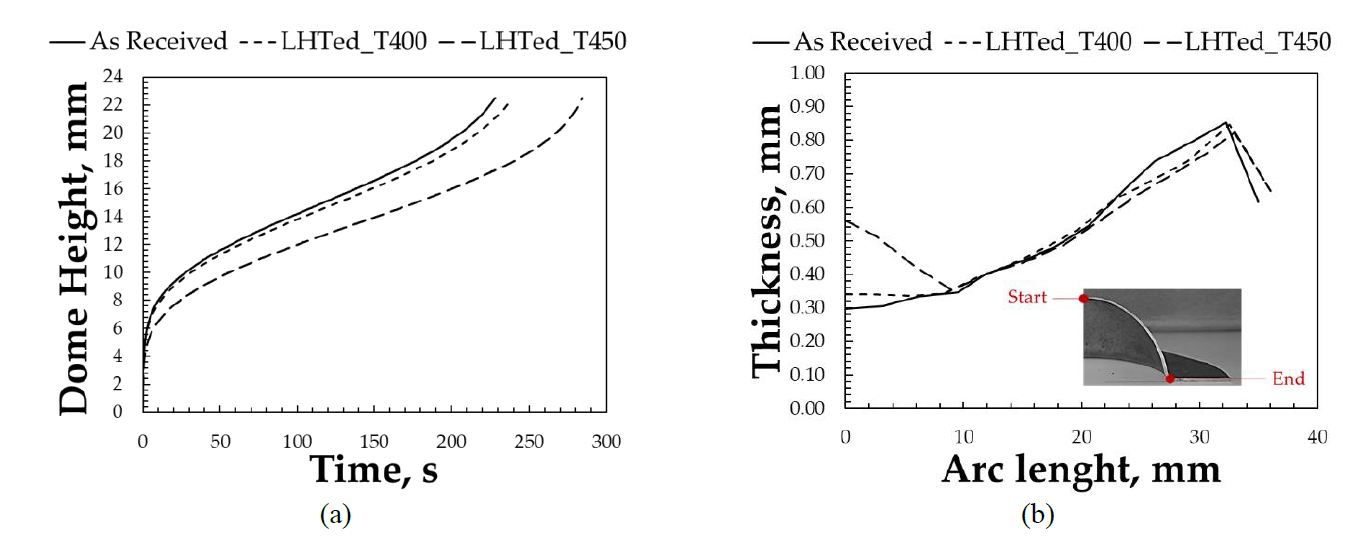
Fig. 5 Bulge tests results: dome height vs time (a) and thickness distribution (b).
By comparing the dome height evolutions according to time, it is possible to observe that the heat treatment causes a lowering of the curves as the treatment temperature increases. As a consequence, the final height of 22.5mm was reached at different times: 228s for the As-Received condition, 239s for the LHTed at 400°C and 284s for the LHTed at 450°C.
By comparing the thickness distributions along the radial direction (arc length is zero at the dome) it is possible to observe a change in the overall distribution: a greater thickness is measured in both the laser heat treated samples. This behavior is much more evident for the treatment carried out setting the target temperature to 450°C, which is characterized by a thickness of 0.56mm at the dome apex, much larger than both the thickness of the sample heat-treated at 400°C and the As-Received one (0.34 and 0.31mm, respectively).
Numerical results are compared to the experimental ones in in Fig. 6 and Fig. 7 in terms of dome height evolutions and thickness distributions. It is worth noticing that the implemented material model allows to predict the modification of the material response when a localized heat treatment is conducted, but the matching (especially in terms of dome height evolutions) is not excellent.
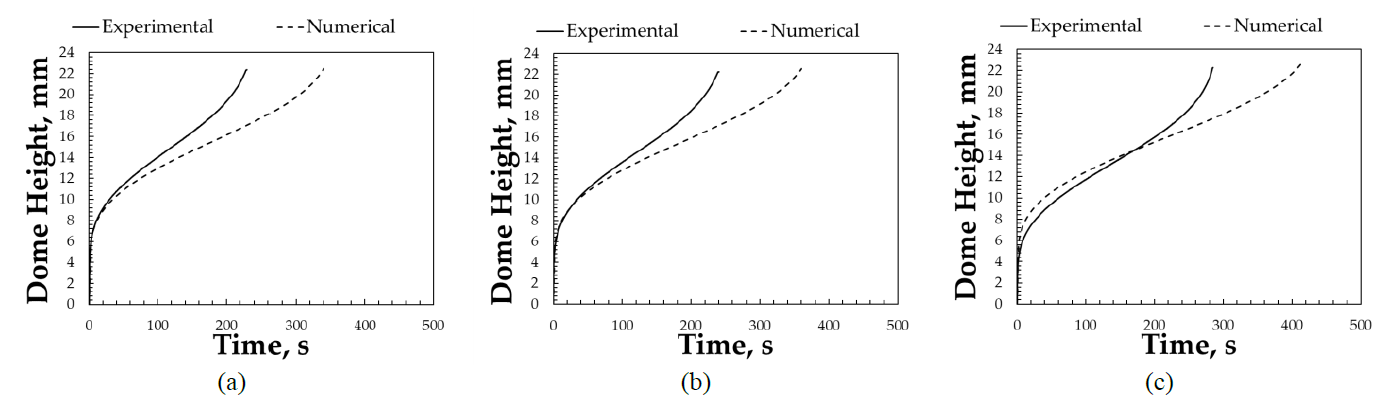
Fig. 6 Dome Height comparisons for the As-Received conditions (a) and the LHTed conditions at 400°C (b) and 450°C (c).
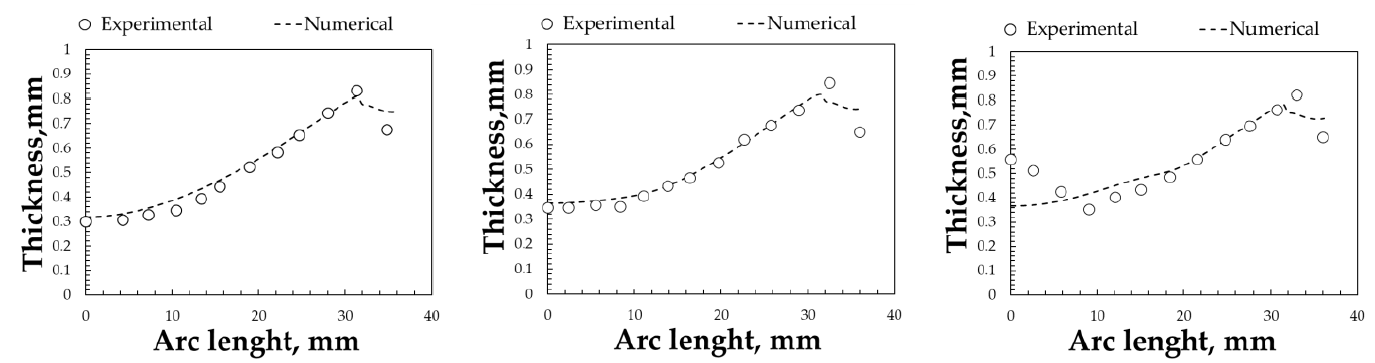
Fig. 7 Thickness distribution comparisons for the As-Received conditions (a) and the LHTed conditions at 400°C (b) and 450°C (c).
In order to quantify the discrepancy between the results deriving from FE analyses and the ones obtained by the experiments conducted, for both variables adopted as output for the analyses (dome height and thicknesses) the mean absolute percentage error (MAPE), was calculated. MAPE was assumed as indicator of the accuracy and is defined by the following equation:

where xi and yi are respectively the experimental and the numerical values related to the time (for the dome heigh) or to the arc length value (for the thickness distribution); while n represents the number of measures considered. The obtained values of MAPE are listed in Table 2.
Table 2. Discrepancy between numerical and experimental results in terms of Dome height and Thickness distribution expressed as MAPE.

The MAPEs calculated show a more accurate prediction of the model for the test conducted on the sample treated at 400°C for 10s. MAPE referred to the dome height ranges from 0.816 (LHTed at 400°C) to 0.0928 (As Received condition); as regards the thicknesses, MAPE varies between 0.817 (LHTed at 400°C) to 0.1578 (LHTed at 450°C). If the discrepancy in terms of dome height registered is comparable among all the investigated conditions, the worst condition of thickness distributions is related to the test conducted on the sample treated at 450°C for 10s, in which a great discontinuity of the thickness was experimentally found in the central zone. Such a discrepancy highlights a limit in the material model adopted, which would require a more extensive characterization for the specific alloy to better predict the rheological behaviour combined with the microstructural changes due to both the pretreatment and the temperature at which the forming process is conducted. As known, several phenomena – such as dynamic recrystallization – concur in the Mg alloys during the forming process at elevated temperature; all these phenomena could affect the material behavior [20]. Such a discrepancy highlights a limit in the material model adopted, which would require a more extensive characterization for the specific alloy to better predict the rheological behaviour combined with the microstructural changes due to both the pretreatment and the temperature at which the forming process is conducted. In addition to the previous analyses, experimental and numerical results in terms of grain size related to the final forming step for the three different samples are shown in Fig. 8.
The experimental results show an almost identical microstructure in the flange area for all the samples considered; this evidence is certainly consistent with what was expected, since - at least in the peripheral area - the three samples are basically equal to each other in terms of grain size. in fact, in the flange the values of grain size range from 11.36 (for the As Received condition) to 12.20 (LHT al 450°C for 10s). On the contrary, considering the dome apex region, in all the analyzed cases it is difficult to quantify an average size of the grain in a reliable way: an abnormal grain growth occurred, as depicted in the micrographs.
To better understand what is, albeit approximately, the size of the grain after forming in the dome apex, it can be considered that the length of the micrograph is equal to 250.
This result was confirmed from the same Carpenter, which showed an excessive grain growth after carrying out tensile tests at a constant strain rate of 0.03s-1 (comparable to the equivalent strain rate value adopted in the present work) [21].
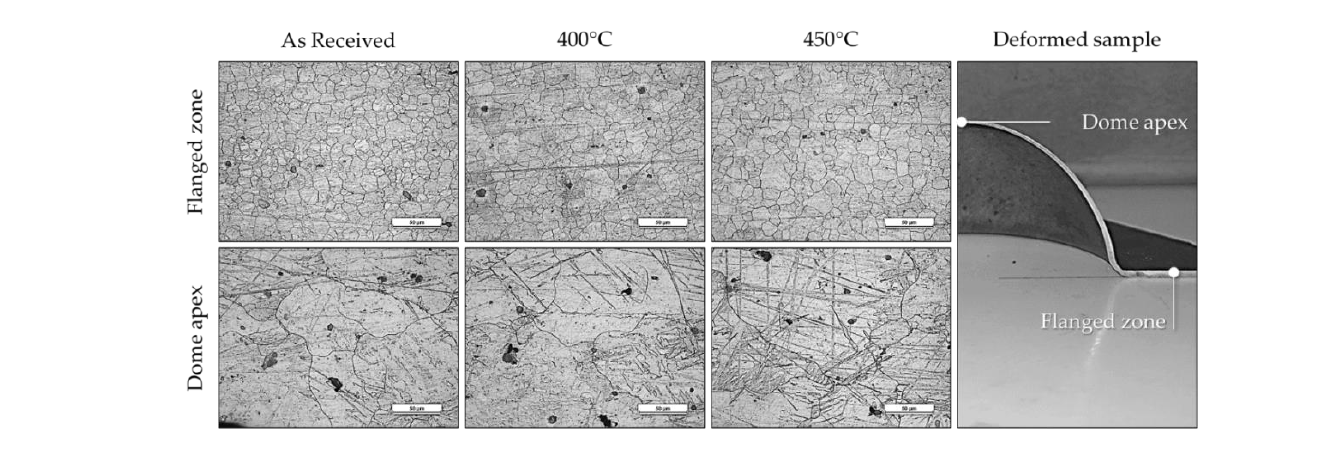
Fig. 8 Micrographs obtained for the three different conditions analyzed in correspondence of the flanged area and the dome apex.
From a numerical point of view, instead, as highlighted by the contour plots in Fig. 9b, the maximum grain size (31.13μm) can be associated with the heat-treated condition at 450°C; with reference to Fig. 4, this was also the condition for which the maximum grain size was recorded in the central area of the undeformed sheet. These observations confirm what was previously reported: the model adopted requires a larger number of experimental data with which to better calibrate the model. A grain size equal to about 12μm was recorded in the flange for all the conditions; in addition, in correspondence of the dome apex a dimension of 19.83 and 22.99μm was determined respectively for the As Received condition and the LHTed sample at 400°C. As the heat treatment temperature increases, the area most affected by significant grain growth extends towards the periphery of the sample.
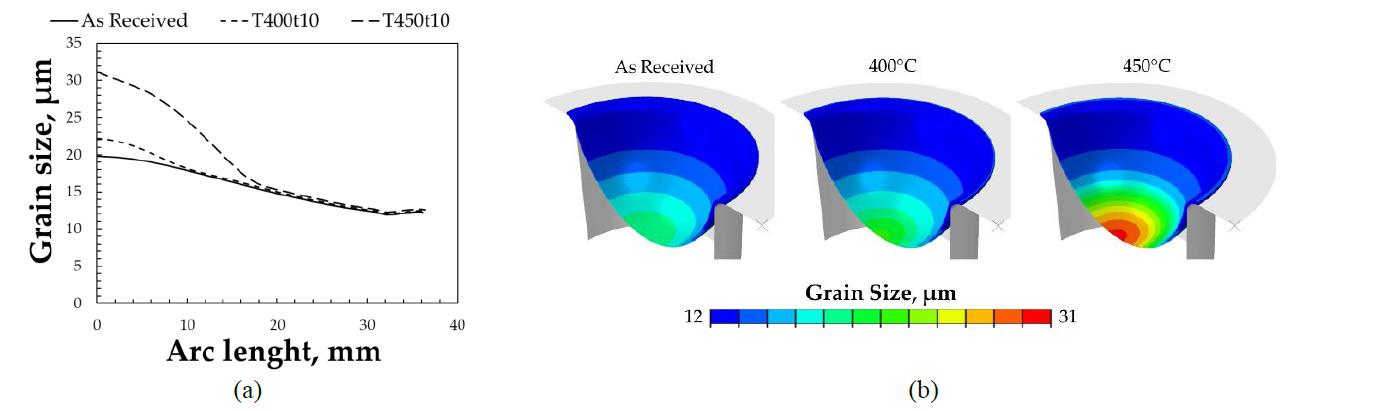
Fig. 9 GS distributions (a) and contour plots (b) for the three different conditions analyzed.
4 Conclusions
Considering the commercial AZ31B-H24 Mg alloy, the present work aims at evaluating the capability of a selective laser heat treatment to modify the microstructure of the sheet prior to a superplastic forming process at 450°C. In addition, numerical simulations were performed replicating the same conditions proposed experimentally to evaluate the capability of the model proposed by Carpenter et al. [16] to predict the deformation behaviour of the alloy under superplastic conditions, considering the microstructural evolution.
The proposed experimental approach locally modified both the microstructural and deformation properties of the investigated material. In fact, considering that the average grain size in the As Received condition was equal to 7.73μm, the selective laser heat treatment proved to be able to increase - in the area affected by the laser spot - this size even with a short laser-blank interaction time: a maximum value equal to 17.92 and 12.76μm for treatments carried out respectively at 450 and 400 ° C for 10s were reached, showing a percentage increase of 131.8 and 65.1% with respect to the mean grain size in the As Received condition. At the same time, considering the bulge tests conducted with a pressure of 0.7MPa, these microstructural variations determined a deformation response different from that associated with the As Received condition: a dome height of 22.5mm is reached much more slowly when the material is pre-treated at 450°C.
From a numerical point of view, results showed a certain capability of the model to predict the deformation behaviour of the alloy; in fact, despite the effect of the anisotropy was not considered, the mean absolute percentage error regarding the thickness distribution varies between 8.2 % (400°C) and 15.8% (LHTed at 450°C for 10s). On the other hand, the errors regarding the evolution of the dome height according to the forming time are mutually comparable for the three conditions evaluated: in this case, the MAPE ranges from 8.2% (LHTed at 400°C for 10s) and 9.0% (As received condition). Although the material model predicts a change in the grain size, this can only be valid when considering the flange area. No comparison can be made regarding the dome apex area subjected to the maximum stresses.
The results of the present work represent the first step in order to optimize the proposed approach and make it applicable also for the industrial cases manufacturing. Furthermore, although the errors recorded are not excessively high, possible developments will aim at modifying the proposed model to make it more fitting to the specifications of the alloy investigated (an extended characterization activity could be useful); among other things, the use of anisotropy could reduce the value of the error obtained in the present work. Finally, the proposed approach - once improved - it can be applied to manufacture a more complex case study (of industrial interest).
Acknowledgements
This work was supported by the Italian Ministry of Education, University and Research under the Italian National Operational Programme Research and Innovation 2014-2020 (Project “CONTACT”).
