1 Introduction
Polymer coated steels are used in the packaging industry to produce cans. They hold many advantages, such as protection of the metal against the relatively aggressive filling goods, good formability and no solvent emissions in the processing route. Deformation in metals causes roughening, which has a direct influence on the appearance, weldability and lubricant transport. In the literature, numerous articles can be found on the influence of strain, grain size and texture on the roughness development. In several investigations, a linear relationship is found between roughness and grain size [1-3]. However not in all investigations a linear relationship was observed, especially not at higher strains [4].
Surface roughening is studied at several deformation modes, such as for example bi-axial stretching [2,5] and uni-axial [1,2] deformation. In some investigations an effect was observed by the type of deformation [5], while in others this was not the case [2,6].
Grain rotation is found to be the most important source of surface roughness [3,5]. A study by Tijen et al. [7] showed that the roughness of the polymer surface under uni-axial strain is caused by the roughening of the metal substrate and that the thickness and the mechanical properties of the polymer layer are important.
The product performance is affected by deformation and the minimum coating thickness plays an important role. Boelen et al. [8] studied the product performance of these polymer coated packaging steels extensively. The authors investigated several effects on the corrosion performance of the can and observed a strong effect of deformation on corrosion performance.
The production process of a can consists of several steps, which all contain their own deformation mode at free or confined spaces. In the literature most attention is paid on the roughness development during free surface deformation. The roughening of the surface during confined space deformation, such as occurs in the ironing step is less straightforward.
The aim of this paper is to investigate the influence of the grain size of the steel substrate on the surface roughness during the production process of a can. A complete overview of the roughness development during a the can making process for two materials with distinct grain size is made at several process steps, several heights, in and outside and 0 and 90° to rolling direction. Special attention is paid to the effect of grain size on the minimum polymer-coating thickness layer, since this could have an effect on the corrosion performance.
2 Materials and methods
2.1 Materials
Cans are made from steel materials coated with the same polymer layer (Protact®). The two materials have significantly different material properties and grain structure, see Table 1 and Fig. 1.
Table 1. Material information

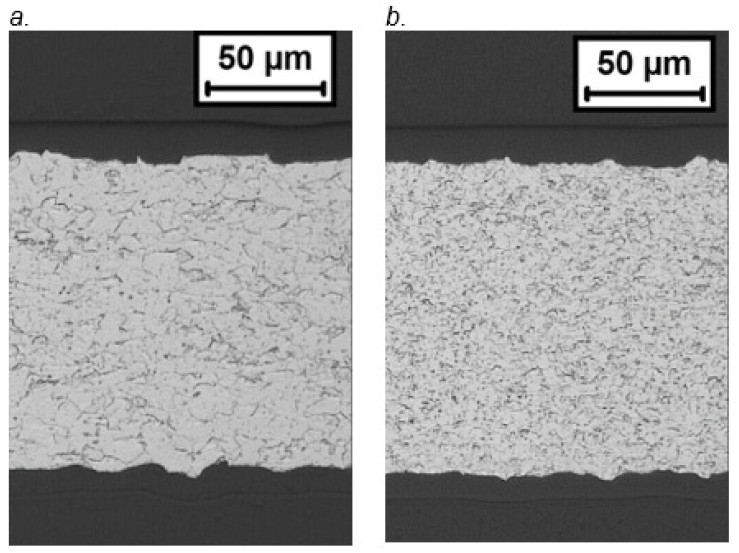
Fig. 1. Microscopy of cross section 45 mm from cup bottom after 2nd ironing ring of materials a. TH340 and b. TH415
2.2 Can making process
The draw and wall ironing (DWI) process consists of several steps, namely cupping, redrawing, 1st ironing and 2nd ironing. Fig. 2 shows the products after the several steps. To present a complete overview of the roughness development during DWI process of Protact®, samples are taken out after each process step.

Fig. 2. Photograph of several steps during can making
Table 2 incudes observations from the can making production process. Both materials show scuffing, which is severe scraping of the polymer coated can wall during production. In practice several options exist to prevent scuffing, but the cans in this investigation were deliberately produced on the process limits. Higher forming forces and a higher ironing reduction (locally) was observed for the TH415 material compared to the TH340 material. Lüder lines were also observed during deep drawing of material TH415. Lüder lines result in local thickening and could be in theory disadvantageous for scuffing of the coating due to local stresses in the polymer.
Table 2. Production results

2.3 Topography measurements
The surfaces of the cans after several process steps are analyzed to investigate the surface roughening during the process. Three dimensional topographical measurements are performed with the nanofocus μsurf mobile confocal microscope at several heights corresponding to several strain/reduction levels. To be able to measure the Protact® layer, a thin layer of gold was sputtered on the surface. To measure the substrate, the Protact was chemically removed. The substrate and Protact layer are measured at the same position.
The measurement size of the topography measurements is 3.48 x 1.47 mm. The confocal measurements are processed in Mountains software. At first, a form removal was applied. Secondly, a threshold value is applied to remove outliers. The outliers are not filled and remain in the figures as non-measured points. Thirdly, an area of 1 x 1 mm is extracted for a 3D image of the surface.
3 Roughness development
A huge amount (152) of topography measurements are performed. In Section 3.1 the roughness development during the process steps is discussed. In the following sections attention is paid to the differences between Protact® and substrate (Section 3.2) and the two materials with distinct grain sizes (Sections 3.3). In general, differences between the topography at 0 and 90 º to rolling direction is small. Therefore, the results are all presented parallel to rolling direction. During the process, the difference in topography between out and inside of the substrate is relatively small and the same roughness development occurs during the process. The inside has often a slightly higher Sa (arithmetical mean height) than the outside, probably due to the deformation history. A huge difference occurs between in and outside during the ironing steps for the Protact layers, which could be related to the difference in temperatures and deformations between the two sides.
3.1 Influence of process on roughness
The process steps consist of cupping, redrawing, ironing 1st ring and ironing 2nd ring. Fig. 3 show the roughness development of the Protact® layer of material TH340 and TH415 during the process. Fig. 4 shows the roughness increase of material TH340 during the process. After each process step the roughness is measured at several heights on the product. These heights experienced different amounts and types of deformation.
During cupping plastic deformation causes stresses in the substrate and polymer. Grains are tilted and grains at the surface move out of their plane. As expected, the roughness increases during cupping for all materials, in and outside and different heights. The polymer is bonded with the substrate and is therefore forced to follow the underlying substrate during deformation. The stresses can be equalized by the polymer, by sliding of the polymer molecules along each other.

Fig. 3. Topography material TH340 (top row) and TH415 (bottom row) Protact® layer inside 0° to rolling direction

Fig.4. Sa value for several process steps and heights (mm) for material TH340
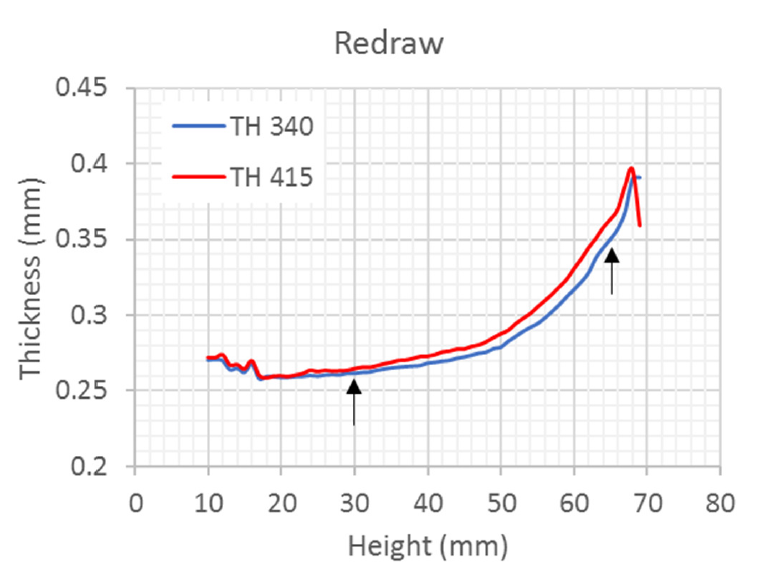
Fig.5. Thickness measurement after redrawing. Position of topography measurement indicated by black arrows
The cup diameter is reduced to the can diameter in the redrawing step. The side wall of the redraw cup is stretched. The thickness increases with the height of the cup. Different heights in the side wall experienced different amounts and types of deformation. The roughness development is related to deformation and therefore more or less roughening can be expected. The first measurement point at 30 mm height has a lower thickness than the second measurement point, see Fig.5. The second point at 65 mm has a higher thickness as the original material and experienced less tensile strain, however more total strain.
The roughness of the substrate increases with height and during the first two process steps (deep drawing and redrawing), if the position of the measurement is taken into account. The position of 10 mm cup corresponds approximately to the same material as the position of 30 mm redraw. This is in line with literature, for example [9] showed a roughness increase with the height of the cup after drawn and redrawn.
The wall of the cup is ironed to the final can thickness with two ironing rings. The effect of ironing on the topography is not very straight forward and several effects are observed. For the Protact® layer a large difference occurs between in and outside, which could be related to the higher temperatures and the larger deformation occurring on the outside coating. Van der Aa [10] calculated a 32°C higher temperature in the outside of the PET layer than in the inside of the PET layer with a thermo mechanical simulation of the wall ironing process. Ironing results in a very large decrease in roughness for the Protact layer on the inside, see Fig 3. This is often observed in the production of cans. Remarkable is that for material TH340 the Protact layer shows roughening in the 2nd ring, which could be related to some recrystallisation or other temperature related behavior of the Protact layer. This aspect needs further investigation.
After the second ring scuffing occurs on the outside, see Fig. 6. Scuffing is the severe scraping of the polymer coated can wall during deformation. Scuffing is related to the temperature. Due to its higher strength the temperature of the TH415 material shows a larger temperature increase during the process which causes more severe scuffing in the second ironing step. Cross sectional analysis revealed that the scuffing occurs in the main layer and between probably the main and adhesion layer. In no position complete removal of the polymer layer is observed. Scuffing is not acceptable and can be prevented by several means.

Fig. 6. Scuffing after second ironing ring. Optical cross section and topography measurement TH415
3.2 Protact® versus substrate
Protact has in general a lower roughness than substrate during the process, see Fig 7. In the drawing and redraw step, the Protact layer follows the substrate roughness since it is bonded and forced to follow the underlying substrate during deformation.
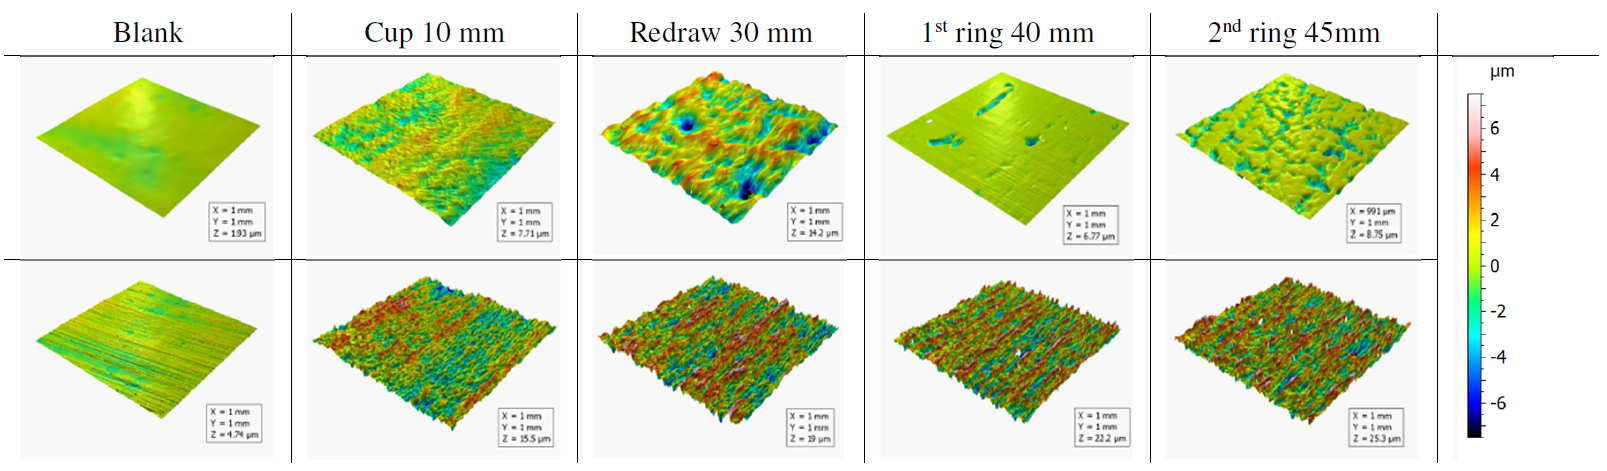
Fig. 7. Topography Protact® (top row) and substrate (bottom row) at several process steps TH340 inside 0° to rolling direction
The Protact® layer has a completely different behavior in the ironing step than the substrate (especially on the inside). During the ironing step, the Protact layer does not follow the substrate roughness on the inside. In the ironing step the freedom of the roughness development of the material is limited due to the confined space. On the inside, ironing results in a very large decrease in roughness for the Protact layer. This is often observed in the production of cans.
3.3 Grain size
It is well known that the substrate material (grain size) has an influence on the roughness development during can making. Roughening during the cupping and redrawing is caused by tilting of grains. Therefore, a smaller grain size results in a lower roughness. The Protact® layer roughness increase is in general higher for material TH340 than for material TH415, due to the larger grain size of the TH340 substrate material. The Protact layer follows the substrate. The Protact layer of material TH415 shows no obvious increase in Sa value between 30 and 65 mm in the redraw step. This could be related to other roughness developments such as the Lüder lines.
The influence of the grain size in the deep drawing and redrawing is straightforward and completely as expected. However, during ironing this is not the case and some remarkable observations were made. During ironing, the two materials show different behavior. On the outside the roughness of the substrate remains approximately the same for material TH340. However, the roughness of substrate TH415 outside increases during the first ironing step, which is unexpected. A new sample of TH415 for the 1st ironing ring should be measured.

Fig. 8. Sa roughness at several steps in process for TH340 (blue) and TH415 (red) for substrate outside
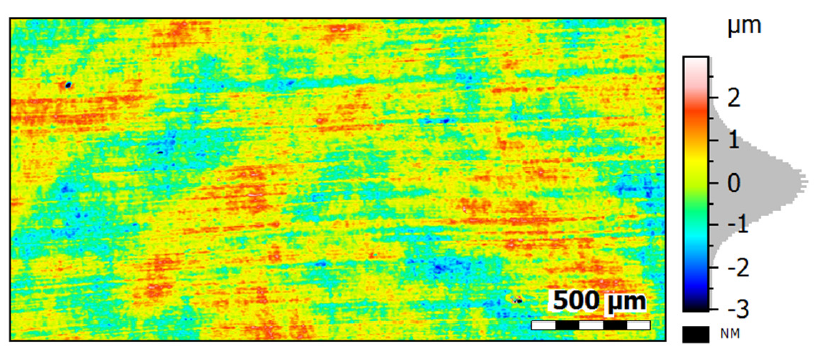
Fig. 9. Topography measurement TH415 outside substrate. Lüder lines visible
4 Minimum coating thickness
The Protact® layer thickness is important with respect to corrosion performance. From the optical cross sections (at three heights) the minimum local thickness is measured on the inside of the can, see Fig 10. At all three heights the minimum local thickness is lower for material TH340 than TH415 due to the larger grain size of TH340. The larger grain size in combination with the rotation and tilting of grains during deformation results in a lower minimum thickness of TH340. The difference in minimum thickness between the two materials is approximately 3 to 4 μm. The effect of such a difference in minimum Protact layer thickness on corrosion performance should be investigated.
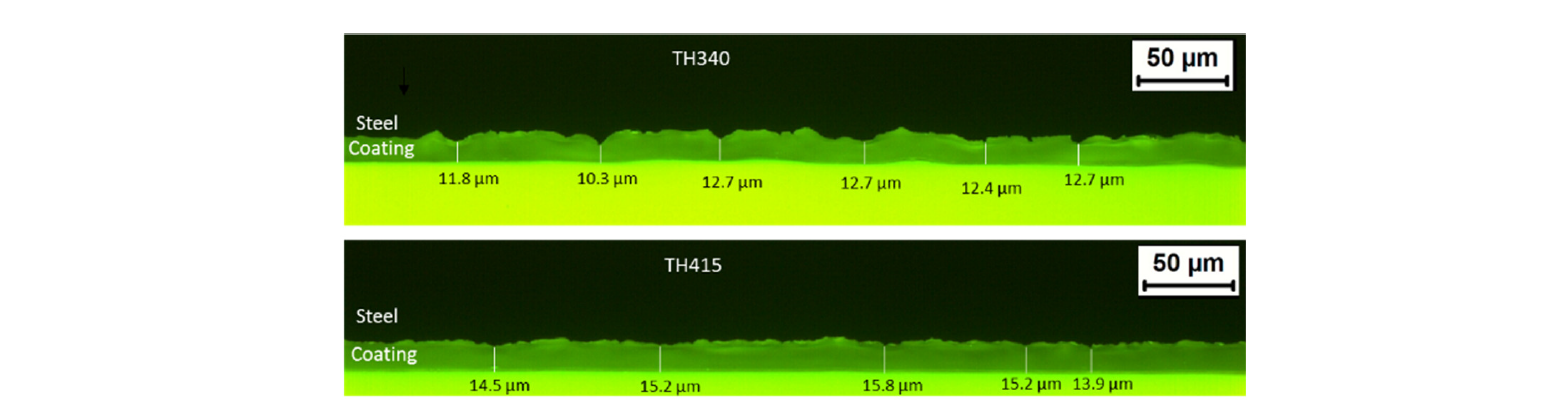
Fig. 10. Cross section of can to determine minimum coating thickness
5 Conclusions & recommendations
Material TH340 (larger grain size; ASTM 10) has a higher roughness increase than material TH415 (ASTM 12.5). A smaller grain size results in lower amount of roughening. The roughness development causes a lower minimum coating thickness on the inside of the can for material TH340 (approx. 3 -4 μm).
The roughness development during drawing and redrawing is straightforward and relatively well known, which is less during ironing. After ironing, large differences in roughness occur between the in- and outside due to temperature and deformation differences. The rising temperature during the process could result in some recrystallisation or other temperature related behavior of the coating layer. The temperature related behavior of the coating layer during the ironing step needs further investigation.
Using a different material (different grain size) has large effects on other aspects of DWI canmaking which cannot be disregarded, such as the deep drawing ratio, blank holder load, chime wrinkling, wall ironing load and necking. Therefore an in-depth understanding of the DWI process is necessary to make the right material choice for each application with the required performance.
