1 Introduction
Grain size evaluations are probably the most important microstructural measurements performed, for either quality control or research purposes. A material grain is a three-dimensional feature, but, in most cases, it is viewed as a two-dimensional feature, measured by different methods after a chemical etching. This is the reason why most measurements are of a planar rather than a spatial nature and numerous approaches have been developed to reverse a planar data into a spatial estimation of grain size [1,2]. The main physical, chemical and mechanical properties of the material are governed by the grain size that the material has at room temperature, which depends fundamentally on the process chain used to manufacture the components. It is well known that the lower the grain size the higher the metal strength at room temperature, according to the Hall-Petch’s relationship [3,4] and that having a grain refinement until values between 100 and 1 µm could be extremely beneficial for obtaining an improvement in the mechanical properties of the material, with positive effects for example on the yield strength and ductility.
The flowforming process permits to obtain a deformation mechanism that allows to have a refinement of the material grain, with a considerable elongation in the same direction of the feed of the rollers and a consequent constriction in the direction perpendicular to it. For this reason the process is considered highly directional, with a notable anisotropy in the shape and size of the grain. In fact there are not only differences in the size of the grain, considering different directions, but there are grains of different shapes depending on whether the external or internal portion of the component is considered, with a grain that moving towards the inside becomes more and more circular in shape.
The high non-uniformity of the microstructure along the radial direction may reach extreme values in the case of high deformations and this aspect may introduce significant uncertainties in the evaluation of the mechanical properties of the final parts (i.e. microhardness, maximum elongation, yield strength) due to the computational methodologies used to estimate the average grain size and in the literature there are no contributions regarding the evaluation of the grain size in the case of the flowforming process. The paper focuses on the most frequently used measurement methods to assess the measurement accuracy, having as reference case for the investigations the flowforming of AA6082 tubes, processed at different process parameters to change the shape of the grain and the gradient along the radius due to different deformation mechanisms. Comparisons were carried out with regards to methods that allow measuring the grain size using zero-dimensional features (Triple-Point Count Method [5]), one-dimensional features (Heyn Intercept Method [5]), and two-dimensional features (Jeffries Planimetric Method [5]), describing in the first part of the paper these operating procedures. In the final part, these methods were applied, analyzing the results obtained by considering the direction parallel and orthogonal to the deformation one.
2 Grain size measurement methods
2.1 Triple-Point Count Method – zero-dimensional features
This method 6 utilizes the Euler’s law to obtain the number of grains per unit area. The only prerequisite concerns the magnification, which must allow to observe at least between 50 and 60 triple points inside the micrograph, because having too many triple points leads to a difficult and inaccurate count. A circle of known size is superimposed on the micrograph of the material, and the number of triple points, hereafter called P, is counted, obtaining the number of grains per unit area, hereafter NA, according to the following relationship:

where AT is the circle test area. If a four-points grain junction is observed, which is rare, it is given a count of two. The average grain area A is obtained by the reciprocal of NA, while the grain diameter d is the square root of the area. Fig. 1 shows the application of the procedure described above, in which are counted 77 triple-points (dots) and 7 four-junction points (crosses) in a circle having a radius equal to 240 μm, thus resulting in an average grain area of 3892 μm2 and an average grain diameter d equal to 62.4 μm.
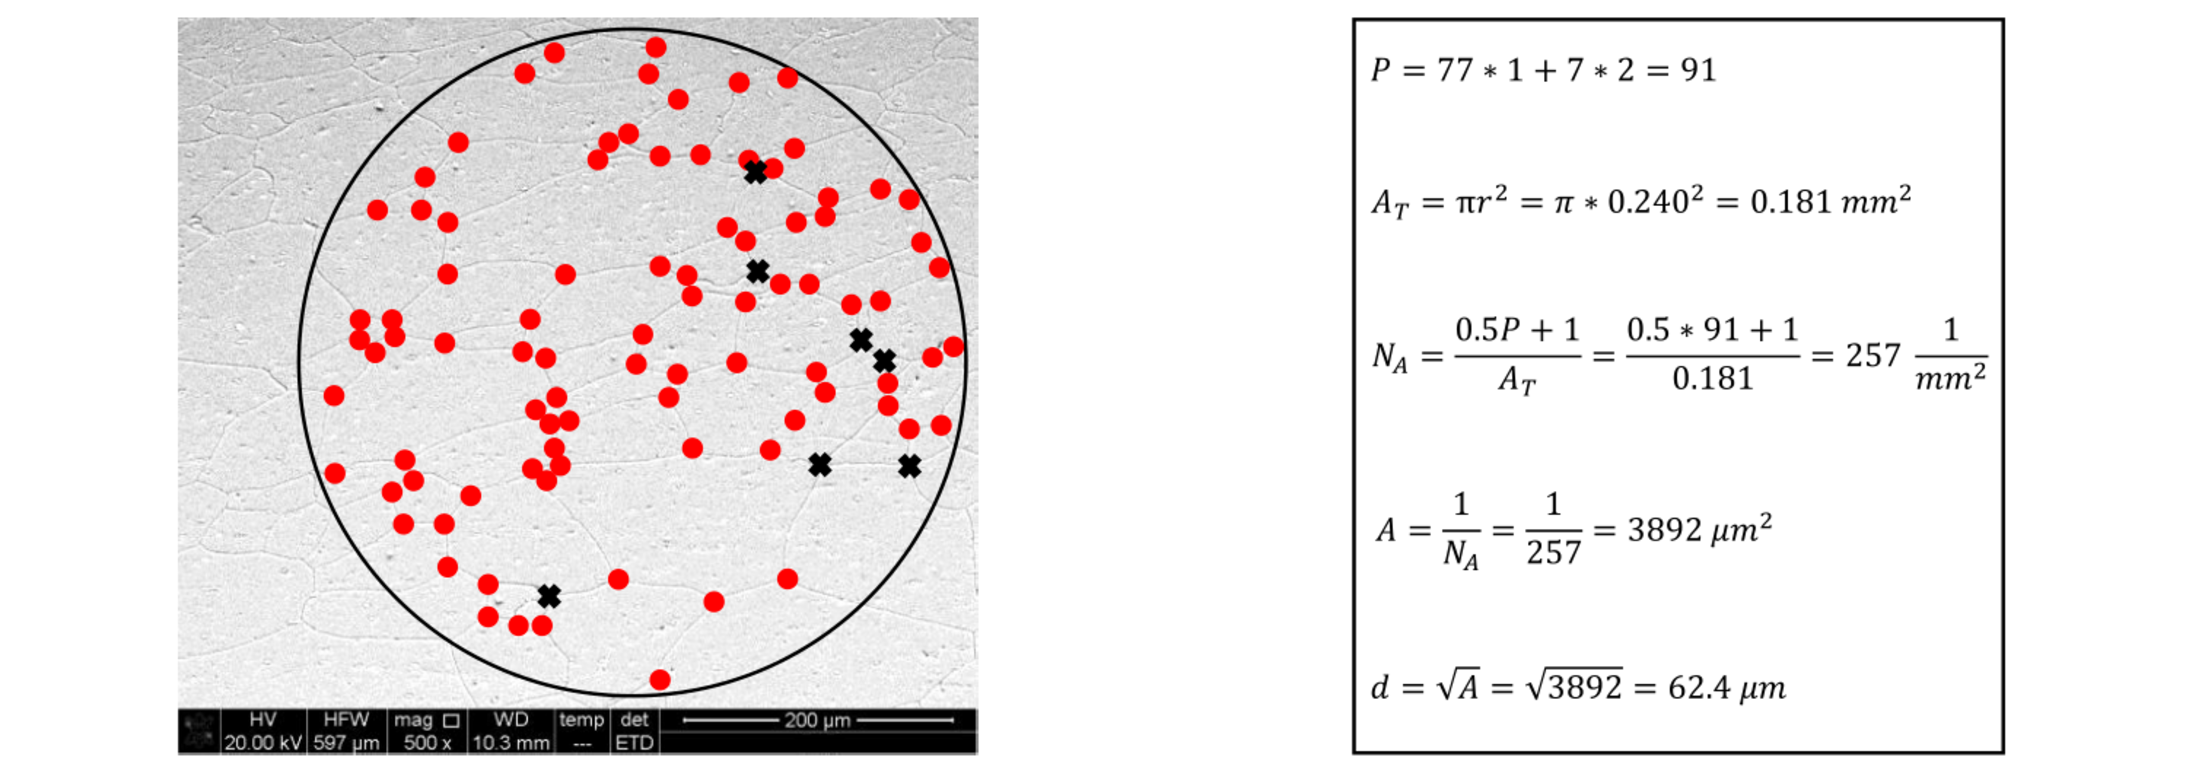
Fig. 1. Application of the Triple-Point Count Method, using a 500X of magnification.
2.2 Heyn Intercept Method – one-dimensional features
The Heyn Intercept Method, developed by Heyn [7] and then modified by Hilliard [8,9] and Abrams [10] does not require marking off the intercepts or intersections to obtain an accurate count, hence, this method is faster compared with the zero-dimensional features and the two-dimensional features, and the same degree of precision can be obtained in less time. This method is useful for deformed grain structures, in fact for nonequiaxed grain structures it is possible to place over the micrograph lines of known length, with different orientation, as represented in Fig. 2. In the case of equiaxed grain structures, it is possible to use circular test lines, which are also used to investigate the anisotropy of the microstructure.
To calculate the grain size, a count can be made of either the number of grains intercepted by the test line, N, or the number of grain boundary intersections with the test lines, P, having equivalent results. Using straight test lines it may be easier to make N counts, considering the grains partially intercepted by the ends of the lines as an half grain. Otherwise, using circular test grids, there are no doubts regarding the exact values of N or P, because there are no line ends. The number of N or P counts is divided by the true test line length (or the circumference in the case of circular grid) to obtain NL or PL, which are the reciprocal of the mean linear intercept length L. As explained above, the procedure in the case of elongated structures can give higher values comparing different directions, for instance the parallel and the perpendicular direction to the deformation axis. For this reason, it can be defined an anisotropy index, hereafter AI, which represents the ratio between the lengths in the parallel and the perpendicular directions:

Fig. 2 shows the application of the procedure described above, using four directions for the test lines, in which are counted 12 grains in the vertical direction, 11 grains in the horizontal direction, and respectively 8 and 11 grains in the 45 deg and -45 deg directions. Since each line length is equal to 480 μm, the average grain length l is equal to 45.7 μm.
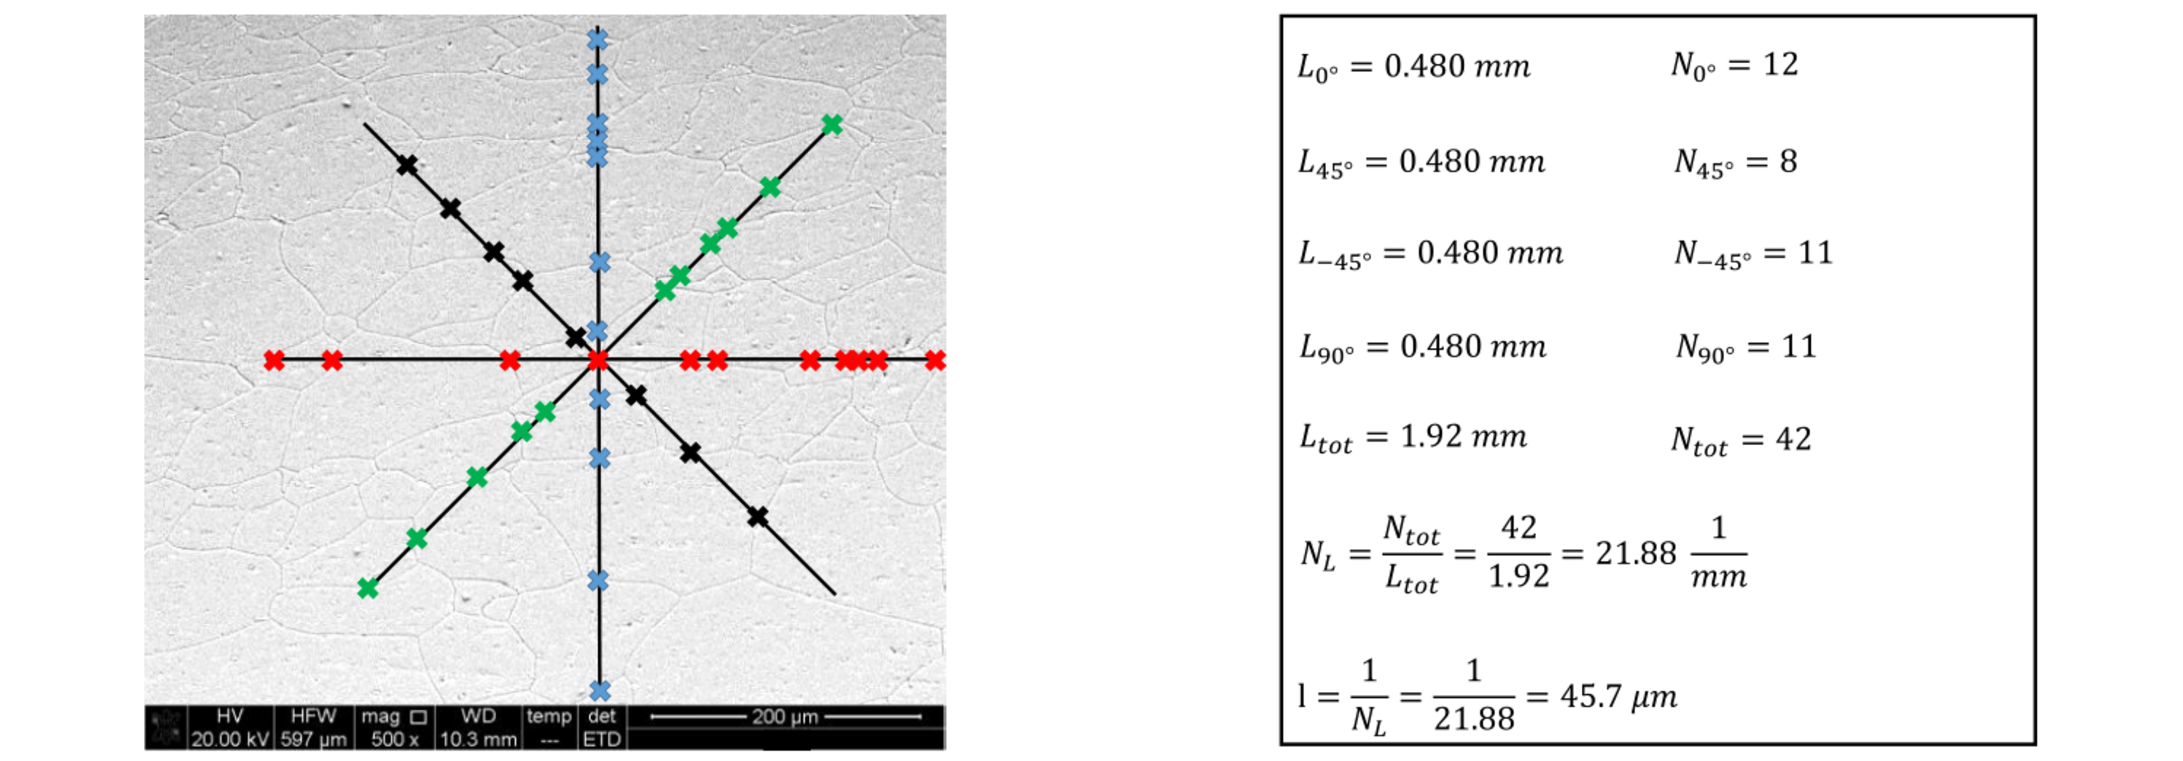
Fig. 2. Application of the Heyn Intercept Method, using a 500X of magnification.
This method, suggested by Sauveur and refined by Jeffries [11], requires the counting of the number of grains in a known test area, usually circular in shape, superimposed on a micrograph. The magnification is chosen so that at least 50 grains are within the test area. Next, the number of grains completely within the test area, hereafter called n1, and the number of grains intersecting the circle, so called n2, are counted. Several fields must be counted in order to obtain a satisfactory level of precision, depending on the uniformity of the grain structure.
The sum of n1 and n2/2 is multiplied by the Jeffries factor, f, which is obtained subdividing the linear magnification squared by the area of the circle, as the following equation:

while the number of grains per unit area N A is obtained according to the following relationship:

and the average grain area A is obtained by the reciprocal of NA, while the grain diameter d is the square root of the area.
Fig. 3 shows the application of the procedure described above, in which are counted 40 grains that are completely inside the circle, while 30 grains intersect the boundary of the circle, in a circle having a radius equal to 240 μm, thus resulting in an average grain area of 3290 μm2 and an average grain diameter d equal to 57.4 μm.
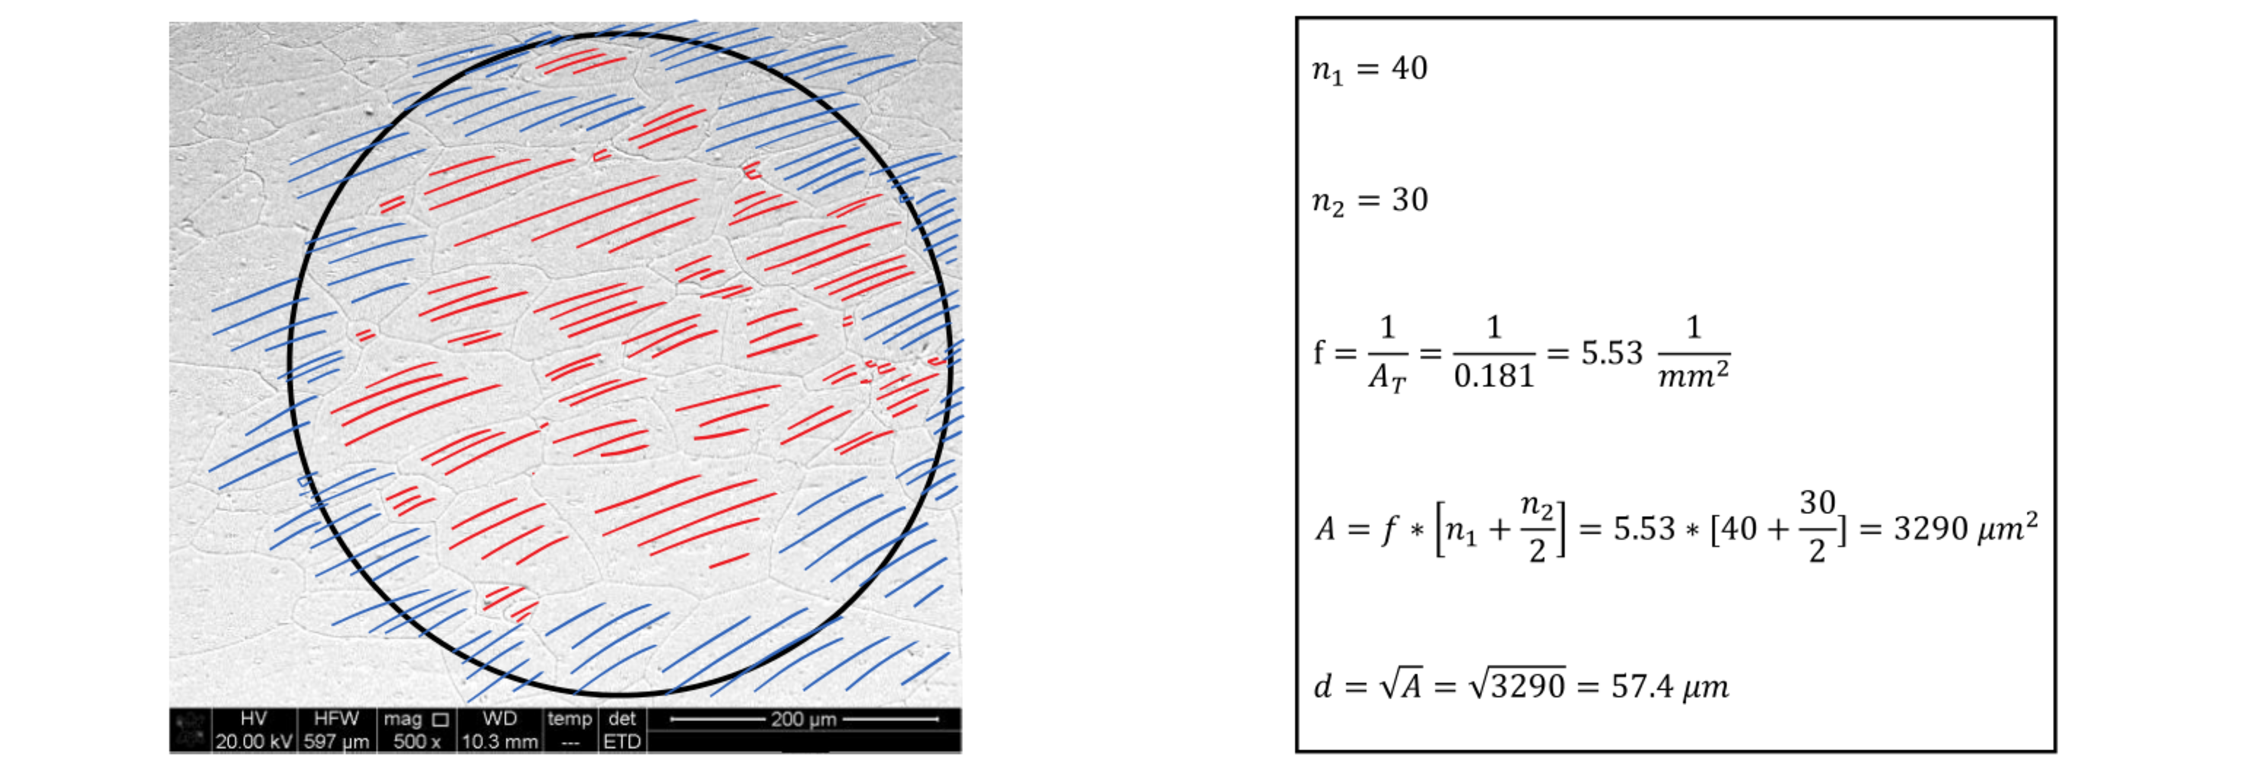
Fig. 3. Application of the Jeffries Planimetric Method, using a 500X of magnification.
3 Experimental
3.1 Backward tube flowforming
Tube flowforming allows producing cylindrical parts using specific machines that usually employ three rollers placed in the radial direction, which are advanced in the same direction as the component axis. Due to the geometry of the piece, the main limitation is being able to obtain only axisymmetric components, but the great advantage is to obtain net shape parts. The blank is mounted on a rotating mandrel which allows, thanks to the simultaneous action of the rollers that advance in the axial direction, to reduce the thickness, while maintaining the internal wall of the piece unaltered. Therefore, the internal diameter of the component remains constant, while the external diameter decreases during the process, increasing the length of the piece and eventually recreating the desired external surface, being an incremental and highly customizable procedure. The direction of the material axial flow allows classifying two flowforming methods, namely forward and backward, represented in Fig. 4a. In the case of backward flowforming (the lower side of Fig. 4a), the workpiece is pushed against the mandrel using the pressure generated by the displacement of the rollers and material flows under the rollers in the opposite direction of the displacement towards the unsupported end of the mandrel. The deformed material in the contact zone presents three-dimensional compressive stress state, which helps to improve the material formability and refine the microstructure, as reported by Xia et al. [12]. Considering the forward flowforming, represented in the upper side of Fig. 4a, the material flows in the same direction of the rollers displacement and the part that has not been worked is driven ahead of the rollers. The tube is held between the mandrel and the tailstock, which requires a base or a flange to allow it to clamp against the part.
Tube flowforming trials were performed on a Mori SeikiTM NL 1500 CNC lathe equipped with a self-designed backward tube flowforming apparatus, which allows to vary the interpenetration of the rollers in the radial direction, thus changing the amount of deformation and consequently also the shape and the size of the material grain. Furthermore, it is possible to carry out the process several times on the same component, in order not to impose the entire amount of deformation in a single pass, but by dividing it into successive passes, thus reducing the force required for the process, also reducing the loads acting on the rollers.
3.2 Test plan
The reference material for the experiments is AA6082 in the form of tubes with an internal diameter of 25 mm and an external diameter of 30 mm, subject to 5 different deformation processes, specifically, the final interpenetrations of the three rollers shown in Table 1 were used.
Table 1. Process parameters for the backward flowforming process.
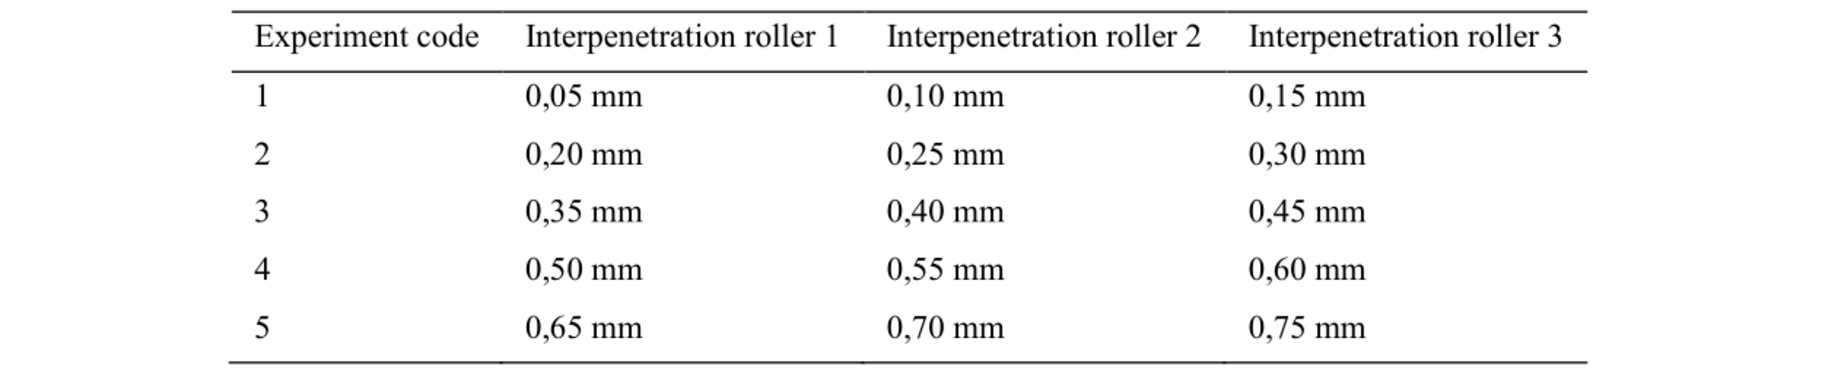
This means that each experiment begins from the previous one and adds further deformations related to the interpenetration of the three rollers. For instance, the second experiment was carried out starting from a tube previously processed with the same characteristics of the first experiment.
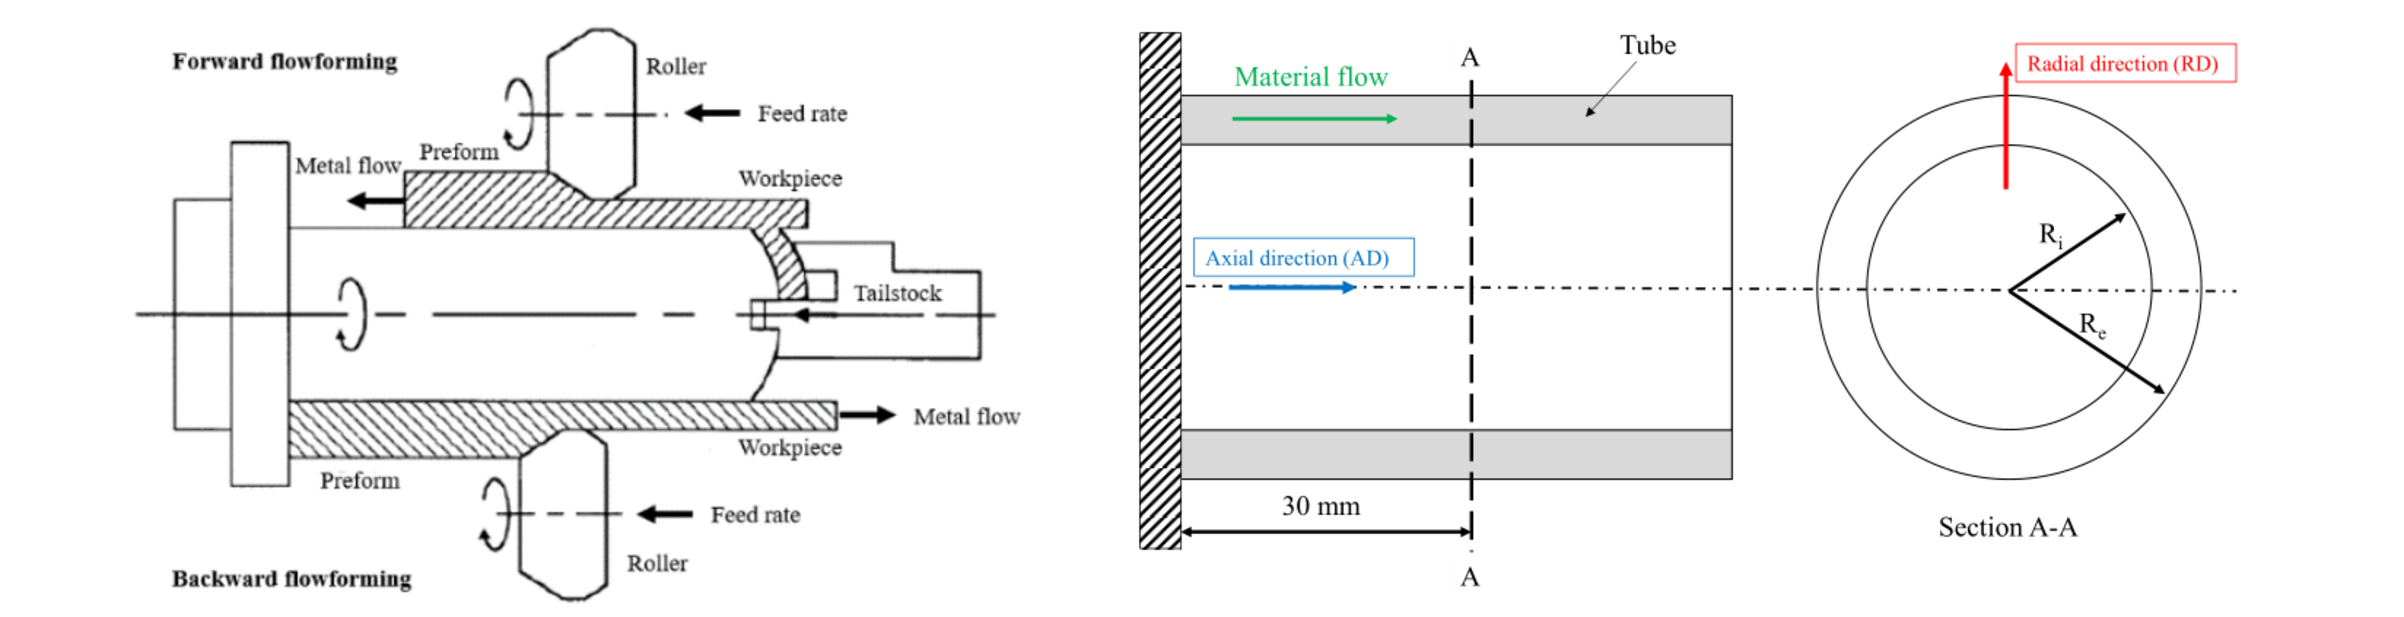
Fig. 4. a) Forward and backward flowforming process. b) Schematic representation of the specimen for the microstructure analysis.
To compare the results using different grain size measurement methods, metallographic specimens were extracted for each experiment, as shown in Fig. 4b, considering a distance from the constrained portion of the tube equal to 30 mm. For this cross section, hereafter called Section A-A, were measured the distances of the micrographs from the center of the tube after using the Weck’s reagent, a solution of 4 g KMnO4 + 1 g NaOH + 100 ml H2O for 12 s, as chemical etching, considering the radial (RD) and axial (AD) directions.
The methods for measuring the grain size were applied in three different positions for each of the 5 experiments, both in the radial and axial direction, for a total of 30 micrographs analyzed. Moreover, for each of these micrographs the measurement was repeated 5 times, in order to have a statistical variability of the result, moving the analysis position within the same micrograph.
4 Results
As explained in the previous section, three different methods were used, comparing the microstructures in two different directions for each of the 5 samples. Fig. 5 shows the comparison between the various methods reported in Section 2, with the same micrograph position, material deformation and analysis direction. The error bar is representative of the dispersion of the results of the 5 measurements made for each of the micrographs.
In Fig. 5 the various methods are compared by analyzing the radial direction of the section. It is possible to notice how as the grain elongation increases, thus the deformation increases, the differences between the 1D methods (Heyn lines and circumferences) increase compared to the 0D and 2D ones (triple-points count and Jeffries methods), which instead provide compatible results. The reason for this difference is related to the nature of the methods: the method developed by Heyn is particularly suitable in cases where there is a high anisotropy in the grain size, providing the grain size not deriving it from an area measurement. This means that the fundamental assumption for the 0D and 2D methods is that the grain is equiaxed, deriving its size from mathematical equations.
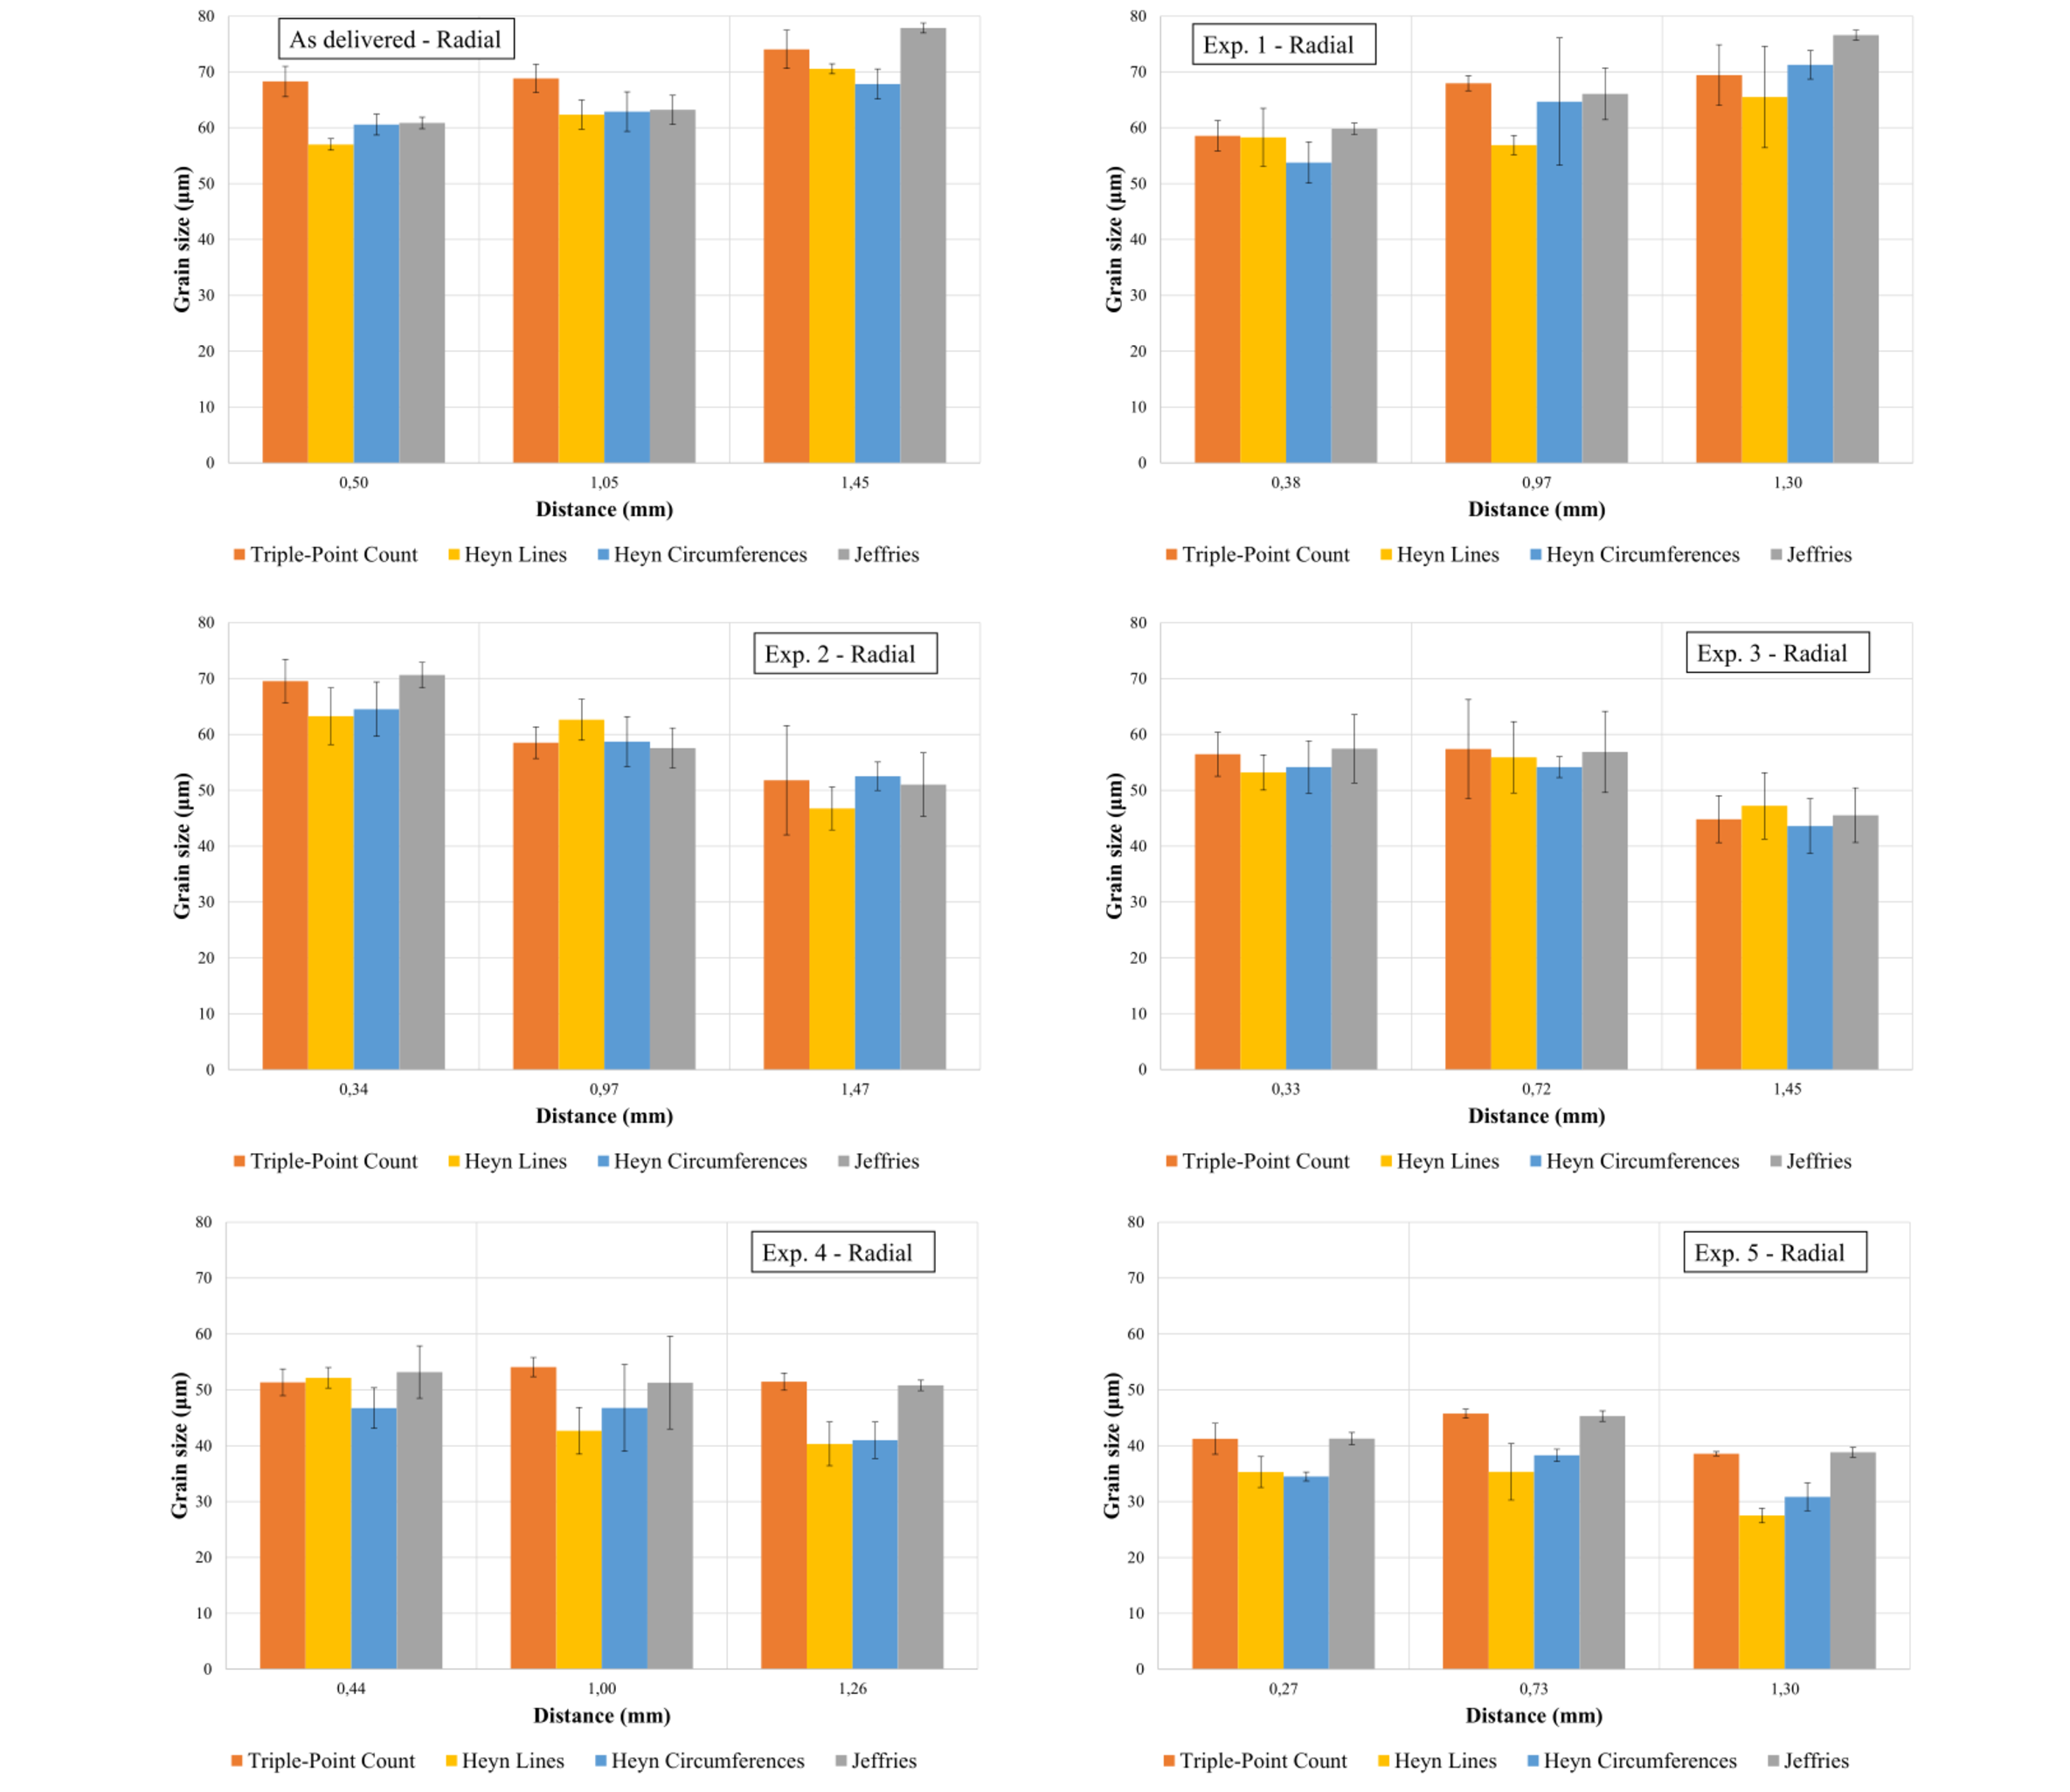
Fig. 5. Microstructure measurements methods comparison in the radial direction.
In Fig. 6 the various methods are compared by analyzing the axial direction of the section, and also in this case the error bars are representative of the dispersion of the 5 measurements made for each of the micrographs. As for the radial direction, also for the axial direction it is possible to note that as the grain elongation increases, and therefore the deformation, the differences between the 1D methods (lines and Heyn circles) increase compared to the 0D and 2D ones (triple-points count and Jeffries methods), which instead provide compatible results. Furthermore, it can be noted that as the deformation increases, there is less dispersion of the results, which is connected to a greater uniformity of the microstructure at the same distance from the center of the tube.
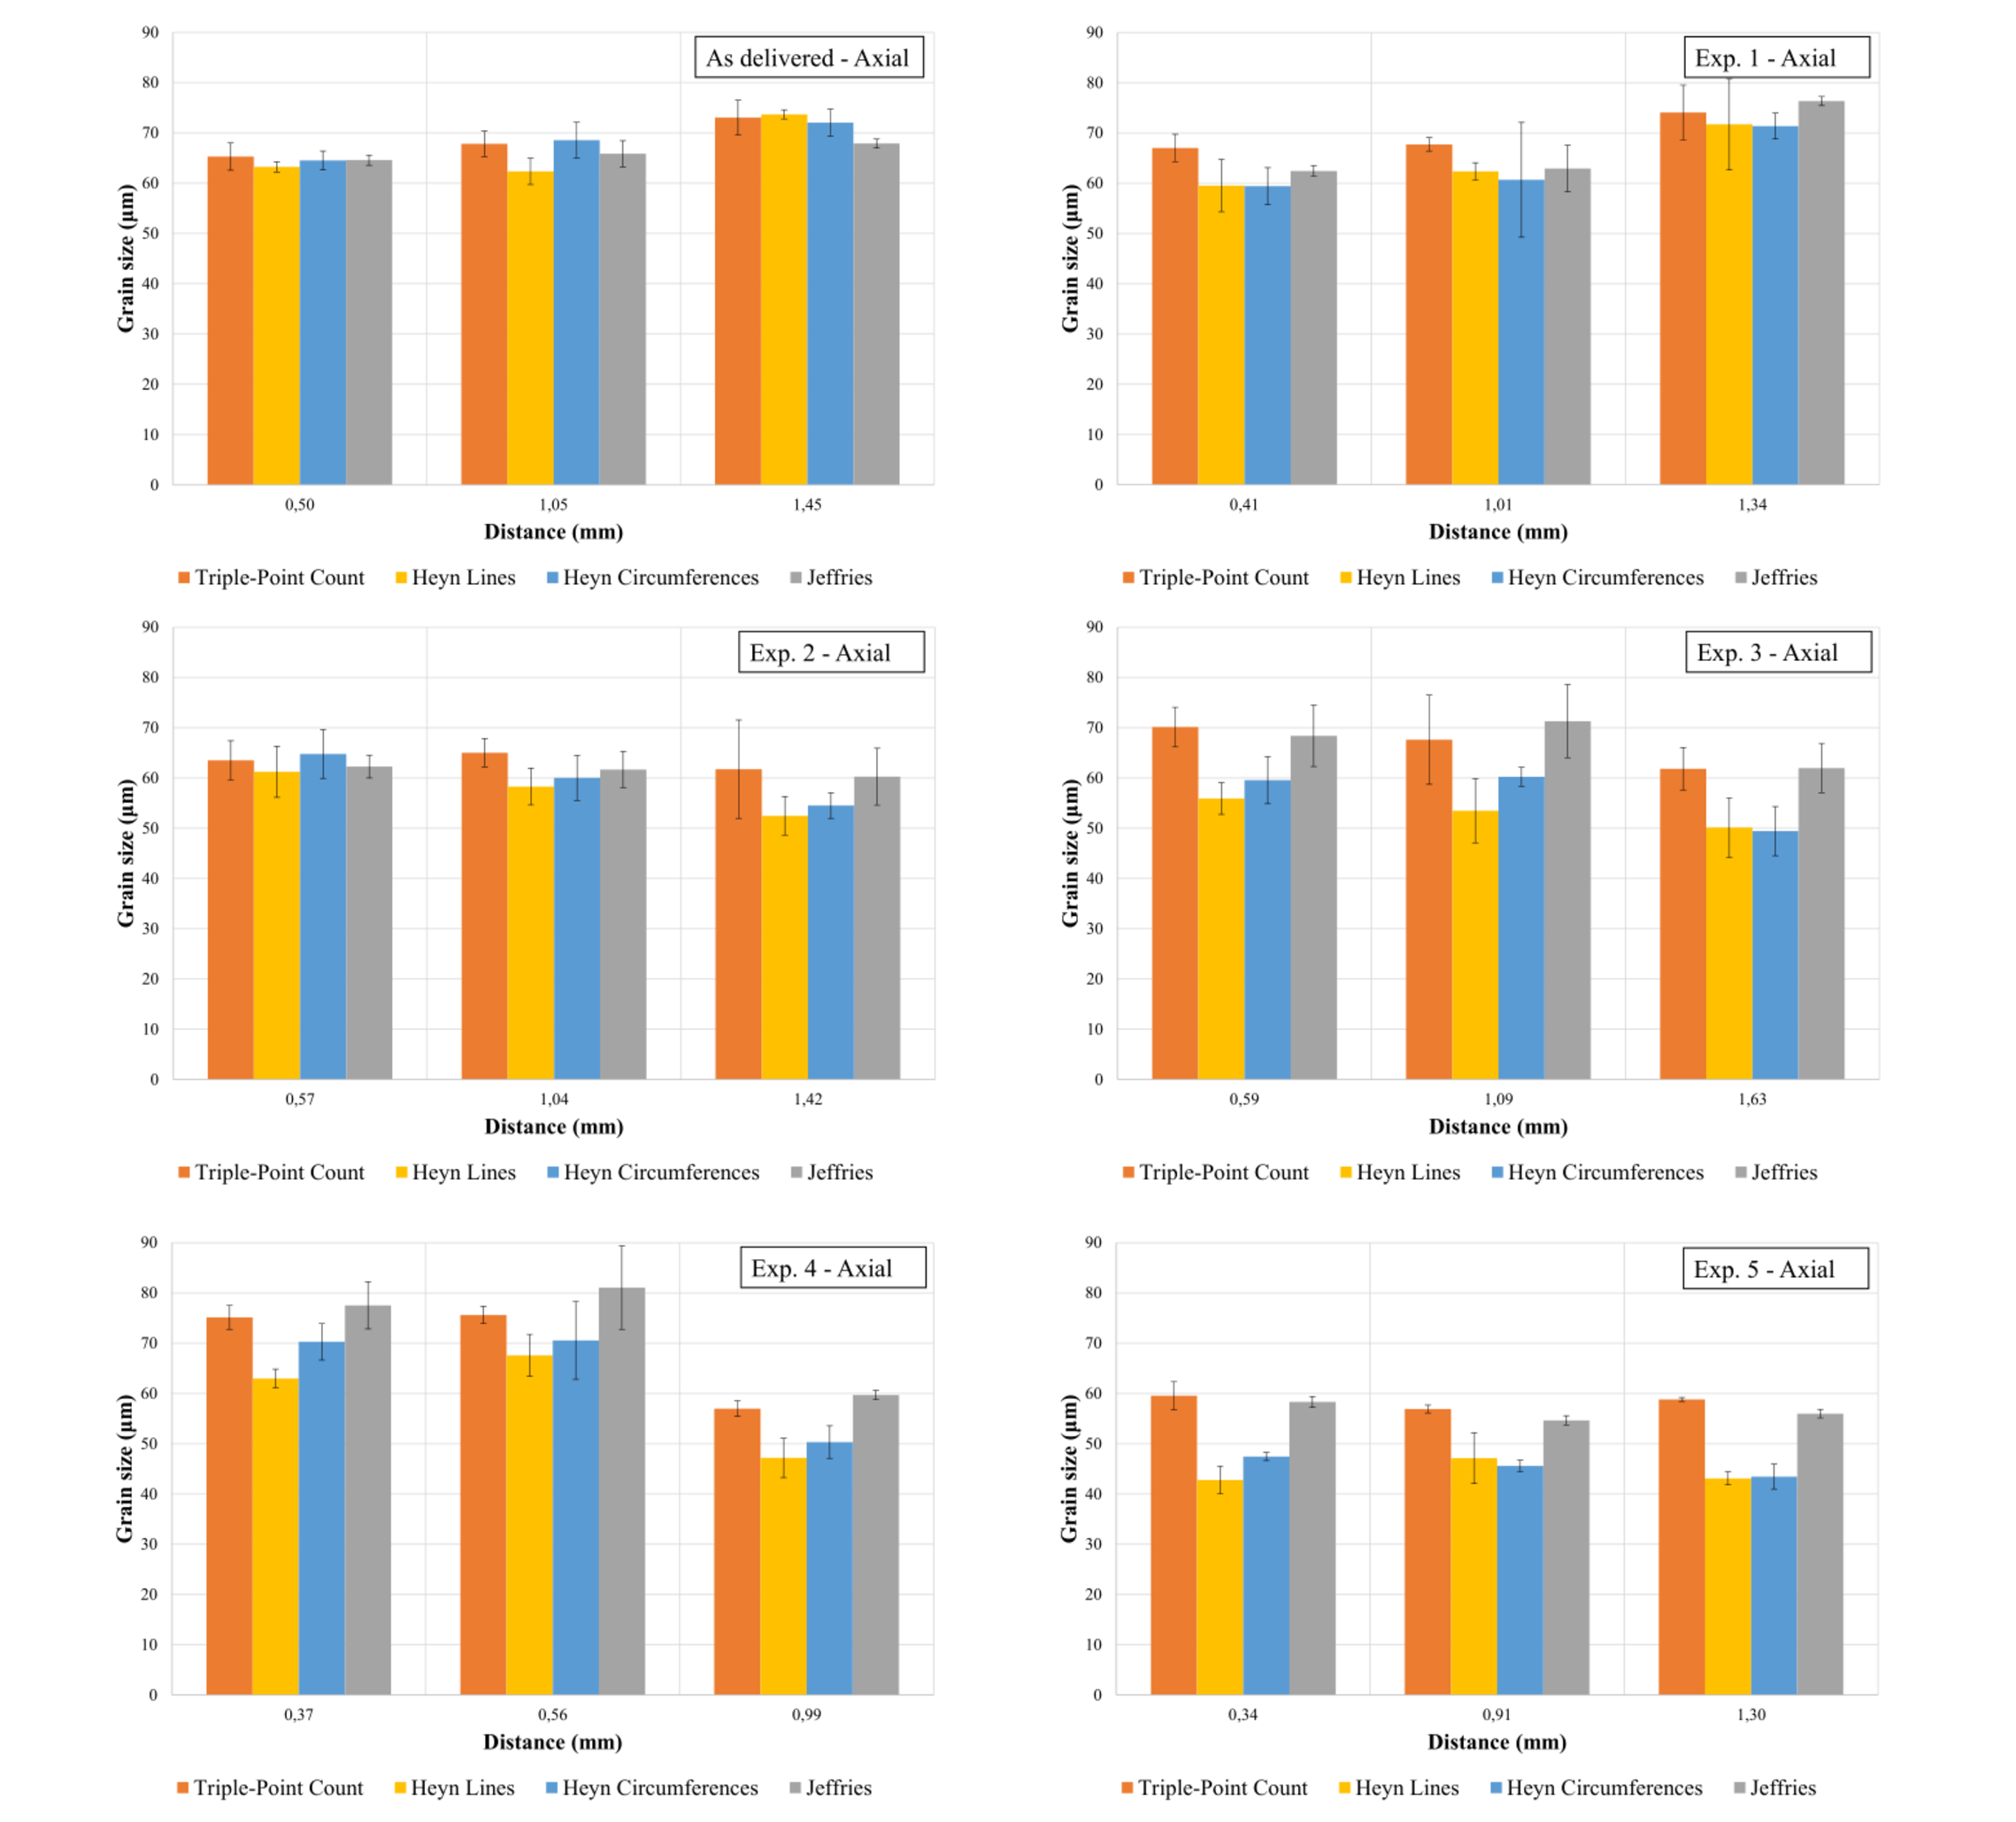
Fig. 6. Microstructure measurements methods comparison in the axial direction.
5 Conclusions
The paper focuses on the most frequently used measurement methods to assess the measurement accuracy and the correlation with the local variations of mechanical properties. The reference case for the investigations is the flowforming of AA6082 tubes, characterized by different shape of the grain and the gradient along the radius due to different process parameters. Comparisons were carried out with regards to methods that allow measuring the grain size using the triple-point count method, the Heyn intercept method (both with lines and circumferences) and the Jeffries planimetric method. From the analysis of the results it was possible to observe a notable difference among the various methods: the method developed by Heyn, particularly indicated in cases where there is a high anisotropy of the grains, provided lower measurements values than those obtained with 0D and 2D methods. The reason is due to the mathematical formulation: while in the 0D and 2D cases the grain measurement is obtained in the hypothesis that it is equiaxed, in the 1D case it is obtained directly by dividing the number of intersected grains per unit of length. In the case of the use of lines, 4 directions were chosen on which to carry out the analysis, while in the case of circles, 3 concentric circles were chosen. In this way it was possible to take into account the anisotropy in the shape and size of the grain, which was not possible using the other methods. For the validation of the results, future activities will focus on the use of tensile tests on specimens obtained from flowformed components in order to verify, through the Hall-Patch relationship, the correlation between microstructural properties and mechanical properties.
Acknowledgements
This research and development project was funded by "Severe plastic deformation by incremental processes - SPeDITO" ref. BIRD195839-2019.
