1 Introduction
Fused Filament Fabrication (FFF) is the most widespread AM processes used for thermoplastic prototypes, tools, and low- volume products. It is a new name for Fused Deposition Modeling, an extrusion-based process in which products are realized by melting polymer-based filaments and depositing molten materials on a horizontal build platform. These polymers soften over a wide range of temperature, forming a high-viscosity material ideal for material extrusion through a 0.2–0.5 mm diameter nozzle [1]. The calculation of layer contours from a digital model of the part (slicing) is the basis for the generation of extrusion trajectories by appropriate programming software [2], useful to produce free-defects components. A comprehensive review of the FFF process parameters categorizes them into slicing parameters, building orientation and temperature conditions, all affecting the filament (inter-roads and intra-layers) bonding, and thus influencing the mechanical properties of final parts. [3]. Some studies link the printing parameters and physical polymer properties to the viscosity and shape of the filament immediately before deposition in the FFF process.
Focusing on the specific polymer such as Polylactic Acid (PLA), this is characterized by a higher cost of production compared to petroleum-derived, non-biodegradable materials whereas it is inherently brittle, despite its tunable tacticity, microstructure, and mechanical properties. These features limit the use of PLA in a wide range of short-term applications [4]. The printed strand shape to form the raster has a direct impact on the part surface roughness, cooling process after printing, and bond formation between adjoining raster and overlaid layers [5]. For this reason, the dimensional accuracy and the mechanical properties of the final part were indirectly influenced, although they mainly depend on other processing parameters [6]. The deposition became complex in the presence of fibers because it is necessary to evaluate the Newtonian extrudate swell at the nozzle exit. The effects of the nozzle convergence zone and the extrudate swell at the nozzle exit have important effects on the fiber orientation state and, therefore, the resulting material stiffness of the extruded polymer [7]. An analytical model can be used to predict the flow within the nozzle, as well as the melting rate in an FFF process. The model can also be used to optimize the melting within a material extrusion additive manufacturing process [8].
The research in this paper focused on the evaluation of the deposition of a simple raster geometry with a FFF machine, supported by an analytical model to compute the build time. The geometrical variations caused by changes in process parameters were evaluated, also considering the thermal and rheological properties of the PLA filament. The study identified essential correlations between process parameters, raster dimensions, and filament properties.
2 Raster design
The experimental activity consisted of a deposition of a non-complex geometrical raster with a series of horizontal/vertical segments extruded in fast sequence (Figure 1). The focus was on the extrusion of this geometry intending to evaluate processing potentials in terms of part production time, quality in the repeatability of product dimensions with a variation of processing parameters such as print speed and temperature, evaluating the surface dimensions. The filaments, made of PLA, had a 1.75 mm diameter with a dimensional diameter tolerance ±25 μm. The main physical and mechanical properties, collected from material data sheets (M3D LLC in Fulton, USA), are reported in Table 1.
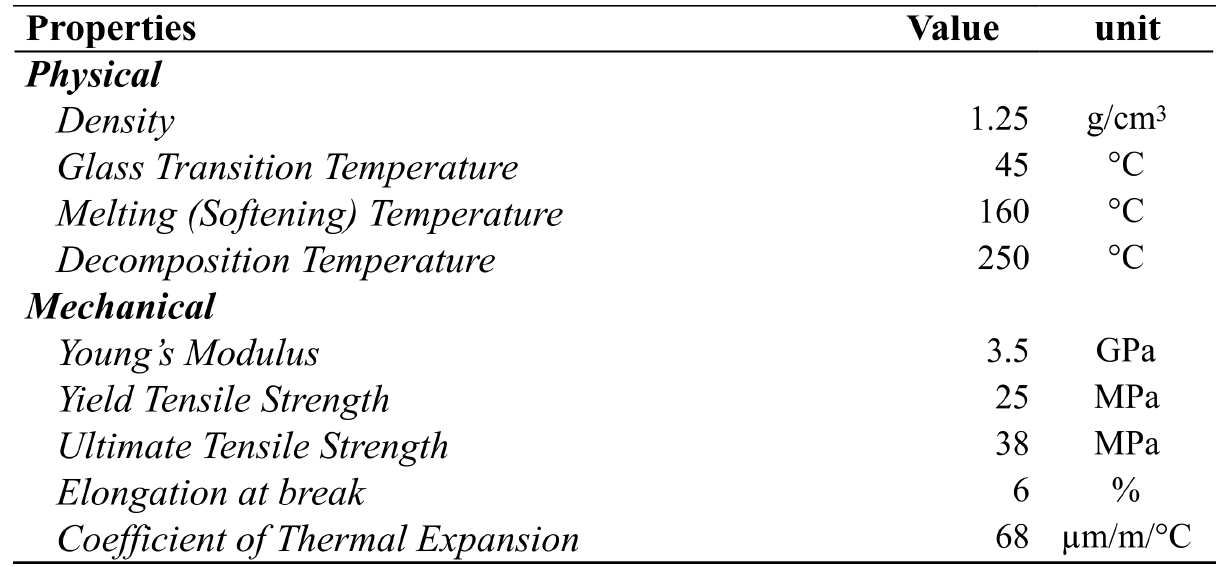
Table 1. Material data.
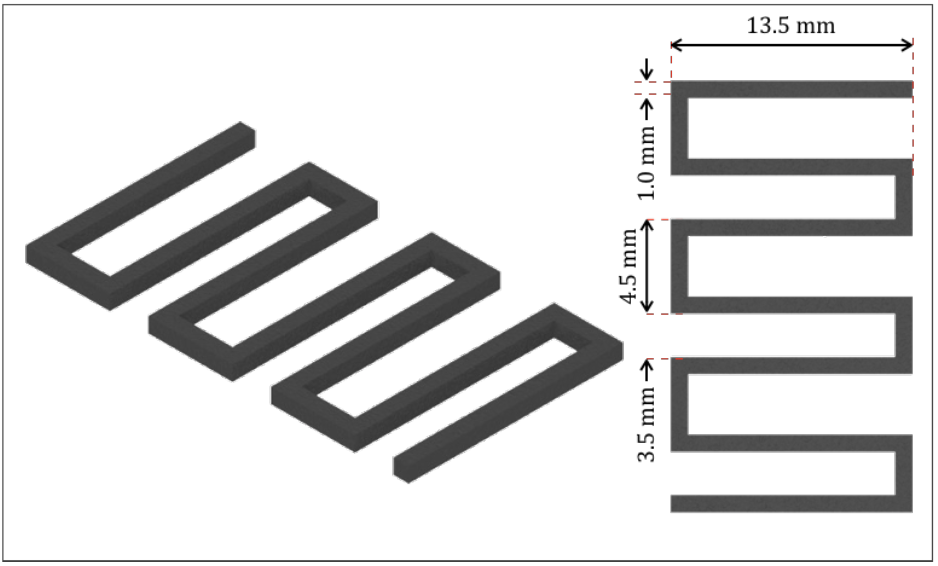
Fig. 1. Raster geometry
The print temperature varied between 190°C and 220°C with the platform surface being kept at 50°C. The printing temperature for the PLA should be higher than 190°C to ensure a fully melted filament, avoiding nozzle clogging, but not exceed 220°C to limit severe deformation during printing and polymer degradation caused by an excessively low viscosity. For this reason, Differential Scanning Calorimetry (DSC) tests were performed to determine the main thermal properties of the PLA filament. The measurements were carried out on a Chip-DSC 10 (Linseis Messgeraete GmbH, Selb, Germany), a heat Flux DSC with an integrated heater and temperature sensor. The main processing factors of the DSC analysis were the thermal cycle as well as the heating and cooling rates. Each thermal cycle consisted of a single run with a heating step from 20°C to 220°C, a holding step for 5 minutes and a cooling step from 220°C to 20°C for samples weighing about 8 mg, according to a well-known procedure [9]. The heating and cooling rates varied to investigate the polymorphic aspect of PLA by analyzing the melting process throughout fast heating and cooling, in very near fabrication conditions. Figure 2 shows the DSC measurement results for the different heating/cooling rates from 5 to 12.5°C/min. The glass transition, cold crystallization and melting peaks of the PLA shifted to higher temperatures with an increase in the heating rate. At the same time, the crystallization peak decreased with an increase in the cooling rate. These effects were also confirmed with heating and cooling rates greater than 100°C/min. These latter conditions were prevalent in real fabrication.

Figure 2. DSC thermograms of heating (left side) and cooling (right side).
The print tests were carried out using a Funmat HT (Intamsys Technology Co. Ltd., Shanghai, China), a commercial FFF machine used to realize all samples in this experiment. The apparatus has a single extrusion nozzle mounted on a Cartesian axis system controlled by stepper motors. Polymer filaments were mounted on a spool and processed through a gear and pinch wheel system into a heated nozzle of 0.4 mm-diameter and extruded onto the heated platform. From the experimental point of view, a particular device was used to study the geometry of molten polymer material by mounting glass slides onto a platform surface and depositing several lines. This deposition recreated the conditions of the initial layer, taking advantage of a difference in the density for the subsequent microscope scanning analysis, according to a procedure found in the literature [10]. Moreover, the variation in the shear rate along the nozzle diameter was reduced to prevent flow instabilities [11].
3 Multi-physical model
A multi-physics model was implemented to predict the heat transfer, stresses and, deformations during filament extrusion using COMSOL Multiphysics (Comsol Inc., Burlington, USA). The filament was deposited on a glass plate (100×100×3.4 mm3), following the design path. Coupled thermal and mechanical analyses were carried out by using a segregated solver splitting the Jacobian matrix into smaller sub-problems, usually one for each degree of freedom (temperature and displacement). The segregated approach treated each physics sequentially, using the results of the previously solved physics to evaluate the loads and material properties for the next physics being solved. The advantages of this approach are several such as the use of an optimal iterative solver in each linear sub-step, a more memory-efficient faster solver and, less time for solving iterations than a fully coupled approach. The temperature fields were initially computed during the thermal analysis and then recomputed during the mechanical one to evaluate the induced strain and stress fields at each simulation step. The FE mesh consisted of about 210,000 elements (quadratic hexahedron) with a constant element length of 100 μm and an average mesh quality of 0.82. A high number of small- sized elements were used for the deposition path, whereas large-sized elements were employed for the glass plate. The numerical model reproduced the filament deposition onto the substrate concerning time, using the element birth-death technique [12]. The main assumptions of the model were: 1) The temperature of the glass plate was 50°C at the start of the process. 2) A Gaussian heat flux distribution was applied to the top surfaces of the deposition path. 3) Free convections and radiations were applied to all external surfaces. 4) A contact surface with a temperature continuity boundary was defined between the path and the glass plate. 5) No external loads except heat fluxes were applied to the mechanical model. 6) The mechanical boundary conditions constrained movements along X, Y, and Z axes in the glass plate's bottom region. All elements of the deposition path were active (birth) or inactive (death). The dead elements were kept in the model with the material properties equal to those of the air [13]. The activation sequence strictly followed the physical deposition. The nodes at the nozzle travel were activated and remained active, restoring the original material thermo-mechanical properties. On the contrary, the nodes before the nozzle position were inactive, giving no contribution to the heat transfer process. The main processing parameters of the FE model were deposition power and speed. The speed profile was computed with α equal to 0.5, following the rapid and deposition movements. The time step was small enough to accurately represent the nozzle continuous movement without excessively increasing the solution time for both deposition and cooling steps. Figure 3 shows the temperature fields computed with travel speeds equal to 5 and 50 mm/s, keeping the heat flux constant. The arrow represents the position of the nozzle during its travel. The temperature distribution at lower speed was higher than that at a higher speed because of longer deposition time. This time contributed to an increase in thermal gradients in the deposition path. The low conductivity of the polymer and the heat transfer coefficient between the glass plate and the polymer did not promote temperature diffusion. Figure 4 shows the stress distribution for a deposition speed equal to 50 mm/s. The warpage scale was magnified to highlight shape produced by the filament deposition and induced by the thermal gradient. As a result, deformations were observed at the start of the process and with a variation of the path continuity (acceleration and deceleration). This last effect caused the variation of the path thickness.
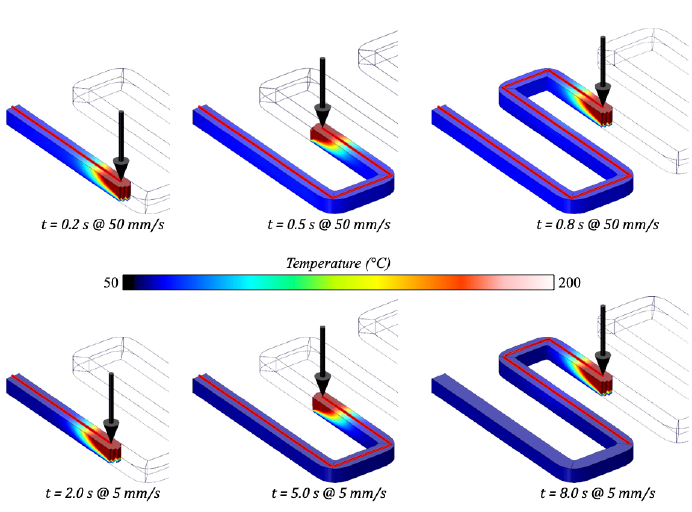
Figure 3. Simulation results - Thermal field.
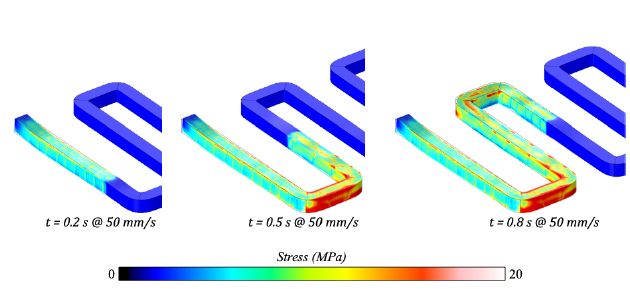
Figure 4. Simulation results - Stress field.
4 Experimental tests
The following experimental activity was focused on the realization of several rasters with different print speed u and print temperature T. The lowest values of the print speed and temperature were 5 mm/s and 190°C while the highest values were 60 mm/s and 220°C. A multi-purpose zoom microscope system AZ100M (Nikon Instruments Europe BV, Amsterdam, Netherlands) was used to acquire the images and measure the 2D profiles. Figure 5 shows the measurements took in the same section of the rasters produced with different print speeds and temperatures. The initial segment of the raster was always incomplete because a time gap existed between the deposition start command and the real filament nozzle exit. The measurements of the 2D profiles pointed out the influence of the print temperature on the path width. As a result, an increase in the print temperature caused a decrease in the path width. The measurements were then repeated in all 13 raster sections, confirming the above results (Figure 6).
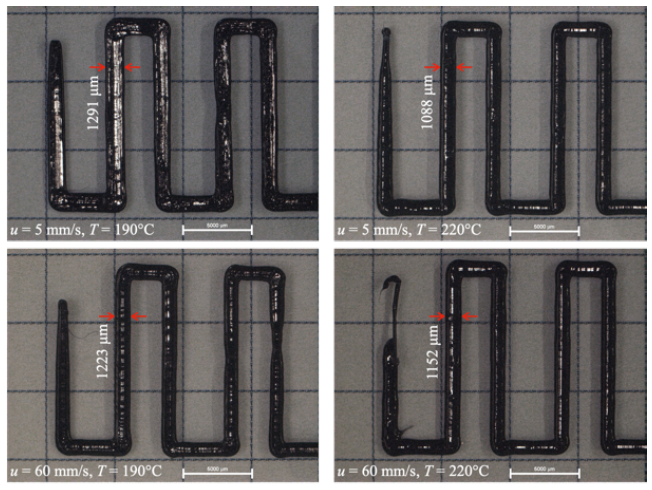
Figure 5. Raster analysis.
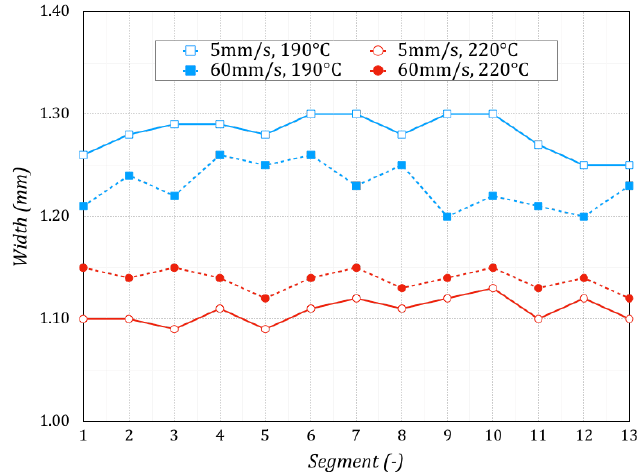
Figure 6. Deposition width vs Segment.
The average lengths for a print speed equal to 5 mm/s and print temperatures equal to 190°C and 220°C were respectively 1.28 and 1.11 mm. The maximum and minimum standard deviations were equal to 19.56 and 12.31 μm. Thus, the influence of the print temperature was significant since the difference of 0.17 mm between the lowest and highest values of the path width could not be neglected. The study was repeated for a print speed equal to 60 mm/s. The average values for print temperatures equal to 190°C and 220°C were respectively 1.23 and 1.14 mm. The maximum and minimum standard deviations were equal to 21.99 and 10.27 μm. The difference between the lowest and highest values was equal to 0.09 mm. The influence of the print temperature was important. As concern the contribution of the print speed, its increase caused a contraction in width band between the highest and lowest temperature. A possible hypothesis of this behavior could be a decrease in polymer viscosity with a temperature and speed increase [14].
The rheometer measurements were made to identify the viscosity at the investigated temperatures. All experiments were performed on a HAAKE MARS III rotational rheometer (Thermo Fisher Scientific Inc, Waltham, USA), using nitrogen as a shielding gas to avoid polymer degradation and water as cooling media. Figure 7 reports the viscosity measurements, carried out with a shear rate ranging between 6×10⁻² and 2×10² s-1. Shear rate values lower than 6×10⁻² s-1 were not used because material degraded [11]. The differences in the viscosity values became smaller, with a shear rate increase. In general, the high viscosity of filament led to an under-extrusion (impossibility to supply the right amount of material), causing missing layers, thin layers, or layers with random dots and holes. For this reason, a low viscosity was highly desired, avoiding shallow values, causing over- extrusion (excess of deposited material). A 3D representation of the raster surface for each condition was then realized by selecting the in-focus area from several images with different focal points and producing one all-in-focus image with a scanning step of 5 μm. Such images provided a detailed 3D map for measuring the path height. Figure 8 shows the 3D topology maps of the rasters realized with a print speeds of 5 and 60 mm/s and a print temperature of 190°C and 220°C.
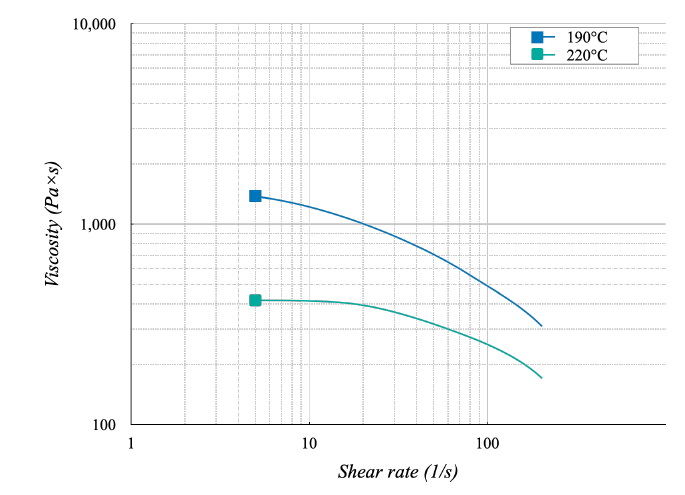
Figure 7. Viscosity curves.
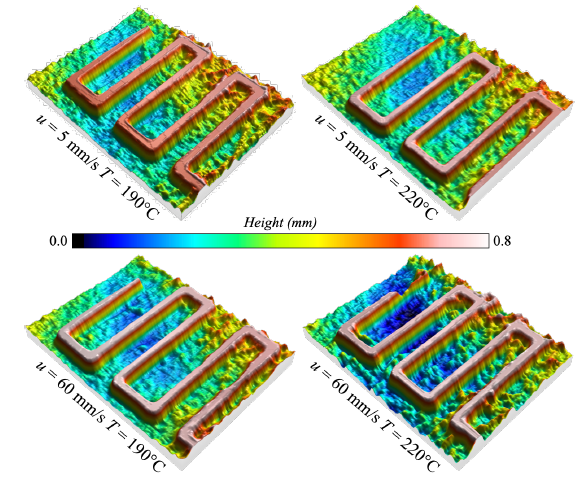
Figure 8. 3D topology maps.
At a first analysis, the realistic display of the 3D surface topographies revealed that the raster produced with the lowest speed and the highest temperature led to the highest height values. On the contrary, the lowest height values were achieved with the lowest speed and temperature. These results were confirmed by the in-depth analysis of four consecutive paths, as Figure 9 reports, extracting 2D profiles from the previous 3D surface topographies. The measure of the average raster heights revealed a value of 0.729 mm for 5 mm/s and 220°C and 0.685 mm for 5 mm/s and 190°C. Besides, the value of the standard deviation in both conditions was below 8.5 μm, establishing excellent stability during rather deposition. The results of raster width and heights also confirmed that an increase in the raster width caused a reduction in the raster height. Figure 10 shows this last condition by comparing results achieved with the lowest built time computed using the highest print speed equal to 60 mm/s, with the highest built time computed with the lowest print speed equal to 5 mm/s. The variations in width were more important than variations in height. The same figure reports tests carried out with a print speed of 30 mm/s and print temperatures of 190°C and 220°C. The results pointed out a good agreement between the predictions of the analytical model and these experimental tests, with a coefficient of determination R2 greater than 95% for all curves associated with raster height and width.
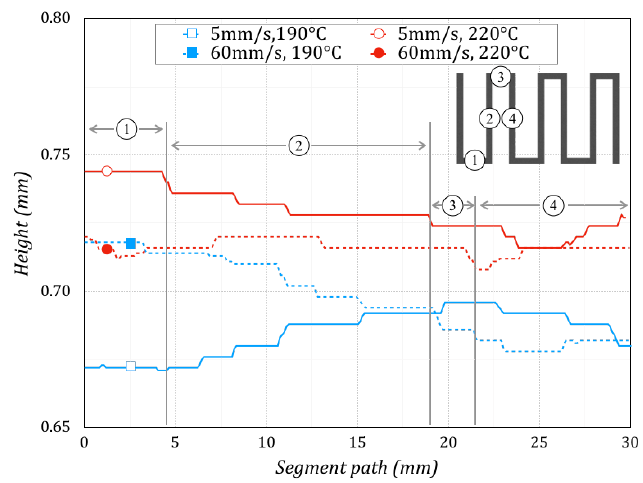
Figure 9. Deposition height vs. Segment path.
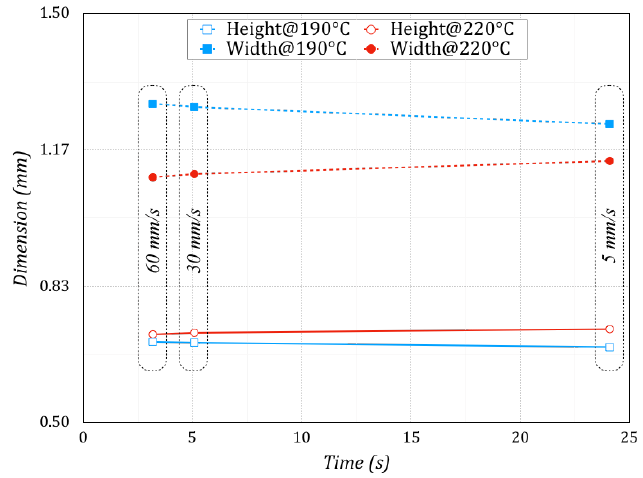
Figure 10. Raster dimension vs. Deposition time.
5 Conclusions
The authors have investigated the raster generation to realize Fused Filament Fabrication parts, focusing on the deposition of the first raster. The geometrical variations have been caused by changes in process parameters such as the print speed and print temperature. The study has identified essential correlations between process parameters, raster dimensions, and filament properties. In particular, the speed variation on raster dimensions has been more important than the temperature variation. Moreover, the raster produced with the lowest speed and the highest temperature has led to the lowest width and the highest height values. On the contrary, the highest width and the lowest height values have been achieved with the lowest speed and temperature. The experimental procedure has been supported by an analytical model, able to compute raster time and dimensions with a coefficient of correlation higher than 95%.
In future work, the experimental activities and the analytical model will be expanded to compute the raster deposition after the first layer and the evaluation of section dimensions.
