1 Introduction
3D printing or additive manufacturing (AM) promises to powerfully influence not only production systems, but also life in general. Recently, great initiatives have been devoted to the development of AM machines for multimaterial 3D printing. This multicomponent strategy enhances the printing quality and ultimate performance of objects by grading the composition or type of polymers within the printed layers; this is not easily achievable by conventional manufacturing methods such as multimaterial injection molding [1].
Fused deposition modeling (FDM) requires the preparation of a filament spool. Fused granular fabrication (FGF), in which polymers in the form of pellets are directly printed in 3D, is an increasingly popular AM technology because it saves time and lowers the industrial cost price by removing the filament spool extrusion step.
In the FDM process, each printing layer is in a semi-molten state when deposited. The motion of the nozzle or the hot building platform presses it slightly into the previous layer, which in turn is heated once again. This combination of pressure and heat is reminiscent of plastics welding. When the two layers are in contact, an interface is created, on either side of which the macromolecular chains can interpenetrate or interdiffuse [2-4]. The free ends of the chains unite and become entangled in a process called cicatrization (or "healing") [5]. Based on the framework of tube theory [6], Yang and Pitchumani [7] reported that the reptation time is a significant parameter required for full healing of polymer welds and they defined a degree of healing Dh(t) in isothermal condition according to:

Here, τw(T) is the average chain reptation time and t is the melt process time. The reptation time, which is assimilated to the weld time, is commonly accepted to present an exponential dependence on molar mass (Mw), as τw ~ Mw3 in entangled polymers. But in the 3D printing process, the thermal history of the interface is non-isothermal and the time during which chains can interdiffuse is short (less than few seconds).
It should be noted that the temperature of the interface between the two successively deposited layers must exceed the glass transition temperature Tg in order for the polymer chains to diffuse and binding to occur [5, 8].
Interestingly, different original experimental techniques have emerged to predict the printability of various polymers (X-ray tomography [9], wide-angle X-ray scattering together with infrared imaging [10, 11], temperature-dependent molecular processes (via rheology [12, 13]) and mechanical testing (via mode III fracture [14]).
Seppala et al. [14] studied the strength of the weld formed between the layers produced by AM (FFF). They measured the mechanical strength of an FFF weld directly through a torsional test called a “trouser tear” fracture experiment. Their protocol has been tested with ABS and more recently with biodegradable polymers such as PBS and PBSA [15]. Elsewhere, McIlroy and Olmsted [13] used the entanglements number, Ze, of a melt of molecular mass Mw as an indicator parameter to probe the quality of polymer printing. The Ze number is defined as the ratio between Mw and Me. The latter is the molecular mass between entanglements. According to the authors, the Ze ratio should be in the 20-30 range to provide good interfacial adhesion.
In the present study, PLA and PMMA monocomponents as well as PMMA/PLA multicomponents were prepared by the FGF printing process (Fig. 1). The healing degree of the mono-material based systems was investigated by rheological modeling.
Next, the effect of printing chamber temperature was specifically discussed. The boundary layer interfaces were characterized by SEM and by flexural and short-beam three-point bending experiments.
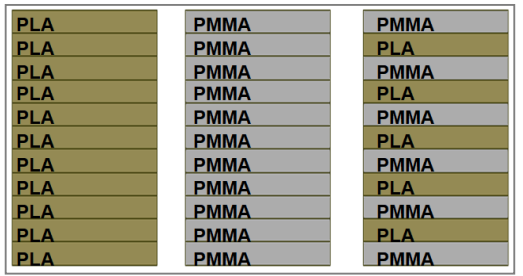 Fig.1. The proof-of-concept of a “gradient design” used for the preparation of PMMA/PLA repeating layers in the Z building direction.
2. Experimental section
2.1 Raw materials
Poly (lactic-acid) (PLA, Ingeo 4043D) with 4.8 mol% D-content was supplied by NatureWorks. Poly(methyl methacrylate) (PMMA, AltuglasVML100) was provided by Arkema.
2.2 Processing and characterization
2.2.1 The principle of gradient method using the FGF process
The principle of gradient method is shown in Fig. 2. First, a PMMA print-head was used to construct the first PMMA layer on the bed, which was covered by a polyimide film. Once the first PMMA layer was deposited, the 3D printer switched to the PLA print-head, and the PMMA nozzle rose to the retracted position. After the PLA layer was deposited, the cycle began again, yielding PMMA/PLA/PMMA repeating multilayers. Each 3D-printed part had the same number of PLA layers and PMMA layers. Specimens of various thicknesses were made in order to meet the standards of the mechanical and rheological tests to be performed.
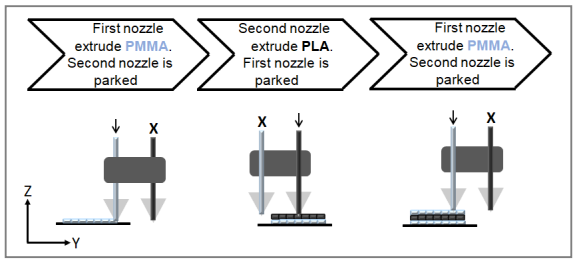 Fig. 2. Processing strategy for building the PMMA/PLA structure gradient.
2.2.2 3D printing platform
The Polymer Additive Manufacturing (PAM) Series P 3D printing tool which is a fused granular fabrication (FGF) printer (Fig. 3), was supplied by Pollen (France) [16]. The PAM machine has four extruders, allowing the manufacture of up to four different materials on a single integrated part.
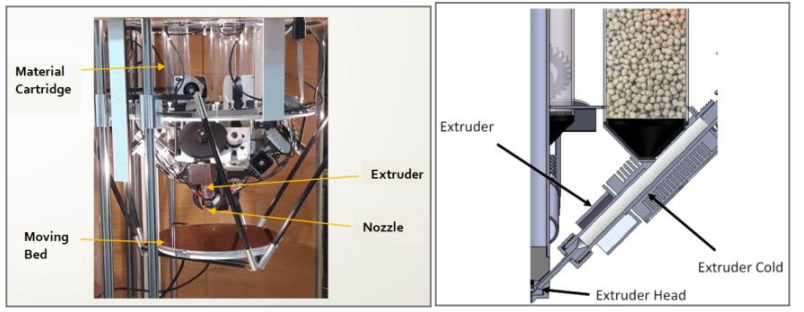 Fig. 3. Left, description of the 3D printing machine used. Right: extruder and feeder of the PAM printer.
2.2.3 3D printing workflow
The 3D printing workflow is divided into three steps as shown in Fig. 4. First, a 3D part design was created by Catia V5 software (USA). The geometry of the specimens was designed to conform to the flexural (ISO 14125), thermomechanical (ISO 6721) and short-beam shear tests (ASTM D3410). After the object was virtually designed, a stereolithography (STL) file was exported into the 3D printer slicing software (Ultimaker Cura, USA). The 3D part was sliced into numerous sections corresponding to the layers to be printed. A G-code file was generated for the 3D printer to use it to print out each test specimen. For multimaterial profiles, two .stl files were created, one for each material. The .stl file of the first material underwent a slicing operation with a given total thickness h = n x e (number of layers x thickness of the layer), with a linear repetition on Catia V5 with a gap of “2 x e” between each layer. The second .stl file (second material) was the same as the first one but with an offset from the plane of the bed (xy plane on Catia V5) of a distance “e”. These two .stl files were imported separately into the Cura software. After the nozzle for printing each material was selected, the two models were merged. This second step is the most important, because it enables the definition of the printing parameters and guarantees good-quality printing (Table 1). Next, the file was exported into the Pollen AM software (Honeyprint), which starts or stops the printing process. Beforehand, the polymer cartridge feeders were filled with the corresponding polymer granules.
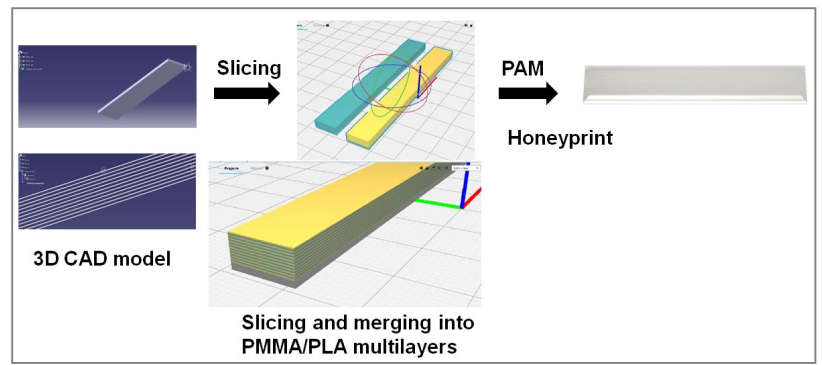 Fig. 4. Workflow used for the 3D printing of PMMA/PLA multimaterial parts.
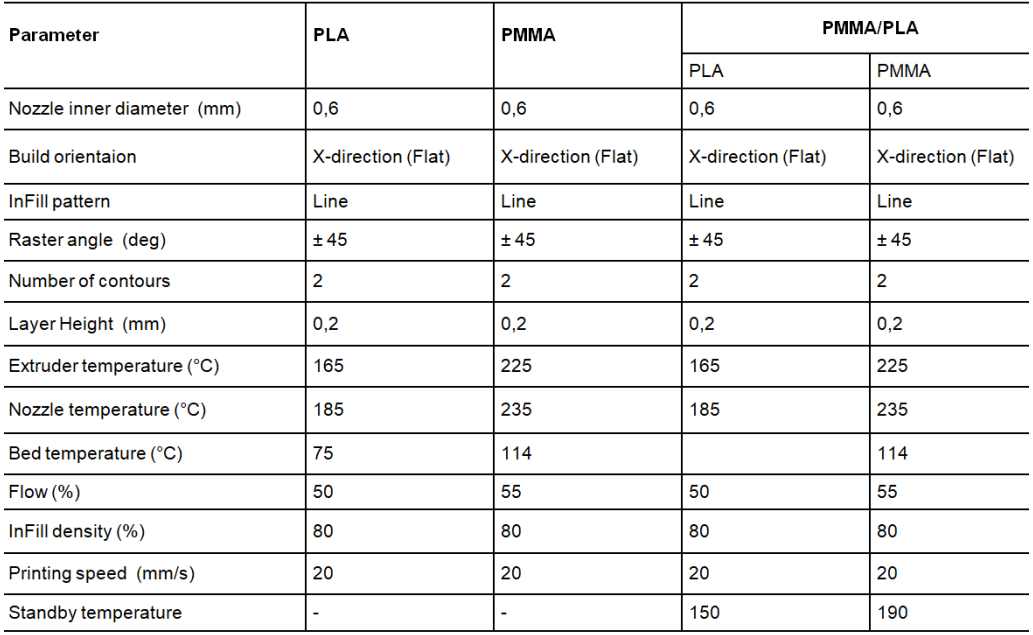
The main processing parameters defined for printing the PLA, PMMA and PMMA/PLA gradient parts are reported in Table 1.
Table 1. Printing parameters used in this study.
2.2.4 Temperature control in the printing chamber
To control the temperature of the printed layers, a special blower system with a controlled flow rate of hot air was implemented. The printing chamber temperature (PCT) was measured at different locations in the manufacturing enclosure using thermocouples. The PCT was set at a fixed temperature of 35°C or 55°C.
To control the temperature history profile in the interface between printed layers, the variation over time of the temperature T(t) of a point in the path of the deposition of molten polymer on the interface between an existing layer and a newly deposited road of filament was measured using a type-K thermocouple (Fig. 5). The type-K thermocouple was embedded by slightly pressing it into an existing printed surface layer, and T(t) was recorded using a data acquisition card system. The signal output from the thermocouple was collected at a 50 Hz acquisition frequency, and time-dependent interface temperature profiles were exported for analysis. All measurements were performed using same GF printing parameters.
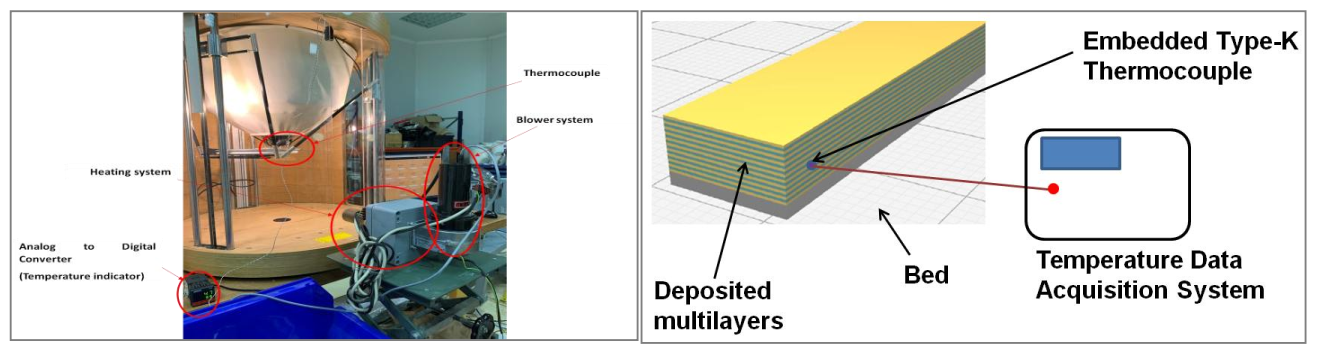 Fig. 5. Device used to regulate the temperature of the printing chamber (left) and scheme of the setup to measure the inter-layer interface temperature during FGF printing (right).
3. Results and discussion
3.1 Effect of processing conditions on molar mass properties
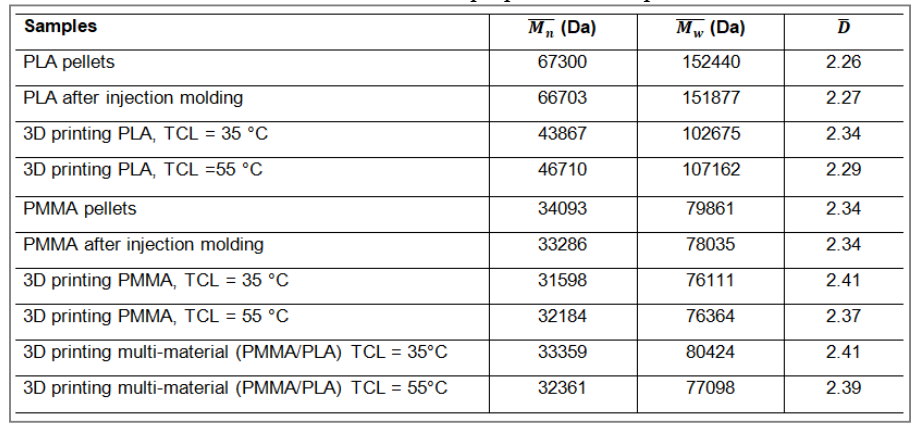
The molar mass properties of the PLA, PMMA and PMMA/PLA multimaterials are recorded in Table 2. For comparison, the molar mass measurements were performed on the equivalent injection-molded samples. The M͞n and M͞w values for PLA decrease by a factor of about 1.5 after 3D printing, indicating that PLA is sensitive to thermal degradation. On the contrary, the molar properties of PMMA seem unaffected by processing. The 3D-printed PMMA/PLA specimens have similar molecular masses compared to PMMA.
Table 2. Molar mass properties of samples.
3.2 Thermal properties of PLA, PMMA and PMMA/PLA samples
Fig. 6 presents the DSC results for the second heating cycle of PLA, PMMA and PMMA/PLA after the 3D printing and injection molding steps. The Tg of PLA is shown to decrease from 56°C to 53.5°C after the 3D printing step. This result is consistent with the molar mass measurements, since the M͞n and M͞w values of PLA decrease after printing. On the other hand, the Tg of PMMA remains stable at around 96°C. It is noteworthy that the PMMA/PLA blend is miscible after processing by melt extrusion (a single Tg at 70°C). However, the DSC trace of the PMMA/PLA multilayer shows two distinct Tg values in the 3D-printed parts. Garzon et al. [17] found that the miscibility and the degree of solubility between PMMA and PLA melts depend on the dwell time in the molten state. When the dwell time is less than 10 minutes, the DSC spectrum shows two distinct Tg transitions. In our case, since the FGF process is very fast and anisothermal (the polymers are only briefly in contact while in the molten state), two Tg can clearly be observed.
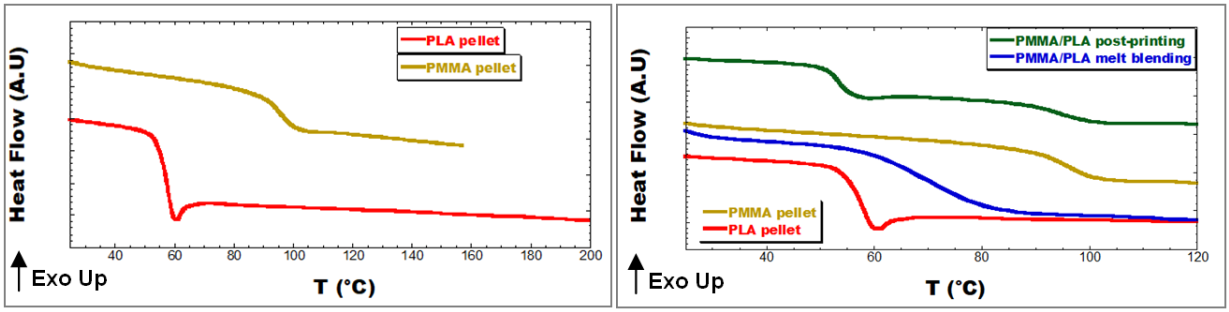 Fig 6. DSC curves of PLA, PMMA and PLA/PMMA after 3D printing and melt blending.
3.3 Effect of infill density on porosity
First, the apparent density of 3D printing specimens was measured. The percentage of porosity is then deduced using the formula:

Fig. 7 illustrates the relationship between porosity percentage and infill density (ID) for the 3D-printed samples. A drastic decrease in porosity is observed as ID increases from 30% to 80%. An infill density of 80% was therefore chosen as the optimum printing parameter value for PMMA/PLA multimaterials.
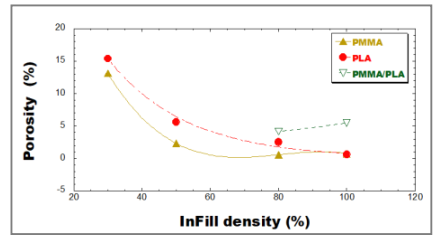 Fig. 7. Porosity percentage versus infill density.
3.4 Temperature profile of materials during 3D printing
Fig. 8 shows the temperature acquisition data for PLA, PMMA and PMMA/PLA during the printing of the fourth layer from the bed at a PCT of 35°C. The temperature of the 3D-printed layers stabilized at the bed temperature. After leaving the nozzle, the PLA, PMMA and PMMA/PLA cooled at a rate of about 1°C/s. For PLA, the temperature of the melt drops from 185°C to 75°C after 2 minutes, while for PMMA and PMMA/PLA it drops from 235°C to 120°C. During the printing stages, the temperature of the layers always remained higher than the Tg of the two polymers.
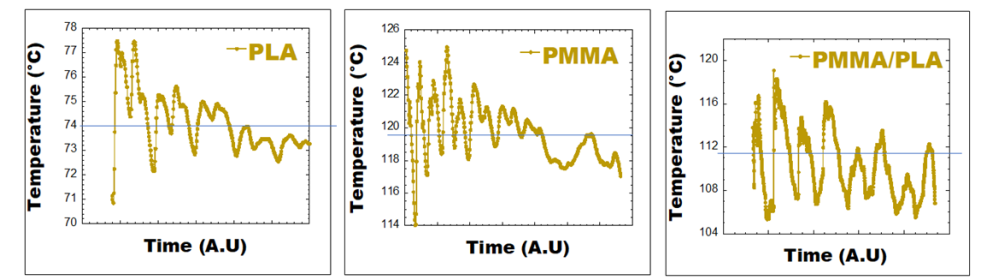 Fig. 8. Temperature profile of PLA, PMMA and PMA/PLA during printing. PCT = 35°C.
3.5 Morphology analyses of the as-printed samples
The SEM morphological properties of the 3D-printed samples at different PCT temperatures are shown in Fig. 9. The PLA presents higher-quality interfacial bonding between the filaments. The PCT of 55°C is more efficient, leading to the formation of a continuous diffusive interfacial weld. Thus, at this high temperature, the space between filaments has practically disappeared. The time-temperature data acquisition shows that the temperature of stabilization after 2 minutes is around 75°C, far above the Tg of PLA (55°C). The PLA chains are in the molten state and the dynamic of interdiffusion is maximal in these conditions. On the other hand, for PMMA, the interface between filaments is more visible at the PCT of 35°C. Raising the temperature of the printing chamber to 55°C had no significant effect on inter-filament welding. Nevertheless, for the PMMA/PLA axisymmetric layers, the increase in the PCT temperature markedly improved the quality of the inter-filament interfaces; the welds are well closed.
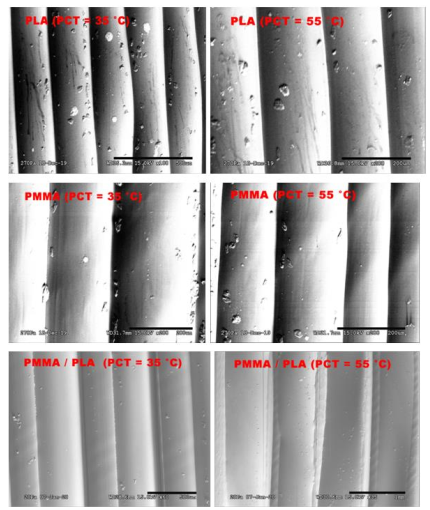 Fig. 9. SEM images of PLA, PMMA and PMMA/PLA after 3D printing at PCTs of 35°C and 55°C.
3.6 Melt rheological analyses
Fig. 10(a) represents the complex viscosity modulus as a function of the pulsation frequency at 185°C for PLA and 235°C for PMMA. At the same temperature, PMMA is much more viscous than PLA, but printing is carried out at 185°C for PLA and 235°C for PMMA. Comparing PLA and PMMA at 185°C and 235°C, respectively, shows that the two polymers have relatively close viscosities between 80 and 100 rad/s over the entire frequency or shear rate range. Fig. 10(b) plots the logarithm of the zero shear viscosity versus the inverse of temperature. The 3D printing temperature has a strong influence on the processability of PLA because of its effect on the shear viscosity, as described by the Arrhenius equation:

where |η*| is the complex viscosity modulus, R is the universal gas constant, T is the absolute temperature, and Ea is the activation energy of melt flow. Fig. 10(b) clearly shows that the shear viscosity varies inversely with the processing temperature. The activation energies are 80 kJ/mol and 140 kJ/mol for PLA and PMMA, respectively.
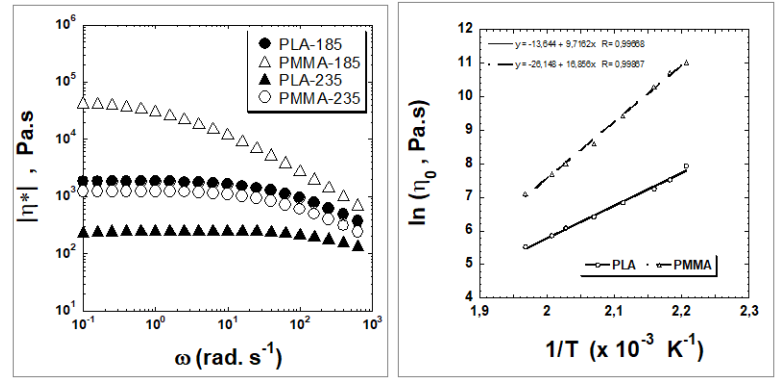
Fig. 10. (a) Complex viscosity modulus versus angular frequency. (b) Logarithm of the zero shear viscosity versus inverse of absolute temperature.
Fig. 11 depicts the healing degree Dh(t) of PLA and PMMA at different temperatures from 180°C to 235°C. The relaxation time τw(T) is determined at different temperatures for PLA and PMMA based on the Cole-Cole model [18]. τw(T) values are calculated from the frequency corresponding to the maxima of '' versus ' curves. In both cases, PL and PMM polymers exhibit instantaneous healing at very low processing times. Regardless of temperature, an increased degree of healing is observed. In fact, Dh(t) increases exponentially as time progresses, but with a slower rate of evolution for PMMA than for PLA. Dh(T,t) is a temperature-dependent parameter that indicates the welding / healing rate due to the interdiffusion of chains between the printing layers at a temperature T. Dh(T) can be represented by the Arrhenius law of healing [19] as defined by:

where B0 is a constant, R is the universal gas constant, T is the absolute temperature and Eha is the healing activation energy, i.e., the minimum energy required for time-dependent healing rate. Eha for PLA is 76 kJ/mol and Eha for PMMA is 148 kJ/mol.
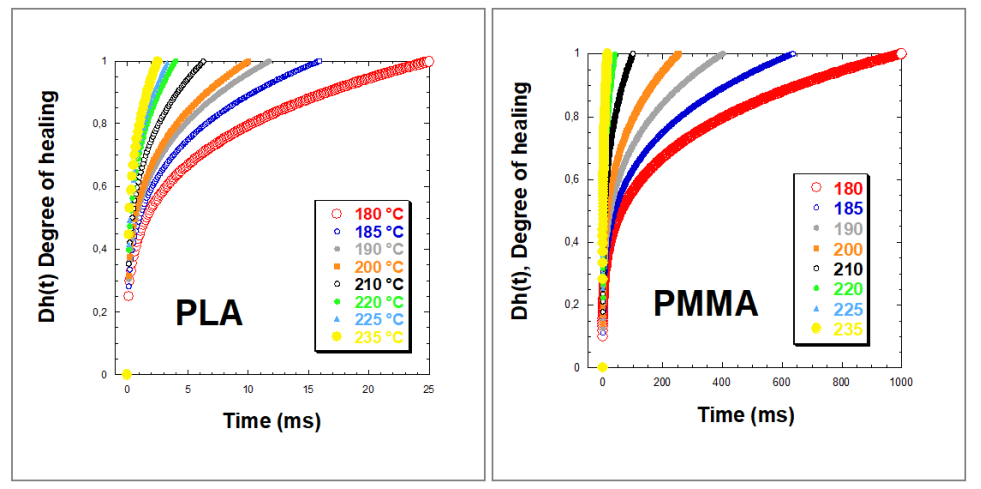 Fig. 11. Degree of healing Dh(t) of PLA and PMMA at different temperatures.
3.7 Relaxation properties based on thermo-mechanical measurements
The temperature dependence of the damping factor (tan δ) of 3D-printed PLA, PMMA, PMMA/PLA and PMMA/PLA melt blends is depicted in Fig. 12. PL shows a peak around 65°C that reflects the α-relaxation temperature correlated to Tg. Because of the frequency effect, there is a difference of about 10°C between the Tg obtained through the tan δ peak that corresponds to the peak temperature of the α-transition (Tα) and the calorimetric glass transition temperature (Tg). PMMA presents a thermomechanical transition (Tα) at °C compared to 96°C obtained by DSC. The 3D-printed PMMA/PLA samples processed at a PCT of 35°C exhibit two clear peaks corresponding to the α-transition (Tα) of PL and PMM . For the PMMA/PLA specimens printed at a PCT of 55°C, the peak corresponding to the PLA phase shifts toward an intermediate temperature. This means that the relaxation of PLA chains is influenced by the neighboring stiff PMMA chains, indicating the presence of a large interface of interdiffusion and chain entanglement, as observed previously by SEM analyses. On the other hand, the molded PMMA/PLA samples exhibit a single relaxation peak that reflects the mutual miscibility between PMMA and PLA when they are prepared by blending in the melt state.
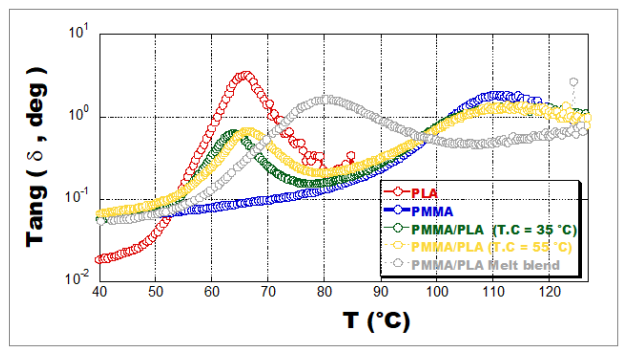 Fig. 12. DMA results for PLA, PMMA and PMMA/PLA after 3D printing and injection molding.
3.8 Mechanical properties of the samples
Fig. 13 presents the evolution of the flexural strength σ (MPa) of 3D-printed PLA and PMMA at a PCT of 35°C versus the infill density. The flexural strength increases with infill density and then levels off when infill density values reach about 80%. This is caused by a decrease in porosity for higher infill densities, as proved earlier via pycnometry. However, the infill density affects the failure strength to a lesser degree for PMMA than for PLA, because of the greater healing activation energy of PMMA. The σ of 3Dprinted PMMA/PLA parts is close to that of PLA. This indicates that the boundary between PLA and PMMA layers in the multimaterial part has been strengthened compared to the 3D-printed PMMA monocomponent.
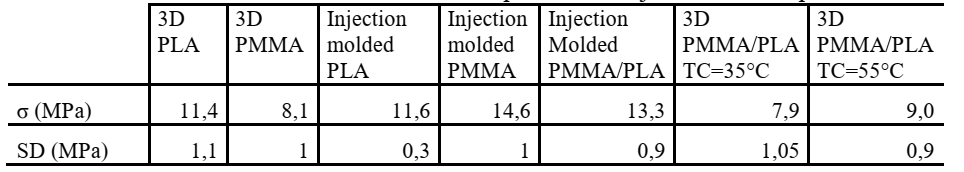
The interlaminar shear stress (ILSS) values of different 3D-printed and molded parts are given in Table 3. Compared to PLA and PMMA/PLA specimens, 3D-printed PMMA exhibits lower ILSS values, indicating lower interfacial adhesion between the printed PMMA layers. The SEM images of the fracture facets made after the short-beam flexural tests show a less cohesive fracture for PMMA than for PLA (Fig. 14), in agreement with the rheological modeling discussed above. In fact, the healing activation energy of the PMMA is double that of PMMA. More surprisingly, the ILSS of PMMA/PLA axisymmetric multilayers is between those of PLA and PMMA. This proves that the boundary interface between PLA and PMMA printing surfaces is more cohesive than the boundary interfaces in the PMMA.
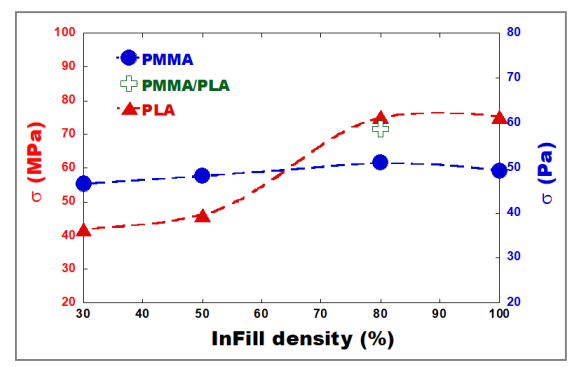 Fig. 13. Flexural strength versus infill density. The PCT temperature is 35°C.
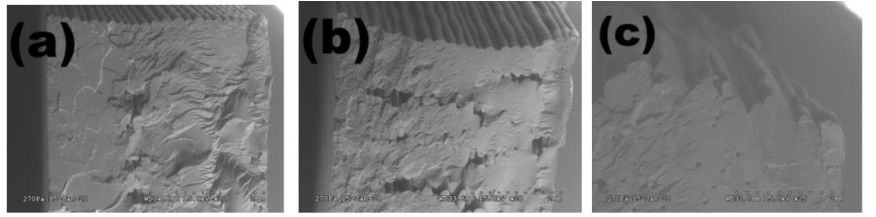 Fig. 14. Fracture surface after the short-beam shear test. (a) 3D PLA, (b) 3D PMMA and (c) 3D PMMA/PLA specimens. The PCT temperature is 35°C.
Table 3. ILSS data of 3D-printed and injection-molded parts.
4. Conclusions
Multimaterial PMMA/PLA parts prepared by an FGF AM process were successfully developed using an original gradientconcept. The PMMA and PLA monocomponent materials were first printed in 3D to determine the optimal printing conditions. Molecular, rheological, thermal, morphological and thermomechanical measurements showed that the healing activation energy is an important factor for controlling interfacial interdiffusion between printed layers. The flexural mechanical properties depended on the infill density but much less on the printing chamber temperature. Interlaminar shear stress bending experiments confirmed that the macro-mechanical properties of the printed materials obtained depended on the degree of cohesion inter-layers. Interfacial cohesion is higher for PLA, which forms soft chains (low Tg), compared to the stiffer PMMA. Even more interesting, PMMA/PLA axisymmetric multilayers exhibit interfacial properties situated between those of the PLA and PMMA monolayers. The rheological modeling of the chain interdiffusion involved in the case of interfaces/interphases composed of axisymmetric PMMA and PLA chains during FGF 3D printing will be the subject of another paper in the near future. Finally, the proposed workflow in the present study can be used for manufacturing other 3D-printed multimaterials with different composition ratios and different gradient functional properties in view of numerous industrial applications.
Acknowledgements
The authors are grateful to M. Arli and H. Lakhdar (INSA Lyon) for their assistance with scanning electron microscopy imaging and temperature data acquisition. We also thank R. Brunel for his help with the short-beam shear strength experiments.
