1 Introduction
Long fiber reinforced thermostable thermoplastic composites have several advantages, such as high thermo-mechanical properties, high chemical resistance and the possibility of hot stamping and welding assemblies after consolidation, contrary to thermoset composites.
However, processing such composites is a particular issue due to the high melting temperature and high viscosity of thermoplastic matrices. Indeed, at the molten state, high molar mass macromolecules exhibit a non-Newtonian viscosity that is 100 to 1000 times higher than uncured thermosets [1]. Conventional Liquid infusion route (RTM or LRI) is no longer possible with polymerized thermoplastic polymers and infusion of reinforcing yarns as described by Darcy’s law requires the application of high pressure. The consequence is slow impregnation behavior and non-negligible solid-fluid interaction effects during composites consolidation [1,2].
Faced with this problematic, alternative composite products have been developed and various combinations of reinforcement and matrices are now available. The main proposed solutions are commingled fabrics, films stacking, powdered yarns or fabrics, or co-woven fabrics. The common point between these different solutions is that the polymer is placed around or within the fiber yarns in order to accelerate impregnation and thermoplastic laminates consolidation. Even so, high pressure is needed to fully consolidate such semi-finished materials and autoclave manufacturing is no longer efficient.
Among thermoplastic matrices, semi-crystalline poly-ether-ether-ketone (PEEK) is relevant because of its glass transition temperature of 143°C and a service temperature up to 200°C. A temperature of 380 to 400°C is however required to process PEEK composites, and this organic polymer may suffer degradation during each transformation operation.
PEEK degradation above the melting temperature have been many times reported in literature, such as Day et al. [3–6] who have shown that degradation of PEEK results simultaneously in chain cleavage and formation of crosslinks between adjacent aryl groups of polymer chains. These mechanisms of degradation have been then described in details by Patel et al. [7]. They showed that PEEK was relatively stable in a non-oxidative environment at 400°C for periods up to 6h, but that glass transition temperature and crystallization behavior were rapidly affected under air conditions. Different types of characterization have been used by the authors to describe and confirm PEEK degradation: FTIR and UV-visible spectrophotometry, gel permeation chromatography (GPC), viscosimetry in solution, differential scanning calorimetry (DSC) and mechanical tests [8–12]. Phillips et al. [13] also confirmed the dominating effect of crosslinking on viscosity and correlated the thermal exposure to air with the compression molding processing of AS4/APC-2 composites. They concluded on the definition of an out-of-autoclave processing limit of carbon/PEEK composites regarding the thermal stability of the matrix.
Even if these studies on PEEK thermal stability propose some guidelines for out-of-autoclave manufacturing of PEEK composites, the authors always assume that the matrix is non-degraded with stable properties before composite processing. This assumption is pertinent when using neat PEEK or pre-impregnated materials made by solvent impregnation (AS4/APC-2 tapes), but the fabrication of complex semi-finished materials requires several transformation operations that may influence the viscous behavior of the matrix and affect the processability of the materials.
To address this issue, the consolidation behavior of two PEEK based commingled semi-finished products provided by two different suppliers have been investigated. Both were manufactured from aligned AS4 carbon and PEEK yarns but the first product referred as the NCF1 has a lower commingling level than the second one identified as the NCF2. Differences in the impregnation behavior were then investigated by analyzing the polymer integrity in order to assess the effect of degradation on composite consolidation.
2 Experimental
2.1 Materials
Two different carbon/PEEK semi-finished products were investigated. Both are based on the same PEEK grade from Victrex (150). These quadriaxial preforms were prepared by stitching together the four commingled unidirectional layers. These two materials were compared with a 2-faces powdered carbon fabric also based on the same PEEK grade (150).
2.2 Consolidation by thermo-compression
Consolidation of carbon/PEEK composites was performed with a thermo-compression molding pilot plant equipped with the 3iTech® technology developed by Roctool. The thermo-compression pilot plant consists of a vertical compression press with a capacity of 1000 kN, a 200 kW induction generator, a cooling unit that can deliver water at a flow rate of 150 L.min-1 and an inductive mold designed by Roctool. All the equipment are controlled from an operating panel that centralizes the data (mainly mold temperatures and applied press load) from the different equipment. The 3iTech® mold used in this study is a plane mold designed for composite laminates manufacturing with a molding surface of 400x400 mm2. This molding process was used to manufacture 200x200 mm2 composite plates of each reference. The thermo-compression cycle applied consisted in a heating phase at 42°C.min-1 until 400°C, an isotherm stage at this temperature during 5 to 30 min under a pressure of 9 to 50 bars, and finally in a cooling stage at 20°C.min-1. The void ratio of all composites was then assessed from thickness measurements taken at 13 identical locations on the plates after consolidation, compared to theoretical thickness obtained with the initial and final areas of the plate, the number of layers of semi-finished product, the fiber and matrix surface densities and the fiber and matrix densities. This method to determine the void ratio was compared to the acid digestion technique, achieved following the EN2564 standard.
2.3 Characterizations of the PEEK matrices
In order to analyze the properties of the matrices, the NCF1 and NCF2 PEEK filaments were removed manually from the different semi-finished products and compared to the Victrex grade 150, provided as a coarse powder (Ref).
The production of micrometer filaments in the spinning process requires a drawing operation which is only possible after applying a sizing on the surface of the extruded yarns. A part of the NCF1 and NCF2 filaments was therefore washed in an ultrasonic acetone bath for 1 h to remove the sizing on the surface of the filaments.
Molecular weight distribution of the semi-finished product matrices were determined by Gel Permeation Chromatography (GPC). Measurements were performed by PEAKEXPERT Company on a Waters 2695 device with a Waters 2414 RID detector.
FTIR spectra were measured in attenuated total reflection (ATR) mode in the wavelength range from 400 to 4000 cm-1 using a Nicolet 6700 instrument from Thermo Scientific. The spectra are the results of 16 recordings with a resolution of 4 cm-1. The results have been normalized by using the absorption band at 1599 cm-1 as a reference, which corresponds to elongation of aromatic C=C bond. FTIR spectra (ATR) were also collected on the NCF1 and NCF2 sizing agents. They were obtained after Soxhlet extraction with diethyl ether during 4 h. At the end, the solvent was evaporated to dryness and extracts were weighed in order to estimate the sizing rate.
Matrices filaments were observed under Scanning Electron Microscopy (SEM) using a Hitachi TM3030Plus Tabletop SEM. The diameters of 20 different filaments were measured and averaged to obtain a representative diameter for each composite product.
Calorimetry measurements were performed with a DSC1 Mettler Toledo. For all experiments, aluminum sealed pans filled with 7±1 mg of PEEK were used. The samples were subjected to 4 heating and cooling cycles under nitrogen, the first one was applied to erase the thermal history. The applied treatment consisted in heating the sample at 20°C.min-1, then in holding it at 400°C during 20 min to cause degradation (only 5 min for the first cycle to erase the thermal history), and finally in cooling it at a constant rate of 10°C.min-1 to induce PEEK crystallization in identical conditions. During this last stage of the thermal treatment, the crystallization temperature (Tc) was measured. Tc has been taken from the maximum of the crystallization peak.
For rheological measurements all the samples (powder and filaments) were prepared with the same method to avoid morphological effects. Filaments were first ground using a Retsch ultra centrifugal mill ZM 100 with a 0.5 mm sieve. The mill was cooled with liquid nitrogen to avoid overheating. Then the powders were compacted with a force of 29 kN during 1 min using an Instron press 5567 and a cylindrical die with a diameter of 20 mm. The obtained tablets were consolidated using a thermo-compression molding pilot process. The thermo-compression cycle applied consisted in a heating phase at 42°C.min-1 until 370°C, an isotherm stage at this temperature during 3 min under a force of 125 kN, and finally in a cooling stage at 50°C.min-1. Rheological measurements of PEEK were performed on these consolidated specimens with a Mars Haake rheometer using a plate-plate geometry in oscillatory mode with disposable alumina plates of a diameter of 20 mm. During isothermal experiments, constant shear and shear rates respectively of 0.01 and 6.28 s-1 (1 Hz) were applied, at 400°C in air. In order to guarantee the linear viscoelastic domain, strain sweep tests were previously performed so that the complex viscosity can be simply determined from the elastic and viscous moduli G’ and G’’.
3 Results and discussion
3.1 Consolidation analysis
The Fig.1 presents void ratio of the NCF1, the NCF2 and powdered fabric after consolidation, obtained by two methods: thickness measurements and acid digestion. The thickness measurements method seems to over-estimate void ratio compared to the acid digestion method, but remains a good first approach of void ratio estimation. The NCF1 and the NCF2 have a high void ratio after thermo-compression at 400°C during 10 min under 9 bars, above 10%, which is not acceptable for high performances composites. This poor consolidation will result in reduction of the mechanical properties of the final composites. This result has been confirmed by optical observations and is quite surprising since polymer flow distance for impregnation is highly reduced in commingled semi-finished products [14–17].

Fig. 1. Void ratio of the different semi-finished products after consolidation at 400°C during 10 min under 10 bars, from thickness measurements (full line) and acid digestion technique (dotted line)
One hypothesis could be that the process of consolidation is not controlled. In Fig.2, one example of thermo-compression cycle is presented. It can be seen that the different monitored parameters follow the processing conditions. Moreover, when repeating tests in the same conditions or in increasing time or pressure, the same behavior is obtained. Increasing pressure decreases the void ratio, as shown by different authors this phenomenon is described by the Darcy's Law [1,18], but it still remains above 10%, even when using pressures up to 50 bars.
Increasing the consolidation time up to 30 min seems to have no effect on void ratio which also remains above 10%. Beyond 30 min, degradation may occur. Different temperatures, between 380 and 440°C have been also tested but they did not lead to better consolidation level. In addition, a temperature above 400°C is critical for PEEK integrity.

Fig. 2. Monitoring of temperature and applied pressure during a thermo-compression cycle of 400°C during 10 min under 9 bars
From this result, it can be stated that the best initial form of the semi-finished product is not necessarily optimal for consolidation. It can be supposed that manufacturing of semi-finished products is responsible for modifications causing the poor consolidation quality. Manufacturing of commingled semi-finished products requires extreme conditions for filaments spinning with a temperature about 400°C and a draw ratio about 100 [19,20]. At this temperature, degradation can therefore occur and may be enhanced in addition by the drawing or sizing agents.
3.2 Characterization of the initial state
In order to understand possible modifications of PEEK matrix during transformation from neat PEEK to commingled semi-finished products, the different matrices filaments of the NCF1 and the NCF2 were characterized and compared to the initial Victrex PEEK grade (Ref), provided as a coarse powder.
The molar mass distributions of the NCF1 and the NCF2 matrices filaments are compared to the reference in Fig.3. Less than 2% of insoluble were measured for all samples. It can be noticed a slight shift towards lower molar mass for the NCF1 and the NCF2 compared to Ref.
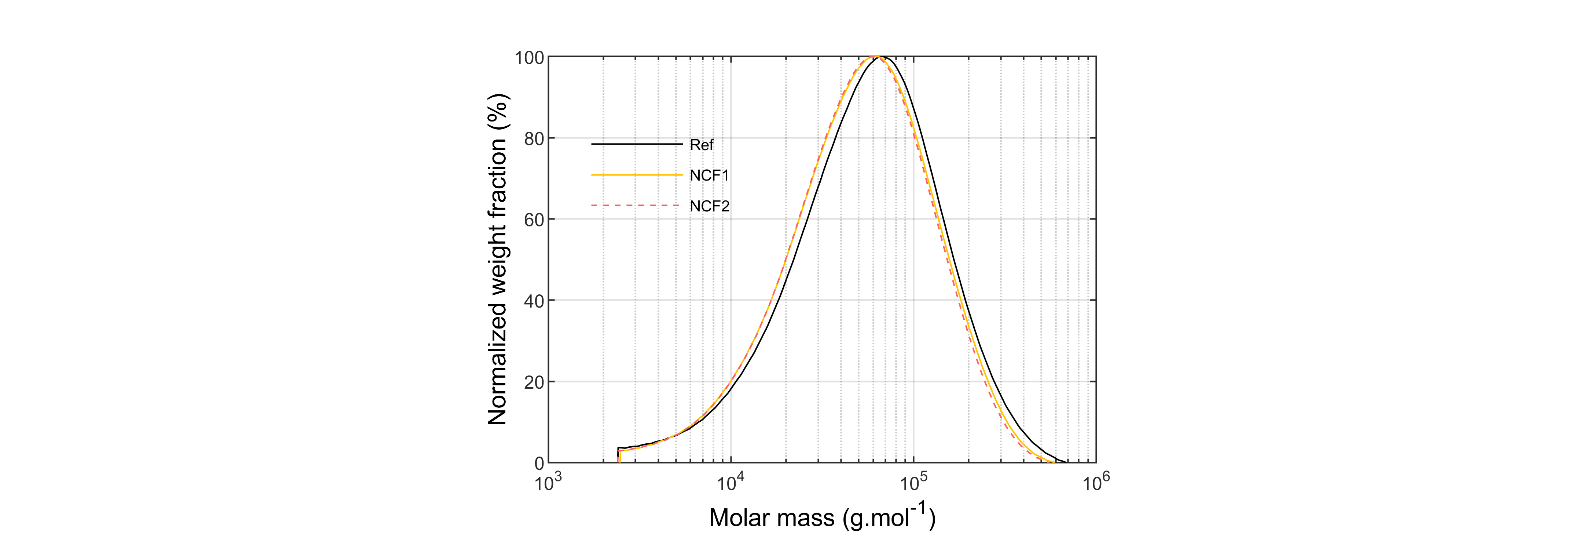
Fig. 3. Molar mass distributions (normalized weight fraction) of Ref, NCF1 and NCF2
In Tab.1 the weight average molecular weight (Mw), the number average molecular weight (Mn) measurements and the polydispersity index (IP) are presented. It can be observed a decrease in Mw (9% for the NCF1 and 11% for the NCF2) as well as in the IP (7% for the NCF1 and the NCF2), but a relatively stable Mn compared to the reference (0.3% for the NCF1 and 3% for the NCF2).
Table 1. GPC results. Weight average molecular weight (Mw), number average molecular weight (Mn), polydispersity index (IP)

The GPC results therefore show molecular differences between neat (Ref) and transformed PEEK (matrices of NCF1 and NCF2). These differences are due to chain scissions induced by the extrusion of neat PEEK into NCF1 and NCF2 filaments. In the literature, the authors have actually already noticed a shift of molar mass distributions towards lower molar mass for PET, PLA, PA6 and PP for example [21–24]. NCF1 and NCF2 filament diameters are 25 and 18 μm respectively. As oxygen enhances PEEK degradation [9], a higher surface-to-volume ratio may have increased degradation, and be a reason of the lower Mn and Mw of NCF2.
FTIR spectra of the semi-finished products and the PEEK reference (Ref) are presented in Fig.4. Between 2800 and 3000 cm-1, two IR absorption bands centered at 2850 and 2935 cm-1 appear for NCF1 and NCF2 that can be attributed to the stretching vibrations of the aliphatic C-H bonds. In the hydroxyl zone between 3200 and 3700 cm-1, a little increase of the large absorption band attributed to stretching vibrations of the O-H bonds of aliphatic groups can also be observed.
Soxhlet extractions were carried out on the NCF1 and the NCF2 to separate filaments from the sizing agents. Extracts weighing after Soxhlet extraction have allowed to estimate the sizing rate of 0.45% and 0.27% for the NCF1 and the NCF2 respectively. FTIR analysis of these residues show that the NCF1 and the NCF2 are covered with sizing agents of epoxy and polyethylene glycol groups respectively.
When comparing the NCF1 and the NCF2 spectra with those of sizing agents, it can be seen that the two IR absorption bands centered at 2850 and 2935 cm-1 have the same profile. Sizing agents have indeed a specific absorption band in the hydroxyl zone. The differences observed on FTIR spectra can therefore be attributed to the presence of sizing agents. Because of the predominant effect of sizing on the spectra, the reduction of GPC indicators that are observed for the NCF1 and the NCF2 matrices could not be identified using FTIR technique. The presence of sizing agents may have hidden the effect of the molecular modifications and the presence of degradation by-products in small quantity and in the same range of wavelength [8,9].
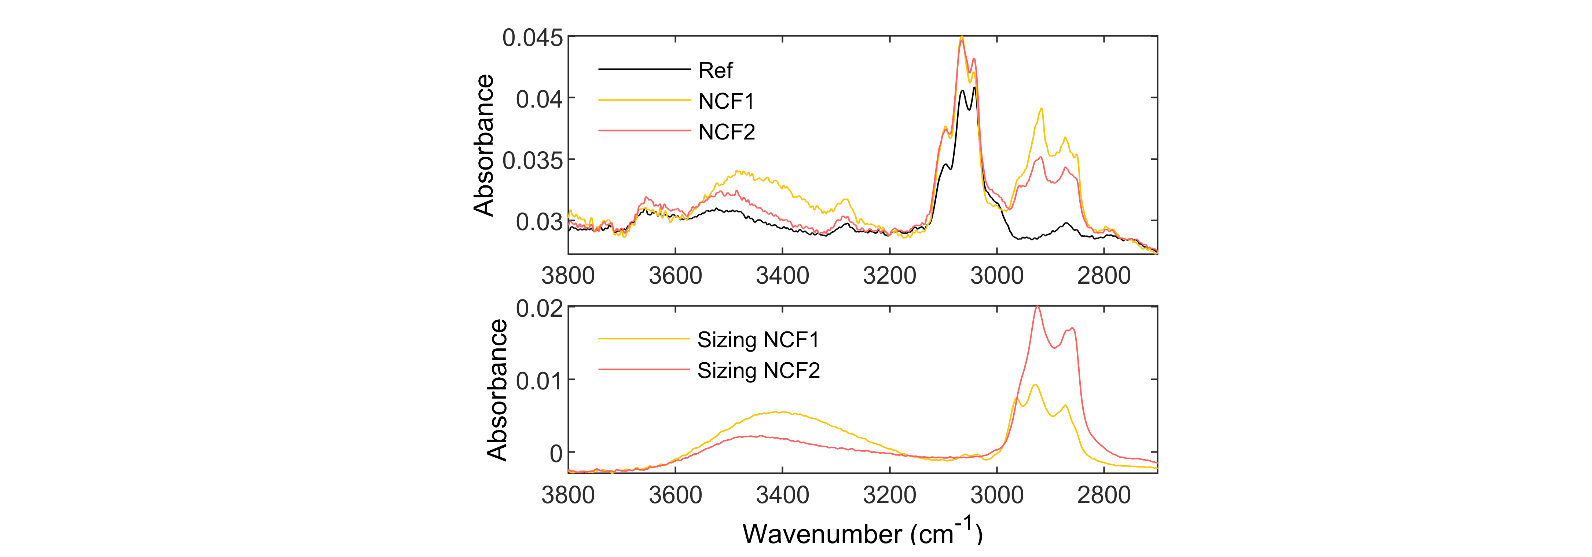
Fig. 4. FTIR spectra: on the top the different semi-finished products (NCF1 and NCF2) and the neat PEEK (Ref), on the bottom the sizing agents of NCF1 and NCF2
The NCF1 and the NCF2 have a different molecular state compared to the neat PEEK (Ref) with a molar mass distributions shifted towards lower molar mass and sizing agents at the surface of matrices filaments. The NCF1 and the NCF2 have different sizing agents and filaments diameters. At this stage, it is not possible to conclude whether this is the modified molecular structure of extruded PEEK filaments or the nature of the sizing agent that is responsible for low processability of the semi-finished products during thermo-compression.
3.3 Effect of the initial state on the degradation kinetics
To understand the effect of the initial state on the degradation kinetics during consolidation, DSC and rheometry measurements were carried out on the NCF1 and the NCF2 matrices filaments.
The crystallization temperatures (Tc) as a function of DSC cycles are presented in Fig.5 and Fig.6. The samples were subjected to 4 heating and cooling cycles, the first one was applied to wipe the thermal history. The applied treatment consisted in heating the sample at 20°C.min−1, then in holding it at 400°C during 20min to cause degradation (only 5min for the first cycle to wipe the thermal history), and finally in cooling it at a constant rate of 10°C.min−1 to induce PEEK crystallization in identical conditions. During this last stage of the thermal treatment, the crystallization temperature (Tc) was measured. Tc has been taken from the maximum of the crystallization peak. It can be seen that the crystallization temperature (Tc) of neat PEEK (Ref) increases slightly with the number of heat treatment cycles, which signifies that neat PEEK undergoes chain scissions during these four heat treatment cycles of 20 min at 400°C. However, the crystallization temperature of the NCF1 and the NCF2 filaments decreases significantly along DSC cycles. This lower ability to crystallize indicates that degradation has occurred through crosslinking [25]. This phenomenon is already significant after two cycles for the NCF1 (loss of 10°C), while for the NCF2 the decrease is slower. On the other hand, the NCF1 has a crystallization temperature 2°C lower than the Ref after the first cycle unlike the NCF2 which has a crystallization temperature 10°C lower. The NCF2 filaments could be more rapidly degraded after the first DSC cycle compared to the NCF1 and then not degrade more. The lower initial molecular weight may also be the reason of such a lower initial crystallization temperature.
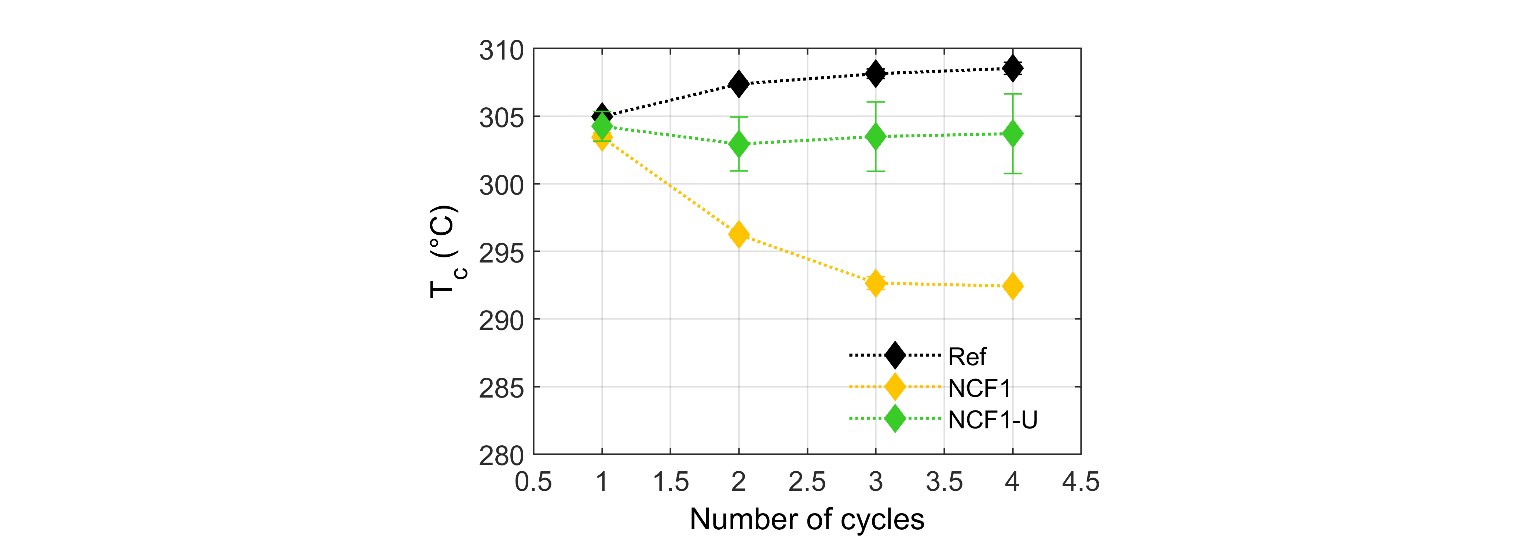
Fig. 5. The crystallization temperature Tc (°C) as a function of number of cycles for the NCF1 and the NCF1-U semi-finished products, with and without sizing agents respectively and the neat PEEK (Ref)
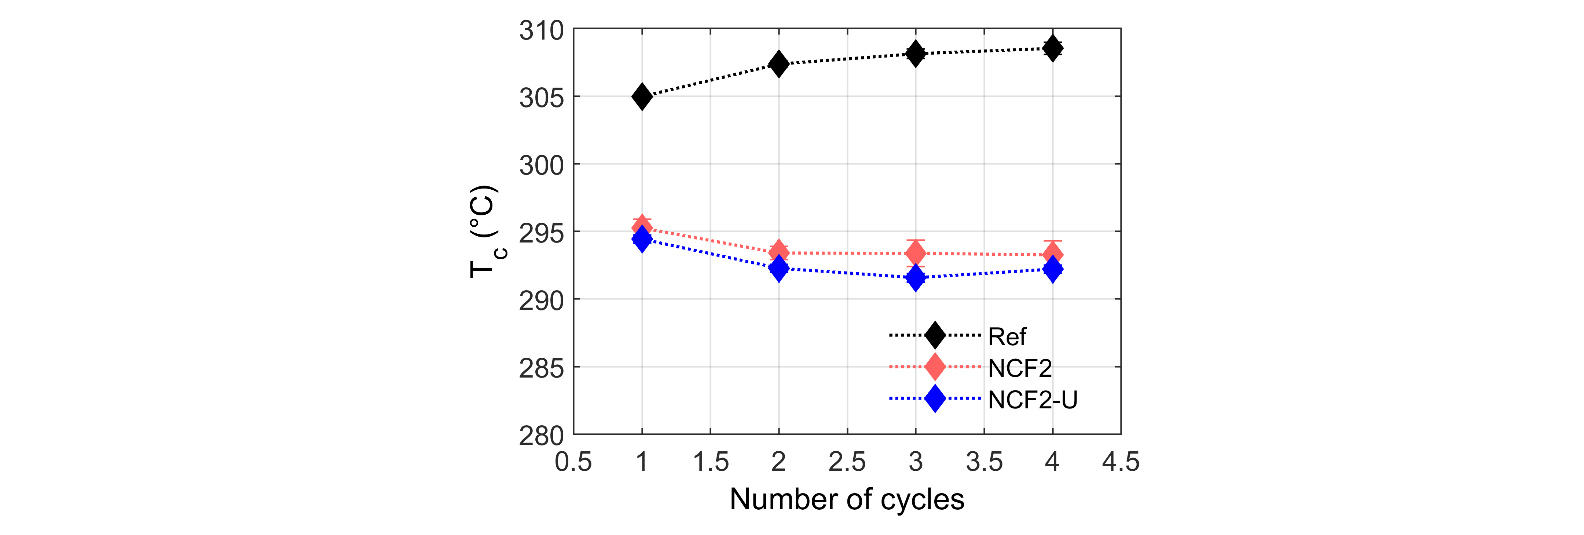
Fig. 6. The crystallization temperature Tc (°C) as a function of number of cycles for the NCF2 and the NCF2-U semi-finished products, with and without sizing agents respectively and the neat PEEK (Ref)
When the sizing agents are removed from the NCF1 filaments, the crystallization temperature remains stable (NCF1-U). This observation indicates that the sizing agents play an important role in the degradation process and appear to increase this effect. For the second semi-finished products, removal of the sizing agents (NCF2-U) seems to have no effect on the crystallization point. This behavior could be due to incomplete removal of the sizing agents.
The decrease in crystallization temperature as the number of cycles at 400°C increases may be due either to degradation due to the extrusion itself or to a reaction with sizing agents or both, but in any cases this phenomenon is a consequence of neat PEEK transformation into filaments. Moreover, the DSC cycles which undergoes the Ref and which induces the increase of crystallization temperature linked with chain scissions, could be similar to the transformation of neat PEEK into filaments. In this way, chain scissions could be responsible of the shifted molar mass distribution towards lower molar mass. Chain scissions are the first step of degradation which then keep on and contribute to the crosslinking reaction. The NCF1 and the NCF2 are undergoing the second step of degradation mechanism during DSC cycles: crosslinking. This phenomenon is accentuated by the presence of sizing agents.
Rheological measurements were carried out at 400°C to investigate the evolution of viscosity during the consolidation process. Fig.7 shows that the viscosity of Ref increases slowly at 400°C in the early stages and then rapidly increase after 25min. This phenomenon corresponds to the crosslinking of polymer chains, similarly to the crosslinking of thermosets, as observed in literature [11,13,26].
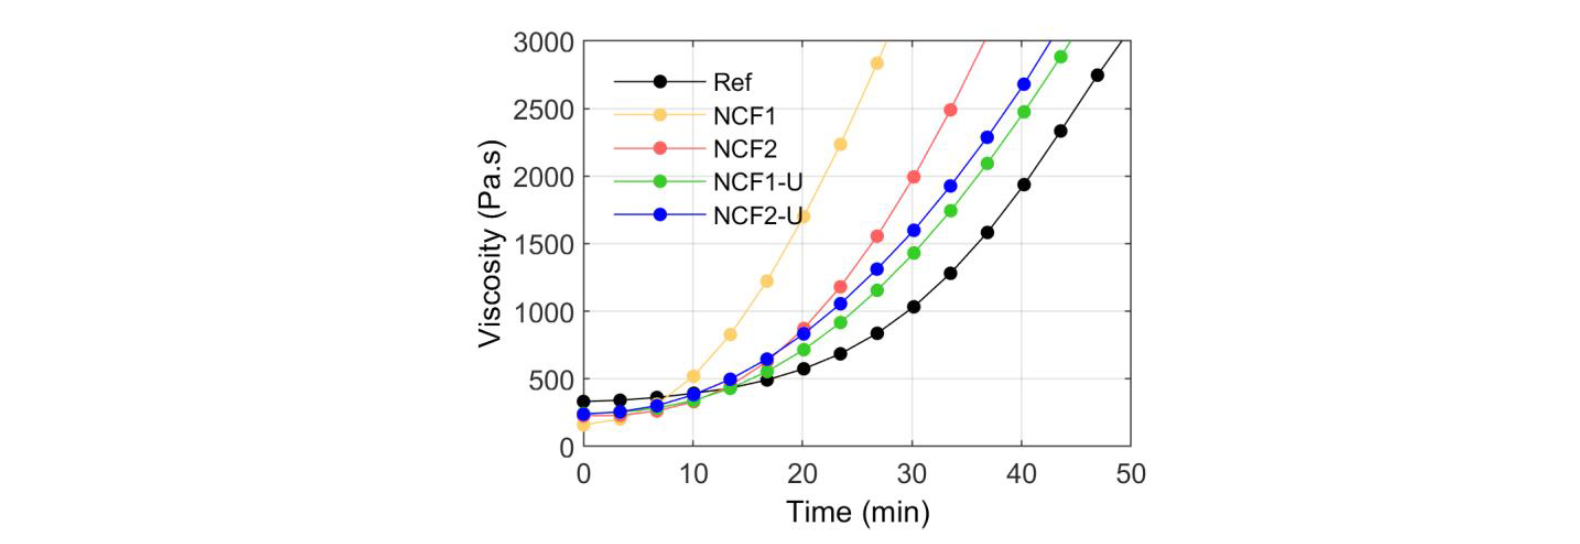
Fig. 7. Evolution of the viscosity with time at 400°C for both PEEK filaments (NCF1 and NCF2), the neat PEEK (Ref) and the NCF1 and the NCF2 filaments without sizing agents (NCF1-U and NCF2-U)
The viscosity of the NCF1 and the NCF2 triples in about 10 and 12 min respectively whereas for the Ref it triples in about 22 min. In this way, the NCF1 and the NCF2 are degraded more rapidly than the Ref.
NCF1 seems to degrade faster than NCF2 because its viscosity increases in a shorter period. However, the initial viscosity of NCF1 is lower than NCF2. This difference may be due to different type and ratio of sizing agents on filaments that could increase or decrease the viscosity.
When the sizing agents are removed (NCF1-U and NCF2-U), the semi-finished products degradation seems to be slower. For the NCF2, the effect is lighter than for the NCF1, as seen in DSC results this could be due to incomplete removal of the sizing agents. This phenomenon had already been identified by Denault at al. [27]. In fact, even in small amount (less than 0.5% in mass), sizing agents enhance the degradation process by reacting with the degradation products during the consolidation step.
The increase of viscosity is directly linked to crosslinking and the evolution of the storage (GS) and loss (GL) moduli over time provide additional information about this phenomenon. The Fig.8 presents an example of the evolution of GS and GL over time for the NCF1 and Ref. As explained by Chan et al. [26], the intersection point of GS and GL curves can be used as an indicator of the rate of crosslinking. The Tab.2 summarizes the time of this intersection point for the different materials. The intersection occurs after only 11 and 16 min for the NCF1 and the NCF2 respectively, whereas it appears at 31 min for the neat PEEK (Ref). It can be stated that the NCF1 has the higher rate of crosslinking, than NCF2 and neat PEEK. This conclusion confirmed that the NCF1 is more rapidly degraded than the NCF2 and then the neat PEEK (Ref) in the rheometer.
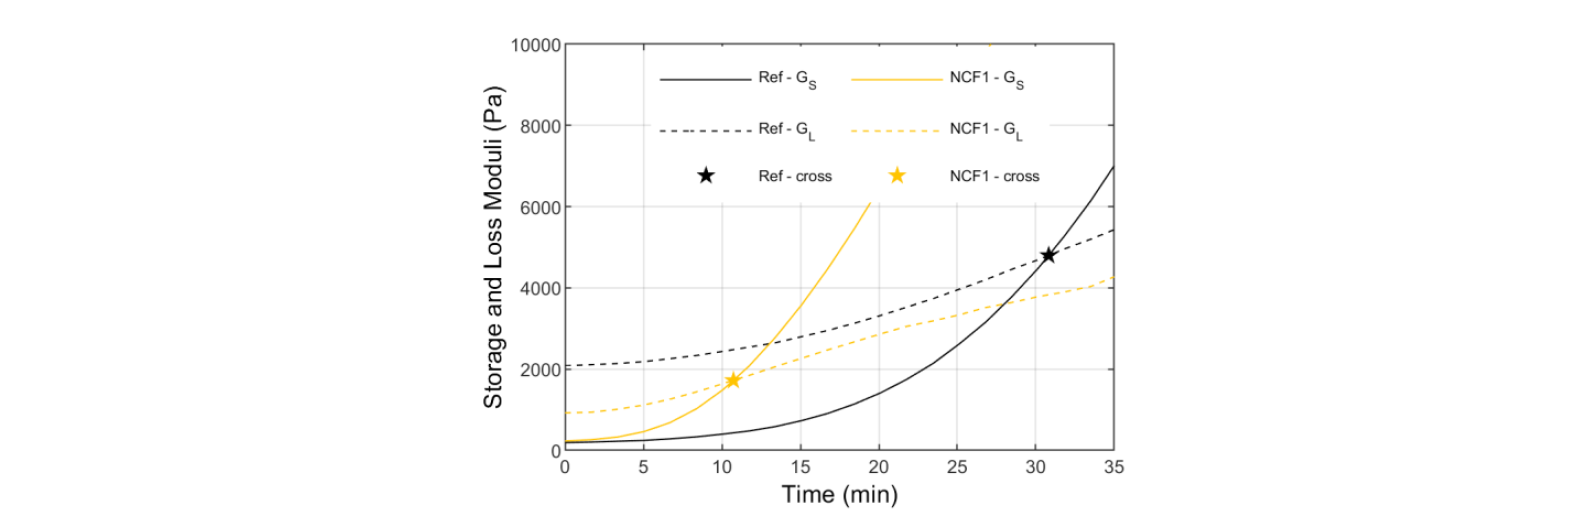
Fig. 8. Example of cross-point (stars) between the storage (GS) and the loss moduli (GL) at 400°C for the NCF1 and the neat PEEK (Ref)
Table 2. Time at the cross-point between the storage (GS) and the loss moduli (GL)

4 Conclusion
Degradation properties of two PEEK-based commingled semi-finished products have been compared to a powdered fabric, with the same polymer grade. PEEK filaments, before implementation, were characterized by GPC and FTIR analyses. The results showed that filament extrusion induced slight changes in the molecular structure compared to the neat PEEK and confirmed the presence of sizing agents on the surface of the filaments.
DSC and rheological measurements confirmed the significant influence of sizing on degradation behavior of PEEK filaments. At 400°C, the crystallization temperature decreases rapidly because of crosslinking reaction. In addition, the viscosity of the NCF1 and NCF2 filaments increases significantly in less than 15 min, which limits the impregnation of the reinforcing fibers. Consequently, increasing time or temperature for improving the consolidation process becomes useless because crosslinking has already occurred and the viscosity is out of the impregnation range.
In conclusion, the chemical nature of the sizing, the morphology of the filament but also the thermal history during the melt spinning process are the main parameters that lead to degradation during the consolidation step.
Future works will enable to investigate and assess the consequences of the melt spinning process on the PEEK integrity: yarns at different stages of the melt spinning process will be characterized and compared with neat PEEK.
Acknowledgements
The authors wish to thank the IFTH for their support in the characterization of yarn sizings and the Region Occitanie for their financial support.
