1 Introduction
The design possibilities using freeform bending are numerous. Compared to other bending technologies, freeform bending with moveable die is able to produce parts with different radii or a constant curvature progression within one manufacturing step. To bend the semi-finished product, the moveable die has to be deflected and tilted while a constant feed is provided to the tube or profile [1]. This creates a moment that forces the part to bend [2]. The amount of deflection varies for different materials, profile cross-sections and tool setups due to material properties and varying process forces. To be able to calculate a motion profile, two specific curves are needed that describe the deflection and tilting angle needed to achieve the target bending radii. Currently, these curves are generated with numerous bendings, measurements and fitting of a predefined function in a black box system. To fit this function a fixed number of data points is taken into account. Therefore, the quality mainly depends on the accuracy of the measurements of the parts and the selection of the fitting points. Furthermore, the predefined function is not always suitable to fit sufficiently for the given setup and the semi-finished product which leads to artificial limitations and reduced reproducibility of the calibration.
In this paper, a new method consisting of three steps is shown to develop the two specific curves for the kinematic calculations namely deflection and tipping angle of the die. The method is designed to use as less simulations and real bending tests as possible while simultaneously covering a wide range of validity. This ensures a nimble and reproducible development and calibration process independent of the boundary conditions and suitable for numerous setups and materials. To achieve the predefined requirements a different fitting function is used: The Piecewise Cubic Hermite Interpolating Polynomial (PCHIP). This functions creates a curve that interpolates between n control points connected by n -1 segments, which consist of cubic polynomials merging continuously differentiable into each other [3]. This ensures a sufficient fit compared to the fit with a predefined function because all measured data points are taken into account.
In the following sections the required experimental setup and the boundary conditions are briefly described. This is followed by the explanations of the methodology and the overview of the results. The paper concludes with a summary of the research and an outlook for further investigations.
2 Experimental Setup
The experimental setup consists of four aspects: The semi-finished product, the boundary conditions for the bent parts, the tool setup and the simulation model. They are briefly described in the following sections.
2.1 Semi-finished product
Circular tubes made from P235TR1 steel are used for the investigations. They have an outer diameter of 42.4 mm, a wall thickness of 2.6 mm and scraped weld seams on the outside and on the inside. They comply with the standards DIN EN 10217-1 [4] regarding tolerances and alloy composition. The yield strength 𝜎𝑦 is 235 MPa and the average tensile strength Rm is 430 MPa. The tubes are typical semi-finished products for any kind of tube bending process and are not restricted to freeform bending applications.
2.2 Boundary conditions for the bent parts – parametric motion profile
A parameterized bending line describes the individual parts used for the experiments. Several sections divide the line, which are arranged as follows:
The constant arc has an arc length of 350 mm for all parts. The length of the transition zones are calculated from the feed speed and the time required for the translation of the die. Straight areas are provided before the first and after the second transition zones to ensure manufacturability and a better handling during the measurements. The axis speed of the moving die is 40 mm/s and the feed speed is a constant 100 mm/s. All tests and simulations are performed according to this definition. The diagrams for the movement of the machine axis are shown in Fig. 1. The circles each mark a point in time at which a command for a movement is given. The marked points are the same for all diagrams.
Fig. 1. Motion profile diagrams of the machine axes
2.3 Tool setup
The experiments are performed on a NSB090 freeform bending machine made by J.Neu GmbH [5]. Fig. 2 shows the sectioned CAD assembly of the toolset. It consists of the moveable die, the holding die and the mandrel. The moveable die can translate on the plane perpendicular to the feed direction. Furthermore, the moveable die rotate around all three Cartesian axis. The clearances between the moveable die and the tube, the holding die and the tube and between the mandrel and the tube can vary due to deviations within the limits of the tubes’ standards defined in EN 10217-1 [4]. The distance between the dies is fixed.
Fig. 2. Sectioned tool setup used for the investigations
2.4 Simulation model
The explicit FEM simulations are performed with LS-DYNA according to Beulich [6]. To reduce computational effort and to show robustness of the method described in this paper the simulation model is simplified. Therefore the material is modelled with the keyword *MAT_PIECEWISE_LINEAR_PLASTICITY. The shell elements are reduced integrated Belytschko-Tsay elements [7]. Tool parts are modelled as rigid bodies, the tube is modelled as its midsurface. Clearances and positions within the assembly correspond to the real tool setup. These measures are taken into account when the kinematics are calculated. The explicit forming simulations are followed by implicit springback simulations. The focus is not on the exact reproduction of reality but on efficient assistance and approximation for the design and manufacturing process of freeform bending parts.
3 Calculation method
The calculations and experiments to determine the characteristic curves for controlling the die were carried out according to the scheme displayed in Fig. 3. The individual steps of the scheme are explained below.
Fig. 3. Schematics of the calculation procedure
The Scheme consists of three basic steps. The output of every step is the following steps’ input. The output of Step III is the final curve describing the needed tool translation and rotation to achieve the desired curvature within a constant bending section. Curve 4 is validated by further experiments. The considered bending radii were set according to the Renard series defined in DIN 323 [8] as shown in Table 1. This reduces the calculation effort while it maintains the coverage of a wide range of values within every step. Therefore, the tube diameter is multiplied with the factor defined by the R5 series. For the investigations, only the R5 values from 6.3 to 40 are taken into account due to limitations regarding axis movement, flexibility of the mandrel and the distance between the dies.
Table 1. Distribution of the examined radii according to DIN 323
3.1 Step I – Geometrical input
The first step takes the input from the tool setup into account. Gantner [9] showed how to calculate the ideal deflection and rotation of the moveable die for tools with and without displaced tipping origin.
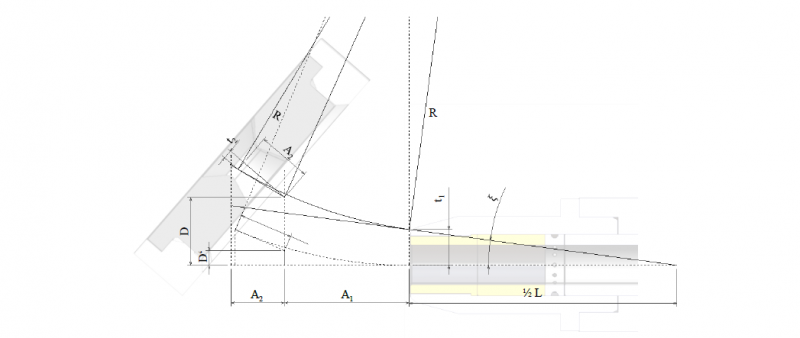
For the method described in this paper, Gantner’s formulas for section 2 (constant bending section) are extended by the clearances between the dies and the tube and by the length of the holding die. The parameters used in the following formulas are shown in Fig. 4.
Fig. 4. Sketch with the considered tool parameters
Combined, these two extension of the clearances result in the tilting of the tube inside the toolset during the forming process until the tube is clamped between the dies and the actual bending starts. The tilting angle 𝝃 is calculated from the clearance t1 between the tube and the holding die and the length L of the holding die as shown in (1).
Thereby, the effective deflection is decreased resulting in a larger bending radius then desired. The clearance t2 between the tube and the moveable die magnifies this effect. The compensated deflection d to achieve the desired bending radius R is calculated with the extended formula (2). Additionally, the distances A1 (tipping origin to holding die) and A2 (tipping origin to moveable die contact) are taken into account.
The extended formula for the tipping angle 𝜙 of the die is shown in (3).
The two formulas (2) and (3) are used to calculate the deflections and tipping angles for all points in Table 1 based on the boundary conditions shown in Chapter 2. This results in nine 3-tuples consisting of the desired bending radius, the ideal deflection and the ideal tipping angle of the die. To interpolate between these tuples, the Piecewise Cubic Hermite Interpolating Polynomial (PCHIP) [3] method implemented in Matlab is used. The two interpolated curves (one for the deflection and one for the tipping angle) are the input for the kinematics of the FEM simulations based on the parametrized bending line described in chapter 2.2.
3.2 Step II – Simulative calibration
The second step takes the simulation results of Step I into account by measuring the bending radius of the constant bent section of the simulation results and updating the ideal deflection value with the interpolated deflection value within the tuples. The newly generated 3-tuples (bending radius, updated deflection, ideal tipping angle) thus obtained are interpolated using the PCHIP method and build the new base for the kinematic input of the second simulative iteration. In any case, the tuples generated in Step II differ from those of Step I because in the first step pure geometrical data and no material data were used. Furthermore, the displacement of the tipping point acts as a leaver, thus increasing the effective deflection value of the die. The error caused by this effect is minimized by a further simulation loop within Step II using the simulation models from Step I with updated kinematics.
3.3 Step III – Experimental calibration
The third step starts with analyzing the simulation results of Step II, updating the deflection values within the 3-tuples from Step II followed by interpolating between the gained tuples. The shift of the interpolated curve from Step II to Step III is small compared to the first step. The interpolated tuples generated in Step III now set the setup-specific curves for the calculation of the simulation kinematics and the actual machine kinematics for the experiments performed in Step III. With this data five tubes are bent and measured according to the previous simulations and boundary conditions. This results in the last update of the tuples. The interpolated curve of this stage is the final curve that can be used as input for further every other bending operation regarding this tool setup and the used semi-finished product.
4 Results
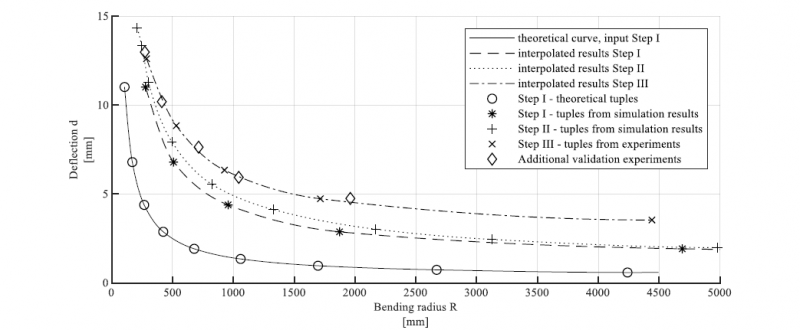
In applying the methodology in this paper, the tool setup and the material data described in section 2 are taken into account. Fig. 5 shows the evolution of the characteristic curves describing the basics of the kinematic calculations of the investigated semi-finished product. The ideal geometrical curve is calculated following the formulas in section 3.1 (solid line). The interpolation between the experimental tuples (marked with an ‘x’) yield the final curve (dash-dotted line) that characterizes the freeform bending properties of the used semi-finished product regarding the boundary conditions defined in chapter 2. Up to a bending radius of 500 mm the differences between the simulated curve (dotted line) and the actual bent parts (dash-dotted line) are small. With larger radii, this difference increases. The deviations between the final interpolated curve resulting from Step III (dash-dotted line) and the additional validation tests also increase with larger radii. From this, it can be deduced that a certain range of radii must be defined with regard to minimizing the deviations for larger radii and thus smaller deflections. The lower boundary is set by the tool setup and axis limits whereas the upper boundary has to be defined by the user. In conclusion this range varies for different tool setups and materials.
Fig. 5. Evolution of the characteristic curves throughout Step I to III
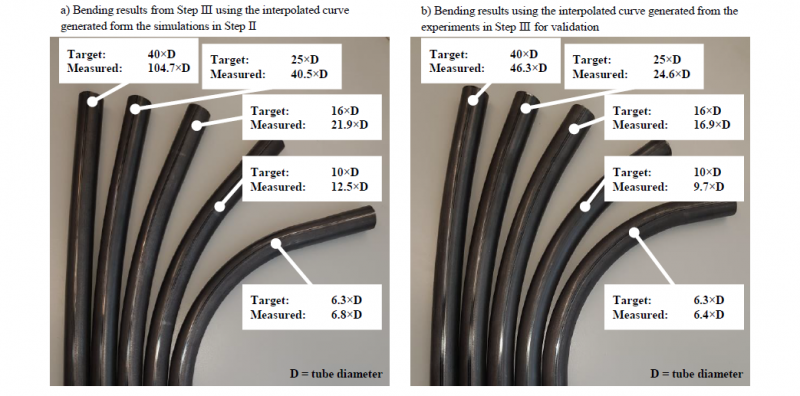
The actual bending results from Step III and from the additional validation tests are shown in Fig. 6. The validation results show small deviations between the target radii and the resulting radii. These differences can be explained due to the deviations within the semi-finished product. During the tests it was found that different forces were required for loading the machine (manually pushing the tubes through the dies in the opposite feed direction as shown in Fig. 2). This effect shows the deviations of the cross-section and the wall thickness of the tubes leading to different process forces and deviations regarding the achieved bending radius. To reduce the deviations precision tubes according to DIN EN 103025 can be used which have tighter tolerances for geometries and material properties than the standard tubes used for the experiments.
Fig. 6. Results from the bending tests within Step III (a) and from the validation tests following Step III (b)
5 Conclusion and Outlook
In this paper, a method is developed and validated to calculate the kinematics for freeform bending using a minimum of simulations and real experiments regarding the specific tool setup and basic material data. Three steps have to be performed, based on extended geometrical formulas to calculate the deflection and the tipping angle of the die. During these individual steps a total of 10 simulations and 5 experiments are carried out to evolve the final curve. Due to the distribution of the examined radii according to DIN 323 a sufficient range of bending radii is covered. Furthermore, this distribution can be adjusted to meet the requirements of the user regarding effort and precision. Additional tests were performed to show the validity of the interpolated curves and the method itself.
In summary, it can be stated that the method delivers a robust and sufficient result to calculate the kinematics for freeform bending operations regarding the specific tool setup and boundary conditions predefined by the user (as shown in section 2). It is suitable for different materials as well as different cross-sections. To achieve results with small deviations user-defined boundaries for the scope of the targeted bending radii have to be set. However, the validity of the curve achieved in Step III is limited to the use of the initially defined axis speeds. Other speeds lead to changed process forces and thus to different bending results.
Further investigations are planned to investigate on the extent to which the results change as a result of changed axis speeds. Based on this, a model is to be developed that combines the results of this paper and the changes caused by different axis speeds. This allows a complete description of freeform bending to be generated for a previously defined setup.
Acknowledgements
The authors thank MAN Truck & Bus SE and especially the research department for the funding of this research. Furthermore, we would like to thank the German Research Foundation (DFG) for financial support in the DFG priority program SPP2183 under grant number LO 408/26-1; MU 2977/8-1; VO 1487/16-1.


