1 Introduction
Friction and flow stress of material are two important parameters on which the accuracy of a forging simulation depends. However, many times, these parameters are not available and one needs to carry out standard tests, which usually is a timeconsuming task. A quick estimation of these parameters in the shop floor using the techniques of inverse modelling will greatly benefit the research community, especially when there is still no standard way of estimating friction in the process. In fact, finding out a reliable model of friction is itself a challenging task [1].
Two widely used models of friction in metal forming are Amontons-Coulomb model, in which the frictional shear stress is considered proportional to normal stress and constant friction or Tresca model, in which frictional shear stress is assumed to be proportional to yield shear strength of the material [2]. The ratio of yield shear strength to frictional shear stress is often denoted by m and is known as the friction factor. There are several such models, which are basically a combination of Amontons-Coulomb and constant friction models. For example, in Coulomb-Siebel model, frictional shear stress is obtained from Amontons-Coulomb model but its maximum value is limited to the yield shear strength of the material [3]. This model was adopted by Orowan [4] in modelling the rolling process. In essence, this model combines constant friction model with Amontons-Coulomb model by treating m=1; the transition from one model to other is abrupt. In Wanheim model [5], there is a gradual transition between Amontons-Coulomb and constant friction models and m may take any value between 0 and 1. It is often believed that Amontons-Coulomb model provides reasonable results in modelling a cold forging process, where the friction is low and Coulomb’s coefficient of friction µ ranges from 0.05 to 0.15. On the other hand, constant friction model is suitable for modelling a hot forging process. Nevertheless, several researchers have used constant friction model even for modelling cold forging [6-9].
Several researchers have tried to establish approximate relation between µ and m [10-12]. By analyzing various relations and expressions for forging load, it is demonstrated in this article that m=2µ is a reasonable relation. Further focus of the article is on inverse estimation of flow stress and µ. Flow stress is assumed to be dependent on strain but not on temperature and strain rate. Thus, findings of this article are limited to cold forging, while keeping open the scope to generalize the procedure for hot forging as well.
There have been some attempts to estimate the flow stress and friction in an inverse manner. For example, Kusiak et al. [13] obtained the material parameters of a medium carbon steel in hot compression by minimizing the error between measured and estimated compression load at different temperature and strain rates; estimated load was obtained by a finite element method (FEM) code. Cho and Ngaile [14] inversely estimated the flow stress and friction simultaneously from a ring compression test. In their method, error was minimized between experimental and FEM estimated compression load as well as inner diameter of the ring. Strain hardening law of Hollomon and constant friction model was used in the analysis. As compression load and geometry are estimated though FEM, which requires huge computational time, these methods cannot be used for quick online estimation of material and friction parameters.
Ebrahimi and Najafizadeh [15] proposed a method for evaluating the friction factor in a cold upsetting based on the bulge measurement. They developed an expression for the bulge based on an upper bound method, but neglected the effect of strain hardening. As will be shown later in this article, strain hardening does affect the bulging. Interestingly, this method was already described in a Russian book by Levanov et al. [16], although the expression for bulging was different. In a relative recent work, Kalpin et al. [17] have developed a three-punch method for estimating the friction at the work-die interface, but this method can be treated as a direct method. Recently, Sethy et al. [18] have determined heat transfer coefficient and friction factor in a hot ring compression test. For inverse determination of friction factor, the basis was the minimization of the error between FEM simulated and experimental inner diameter.
The present work develops a method for simultaneous determination of Coulomb’s coefficient of friction and flow stress of a strain hardening material by measuring the bulging and compression load in a cold axisymmetric upsetting. Estimated compression load is obtained analytically and bulge empirically. The efficacy of the method is ascertained by comparing the results with FEM simulations. The novelty of the method lies in the quickness and simplicity of the method.
2 Relation between friction factor and Coulomb’s coefficient of friction
Recently, Molaei et al. [12], proposed the following relation based on FEM simulations of double cup extrusion and barrel-compression tests:

It was shown that relation given by Eq. (1) provides better accuracy than some other relations. In several textbooks on metal forming, e.g., in Dixit and Narayanan [19], the die-pressure distributions in plane-strain upsetting of a specimen of height h and width w (Figure 1) have been obtained for Amontons-Coulomb and constant friction models. The length of the specimen is assumed to be very long in order to justify plane-strain assumption. For Amontons-Coulomb law, the pressure p at location x from the centerline of the workpiece is given by

For constant friction law, the expression can be obtained is

At x=w, both the friction models predict the same die pressure, equal to 2k. However, at x=0, both the models provide different pressures depending on the values of m and µ. In order to find equivalence between m and µ, the pressures from both the models is equated at x=0. Thus,

Eq. (4) can be used as an approximate relation between µ and m. Further simplification can be made by expanding the exponential function up to first three terms, which provides

For (µw/h) <<1,

with an error term of (2µ2w/h). Eq. (6) is highly approximate but handy relation between m and µ, with approximate percentage error e in m as

Although the relation given by Eq. (6) has been developed for plane-strain case, but it can give an approximate indication for the other cases also. It was verified by a few published data.

Fig. 1. Workpiece and the forces acting on an infinitesimal slab. Thickness in z-direction is considered unity
Table 1. Equivalent Coulomb’s coefficient of friction for different values of friction factor
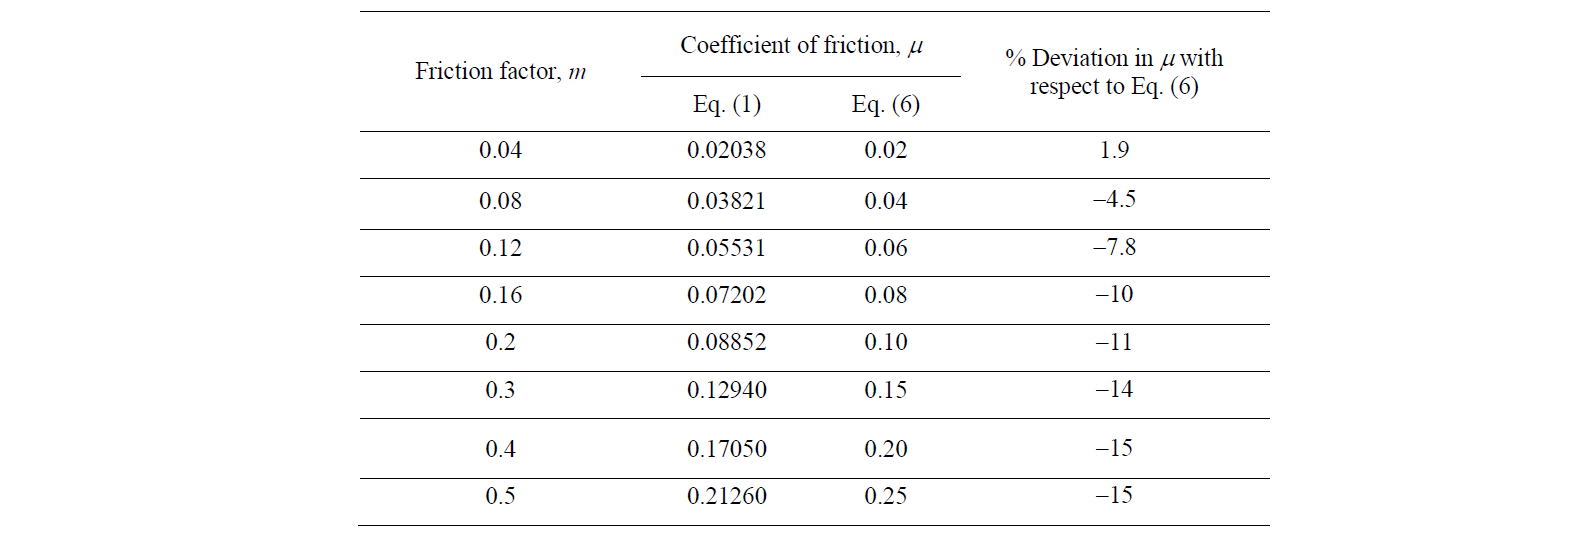
Table 1 shows the values of Coulomb’s coefficient of friction obtained from Eq. (1) and Eq. (6). It is observed that Eq. (6) provides fairly close values to those obtained from Eq. (1). The deviation increases with increasing values of friction factor. Eq. (7) suggests that for w/h=1 and µ=0.15, the percentage error in the estimation of coefficient of friction for m=0.3, should be about 15%; here it comes out to be approximately 14%. A more accurate value of µ for a given m can be obtained from Eq. (4), but this needs the value of w/h also.
3 FEM simulation of forging and validation
The axisymmetric-stress model of the cold forging process was developed using the commercial finite element package ABAQUS® version 6.10-1. During modeling of cold forging process, axisymmetric deformable shell part was created for blank and axisymmetric discrete rigid wire part was created for die. For validation purpose, a JIS S25 steel workpiece of 10 mm radius and 20 mm height was chosen. The radius of the die was taken as 40 mm. A reference point (RP) was created on the die. The material properties are available in Mungi et al. [20]. Automatic time step increments are chosen for dynamic explicit process. The surface-to-surface contact interaction is used. A penalty based friction formulation was used. The coefficient of friction between blank and die is taken as 0.25 [20]. The boundary conditions given to die and blank are shown in Figure 2. The die is given a velocity equal to 1000 mm/s along Y-axis direction.
ALE (Arbitrary Lagrangian-Eulerian) adaptive mesh control is used to mesh the blank during forging process. The blank is discretized with a 4-node bilinear axisymmetric quadrilateral, reduced integration, hourglass control element (CAX4R). The die was discretized with a 2-node linear axisymmetric rigid link (for use in axisymmetric planar geometries). The mesh sensitivity analysis was carried out and results are summarized in Table 2. The percentage error is obtained by dividing the difference between simulated and experimental forging load by experimental forging load and then multiplying it by 100. Based on accuracy in total forging load and computational time, the element size for both blank and die was taken as 1 mm. It is noted that reducing the mesh size further increases the error instead of decreasing it. It is well-known that in time-dependent problems for accurate and stable solution, time increment should be reduced appropriately if the mesh is refined. Reducing the mesh size without appropriate reduction of time increment produces inferior solution. Moreover, with too small mesh size, problem of mesh distortion may be significant. Because of these two reasons, simulated forging load starts increasing after a monotonic decrease till a mesh of element size 0.5 mm.
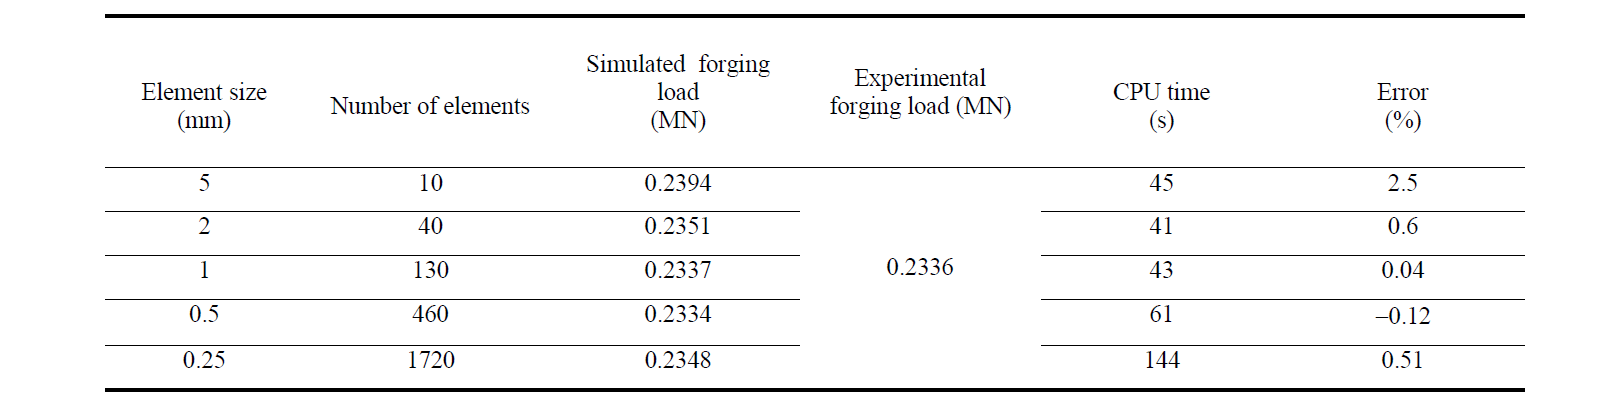
Table 2. Mesh sensitivity analysis (Material properties taken from Mungi et al. (2003), workpiece dimension: Initial radius = 10 mm, Initial height = 20 mm; percentage reduction = 20%)
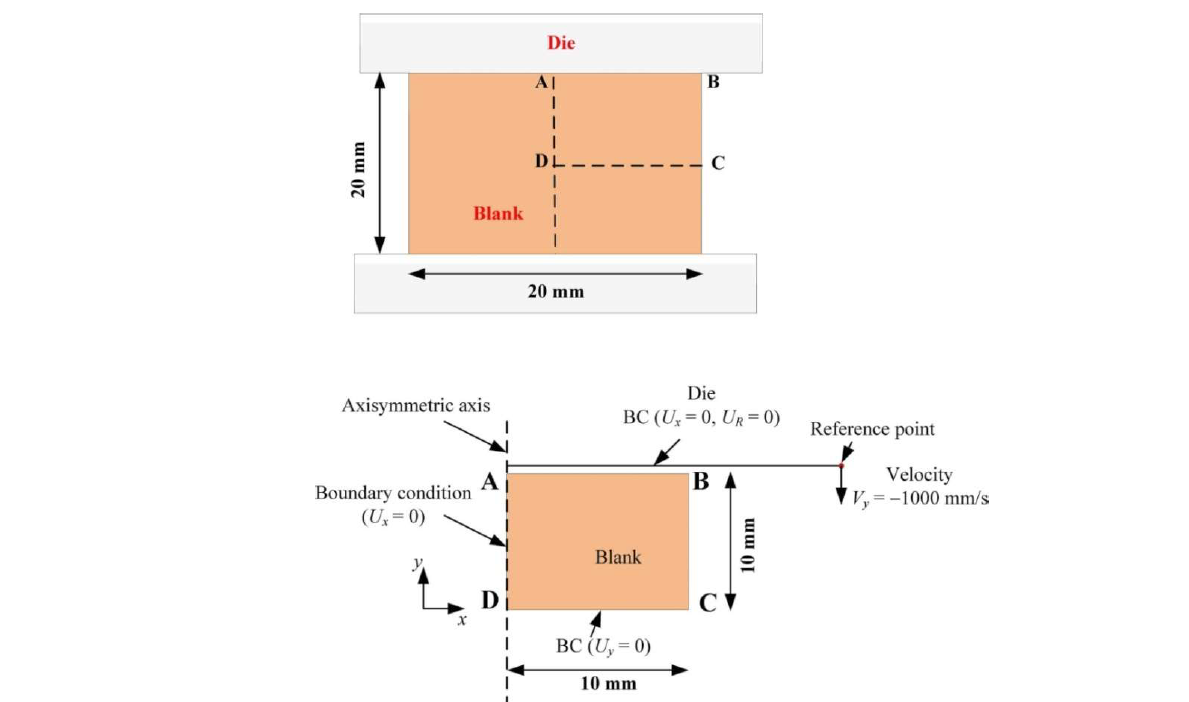
Fig. 2. Schematic diagram representing boundary conditions during forging process
The developed FEM model for cold open die forging process is validated by comparing the simulation results of total forging load with the experimental result of Shima et al. [21] and simulation result of Mungi et al. [20]. The results are shown in Figure 3. An excellent agreement is found. The magnitude of the maximum error between experimental and simulation result is 1.6%.
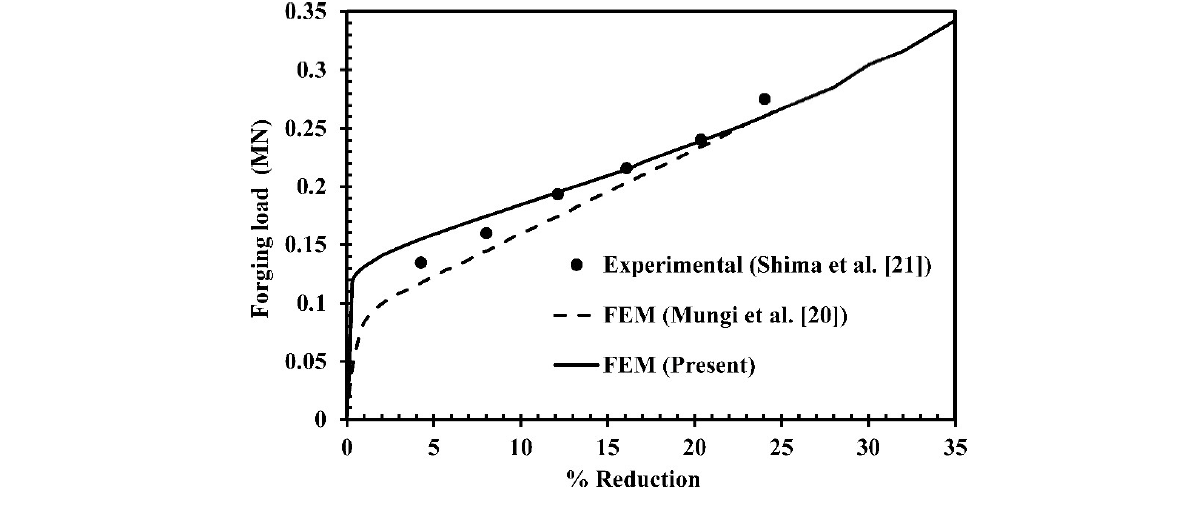
Fig. 3. Comparison of predicted reaction force versus reduction curve with experimental results (Shima et al., 1978) and simulation results (Mungi et al., 2003) of material, JIS S25C steel (workpiece size: initial radius = 10 mm, initial height = 20 mm; μ = 0.25)
4 Empirical equation for the ratio of bulging and initial height
The strain hardening behavior of the material is represented by the following equation:

where σ is the flow stress of the material, (σY)0 is the yield strength, K is a strain hardening constant, n is a strain hardening exponent and ɛp is the equivalent plastic strain. Dividing K by the yield strength, the non-dimensional hardening constant is obtained, which is denoted by S. Based on parametric study, it is observed that the main parameters that affect the bulging are percentage reduction (r), coefficient of friction (μ), ratio of initial height and initial radius (H), strain hardening exponent (n) and non-dimensional hardening constant (S). It is assumed that the initial yield strength (σY)0 of the material is known. Based on FEM simulations and following an optimization procedure using the FMINCON function of MATLAB® provided the following empirical relation:

where B is the bulging (difference between the maximum and top radii) and S is the ratio of K to yield strength. Ranges of parameters used for fitting this relation were H: 0.5-2, µ: 0.05-0.15, r: 10%-30%, n: 0.15-0.6, S: 1.229-1.819. As the bulging is small, relation in Eq. (9) uses constants with high number of significant digits.
To verify the empirical Eq. (9), the predicted ratio of bulging and initial height (B/hi)pred is compared with the FEM simulated ratio of bulging and initial height (B/hi)sim for various interpolated cases (Figure 4) based on an orthogonal array design. In most of the cases, the error is less than 5%. The maximum error is 5.7% for Simulation 8. In future, the validation of empirical relation with real experimental data will be carried out for the open-die forging of several materials. It is also to be mentioned that Eq. (9) is valid only for interpolation within the range of data used in simulations. A valid relation for wide range of parameters can be obtained by using a machine learning technique such as neural network. It is observed that bulging increases with the increase in coefficient of friction, but its dependence on strain hardening is complex. In this work, only bulging characterized in terms of the difference between the maximum and top radii is considered. Bulge profile can also provide useful indication, which is left for future work.
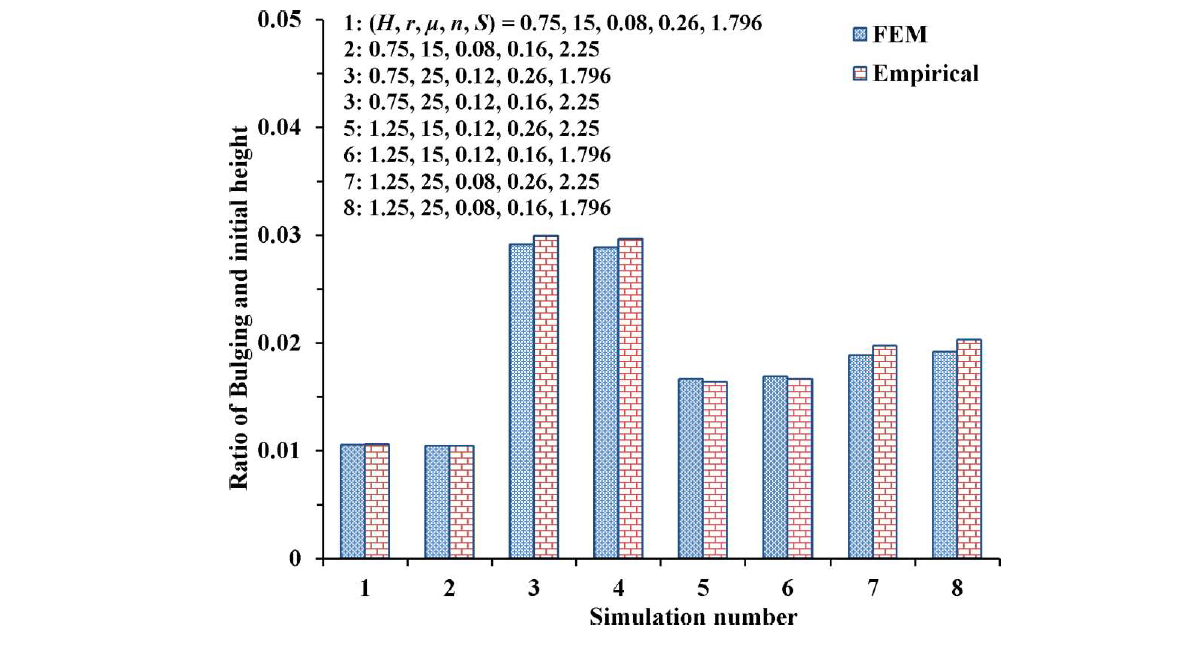
Fig. 4. Comparison of empirically estimated and FEM simulated bulging
5 Inverse Modelling
The inverse procedure uses the result of the bulging and total forging load to obtain the coefficient of friction and flow stress of the material. Chen and Chen [22] used the following formula for estimating the corrected flow stress (σc) of the material during forging process

with approximate flow stress

where P, R and R2 are total forging load, radius of the bulge curvature and the maximum radius of the barreled specimen, respectively. To validate the equation, FEM simulations are carried out for different combinations of actual flow stress, r and μ as shown in Table 3. Although both Eq. (10) and Eq. (11) provide reasonable accurate estimation of flow stress, Eq. (11) provided more accurate predictions. Therefore, in the present work Eq. (11) was used for estimating the flow stress of the material.
Table 3. Comparison in between actual and inverse estimated flow stress (workpiece dimension: Radius 10 mm, height = 20 mm; E = 208 GPa, Poisson’s ratio = 0.3)

Using the results of the total forging load at different percentage reductions, the flow stress can be inversely estimated using Eq. (11). The equivalent compressive plastic strain at each reduction can be estimated using the following formula:

It is an average equivalent strain but sufficiently close to actual strain distribution for cold forging with low friction.
Using the results of inversely estimated flow stress and corresponding equivalent plastic strain, an empirical equation for the strain dependent flow stress was fitted using FMINCON function of MATLAB® in the form given by Eq. (8).
The coefficient of friction can be inversely estimated using empirical Eq. (8) by measuring the bulging.
6 Results and discussion
For the sake of brevity, only one example is presented. In this example AA 1100 aluminum is taken. The workpiece is of size 20 mm radius and 25 mm height. Material properties: density, ρ = 2700 kg/m3; modulus of elasticity, E = 69 GPa; Poisson’s ratio, ν = 0.3; initial yield stress, (σY)0 = 62.74 MPa; hardening coefficient, K = 110.1 MPa; hardening exponent, n = 0.6826 [20]. FEM simulations are carried out for six different percentage reductions as shown in Table 4. The coefficient of friction is 0.1 in all cases. The actual values of the maximum radius (R2) of the deformed workpiece and total forging load are obtained for each reduction; flow stress is inversely estimated using Eq. (11).
Table 4. Inverse estimated flow stress and equivalent plastic strain of the material (Workpiece dimension: Radius 10 mm, height = 20 mm; E = 69 GPa, Poisson’s ratio = 0.3, actual coefficient of friction = 0.1)
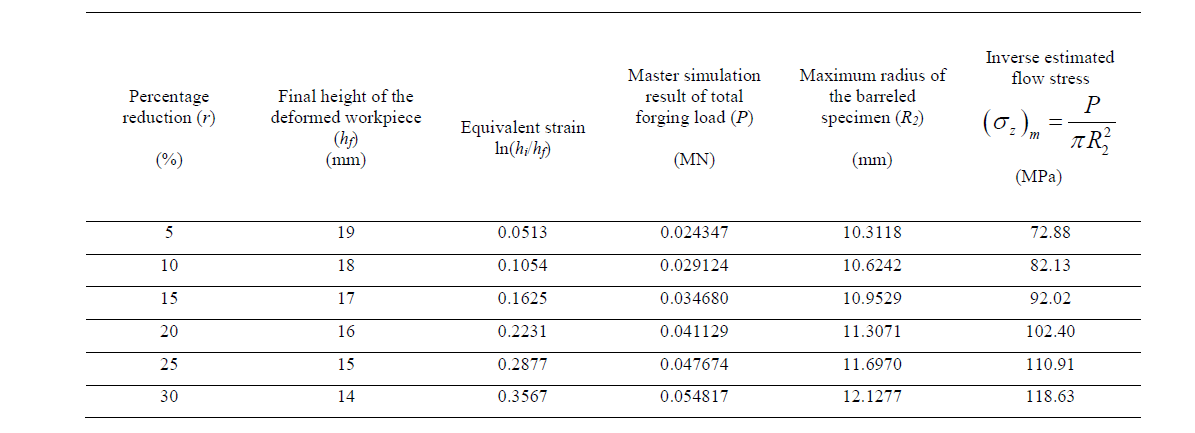
It is assumed that initial yield stress equal to 62.74 MPa of the material is known. Now, the following flow stress equation is obtained as an empirical equation based on data of Table 4:

It is observed that although the actual and estimated values of K and n are quite different, the error in flow stress is less than 5%.
For inverse estimation of the coefficient of friction for a typical case, FEM simulation was carried out for a specimen of radius 20 mm and initial height 25 mm (H = 1.25), r = 25% and actual coefficient of friction (μact) as 0.08. The FEM simulated value of the ratio of bulging and initial height is obtained as (B/hi)act = 0.0118. Following the inverse procedure using Eq. (8), coefficient of friction was obtained as 0.08247, providing an error of 3.09%. A sensitivity analysis was also carried out. It revealed that error in the estimation of Coulomb’s coefficient of friction is of the order of measurement error in the bulge.
7 Conclusion
In this work, first it is established that friction factor can be estimated based on the knowledge of Coulomb’s coefficient of friction. As a rough estimate, friction factor is twice the Coulomb’s coefficient of friction. After that an inverse method has been proposed for finding out the flow stress as a function of strain and Coulomb’s coefficient of friction. The method relies on the measurement of compression load and bulge in an upsetting process. As the shop floor experiments have not been carried out, the efficacy of inverse method is tested with reference to FEM simulations. The maximum strain value was more than 0.35 in a few simulations. A sensitivity analysis is also carried out. It is observed that the method can be very effective tool for the quick estimation of flow stress and friction on the shop floor. In future, it is planned to carry out a rigorous validation of the method with the help of real experiments.
Acknowledgements
This work is a part of a joint Indo-Russian Project entitled “Experimental and numerical research on contact friction in the process of plastic deformation by means of compression with torsion”. It is funded by Russian Foundation for Basic Research (RFBR) and Department of Science and Technology (DST) according to the Research Project № 19-58-45020\19 and Grant INT/RUS/RFBR/388, respectively. Authors gratefully acknowledge the support of the funding agencies.
