1 Motivation
Rolling, bending, cutting, forging and deep drawing are common processes for sheet metal working. For the most of these processes, lubrication is needed to protect the tool from wear and to achieve smooth operation conditions. Forming lubricants have to meet a broad range of demands beside the effective lubrication. These are the application, the material compatibility, environmental requirements, work safety, the local registration of the additives and the final degreasing step after the processing. Many industrial processes suffer from instable tribological conditions, depicted by higher scrap rates and insufficient part quality conditions, especially at the start or after a stop in production. Only when steady-state conditions are reached, the tribological system will be stabilize. The main reason for this is the change of the tool temperature [1, 2] during the production run. It is widely known that lubricity and viscosity are strongly depending on temperature. With a higher temperature, the viscosity of the lubricant is decreasing, (Fig. 1). Depending on the lubricant type, the different additives in the lubricant show a temperature sensitivity [3] with positive or negative impacts on friction and wear.
Additionally, the performance in production depends on different factors. The most important are the stroke rate (velocity), pressure, material and surface properties, strain and temperature [4]. These parameters have an important influence on the friction, which is shown in Fig. 2.
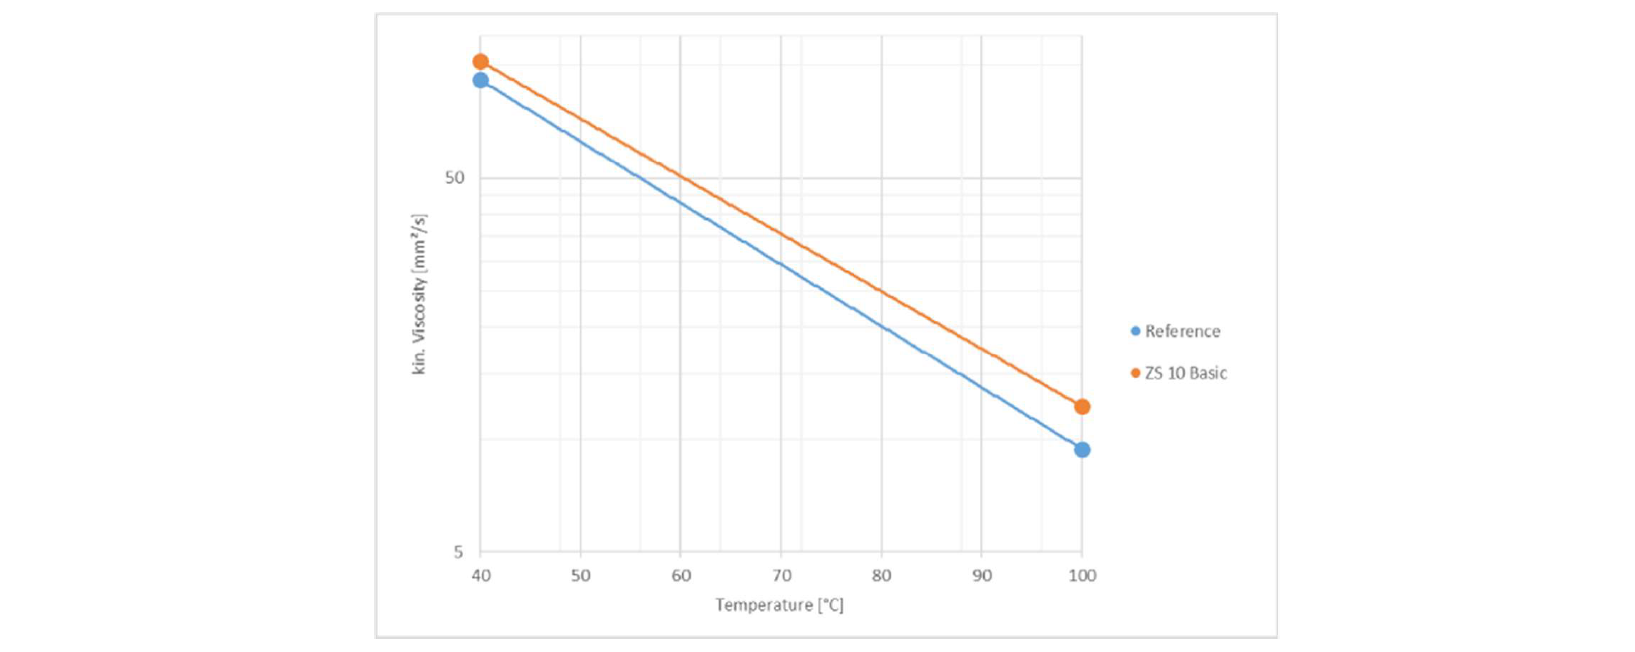
Fig. 1. Reference lubricant and ZS 10 Basic viscosity temperature behavior

Fig. 2. Factors, which have an influence on friction
Within the project ASPECT (“Advanced Simulation and Control of tribology in metal forming Processes for the North-West European Consumer goods and transport sectors”), co-funded by the INTERREG North West Europe Program, the partner consortium tried to solve these demands by using simulations, process control strategies, adapted lubricants and finally we investigated the hypothesis with the demonstrator tools.
The lubricant developer’s motivation is to find a lubricant formulation, which can compensate the decrease of the viscosity with temperature by an adapted additive concept. In our case, the reference lubricant shows an unstable temperature friction behaviour with rising tool temperatures. Due to this, we tried to develop an improved lubricant with better temperature properties and tested this in the Philips demonstrator tool [5].
2 Methods
To optimize the additive formulation a large number of lubricant mixtures were tested. Therefore, we chose a ball on plate test as preliminary testing method. Basic parameters are described in [6] for testing more than 30 different lubricant mixtures. The parameter chosen for pressure (load) are typical conditions for the load of deep drawing operations [7]. We also tested different speed (amplitude/frequency) parameters.
The result is an optimised additive formulation, named Multidraw ZS 10 Basic. In table 1 the basic settings are shown, which we used for the development and testing of the new lubricant. In addition to our first investigation [6] (bold parameters), we did additional variations to check the sensitivity of the ZS10 Basic towards frequency, load and temperature. The wear is measured in the SRV-machine by the change of the height in z- direction.
Table 1. Basic settings for the ball on plate test (SRV 4)

3 Results for ball on plate tests
Figure 3 shows the results of these investigations for ZS 10 Basic against the reference lubricant. For the ZS10, stable friction values were found up to 160°C, while the friction for reference lubricant is strongly increasing, especially at 140°C and at 160°C.

Fig. 3. Friction and wear with temperature dependency of Reference lubricant and ZS 10 Basic, 150N, 2Hz
The wear shows a similar behaviour. The reference shows a strong increase with higher temperature, meanwhile the ZS 10 Basic stays on a stable level.
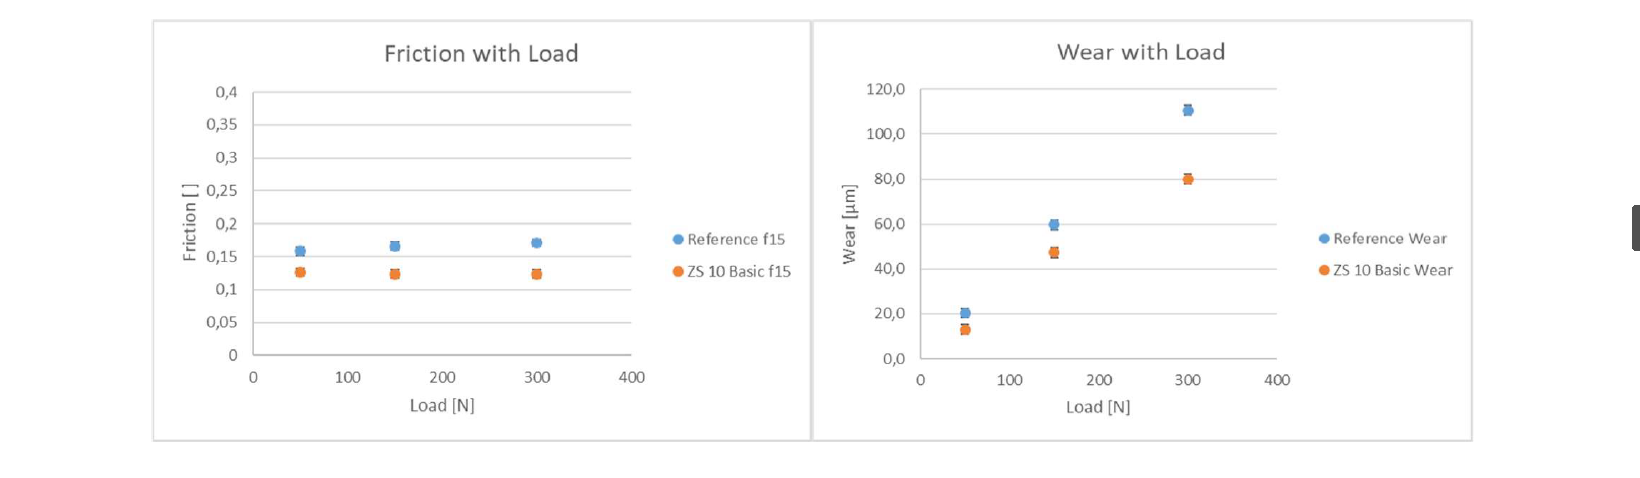
Fig. 4 Friction and wear with load dependency of the reference lubricant and ZS 10 Basic at 80°C, 10 Hz
The wear is increasing with the load applied in the ball on plate test. The wear level of the reference lubricant is higher in comparison to the ZS 10 Basic. The difference between both lubricants is increasing with the load. At the same moment, the friction (Fig. 4) shows stable values, within an acceptable range, with rising load. This is in accordance to the observation that the friction level during a ball on plate test run stabilizes to a constant friction level. During a ball on plate test the contact area is growing, as is the wear scar. With the applied static load value, the surface pressure is falling.

Fig. 5. Friction and wear with frequency dependency of the reference lubricant and ZS 10 Basic at 80°C, 150N
The friction is moderately decreasing with higher frequencies, where frequencies are changed to mimic differences in stroke rates during production. The friction values for the ZS 10 Basic are constantly lower than for the reference lubricant (Fig. 5). The wear is increasing with higher frequencies. The slope is smaller, compared to the increase of the wear with rising load.
4 Results for strip drawing tests
To verify the new lubricant for industrial forming applications, cup drawing tests at ambient temperature [6] and strip drawing tests at different tool temperatures were done.
Fig. 6 shows the friction at different temperatures during the strip drawing test according to the VDA 230-213 [8] for both lubricants. Due to the decrease in viscosity with increasing temperature, the friction values are rising for both oils. ZS 10 Basic shows overall lower friction values under the same conditions, especially at higher temperatures, proving its temperature stability. With higher surface pressures, the friction values are decreasing at a given temperature.
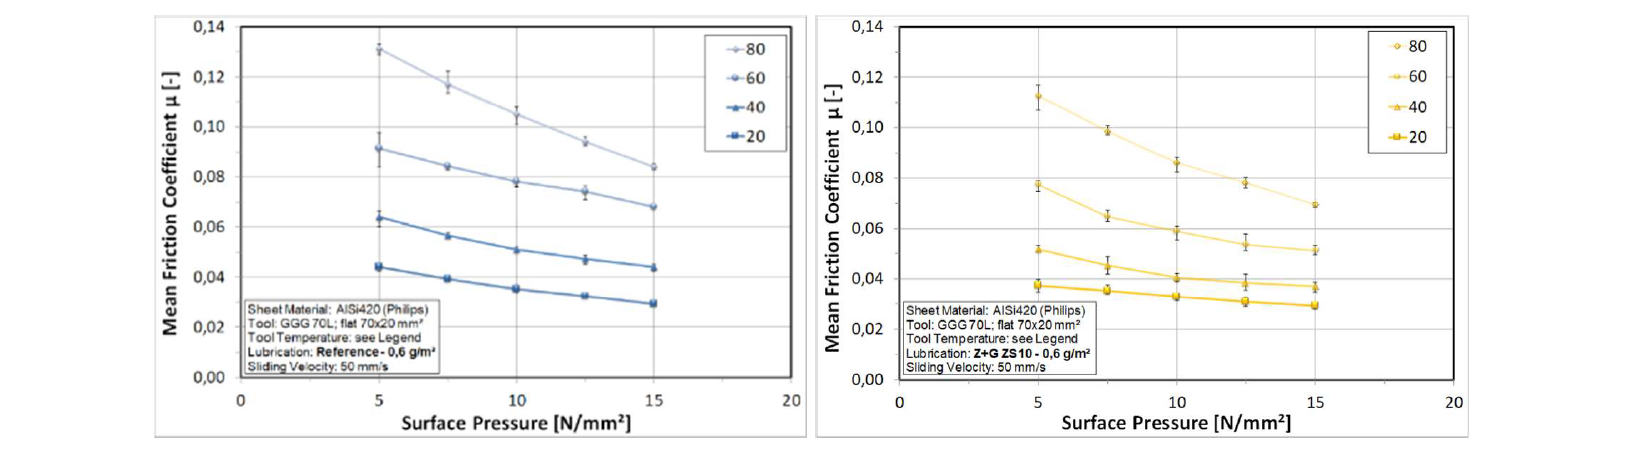
Fig. 6. Friction surface pressure behavior of Reference lubricant (left) and ZS 10 Basic (right) at 20°C, 40°C, 60°C, 80°C
In the strip draw test, the temperature dependency of the friction is decreasing with higher sliding velocities, especially for the ZS10 basic (Fig. 7). The temperature sensitivity is lower at high temperatures for the ZS 10 Basic. The reason for this is the higher viscosity index of the new lubricant. It has a higher viscosity at higher temperatures (Fig. 1).
The surface of the disc is lapped. The surface of strip, which is used for the strip drawing test, is dull finished. Due to the bigger area of the tool in the strip drawing test, the lubricant can be trapped in pockets of the roughness of the surface [9, 10]. The result is a higher hydrodynamic lubrication propotion for an area contact like in the flat strip-drawing test, compared to a point-contact from the ball on plate test. This effect is used by texturing of surfaces in the skin pass mill for automotive sheet metal.
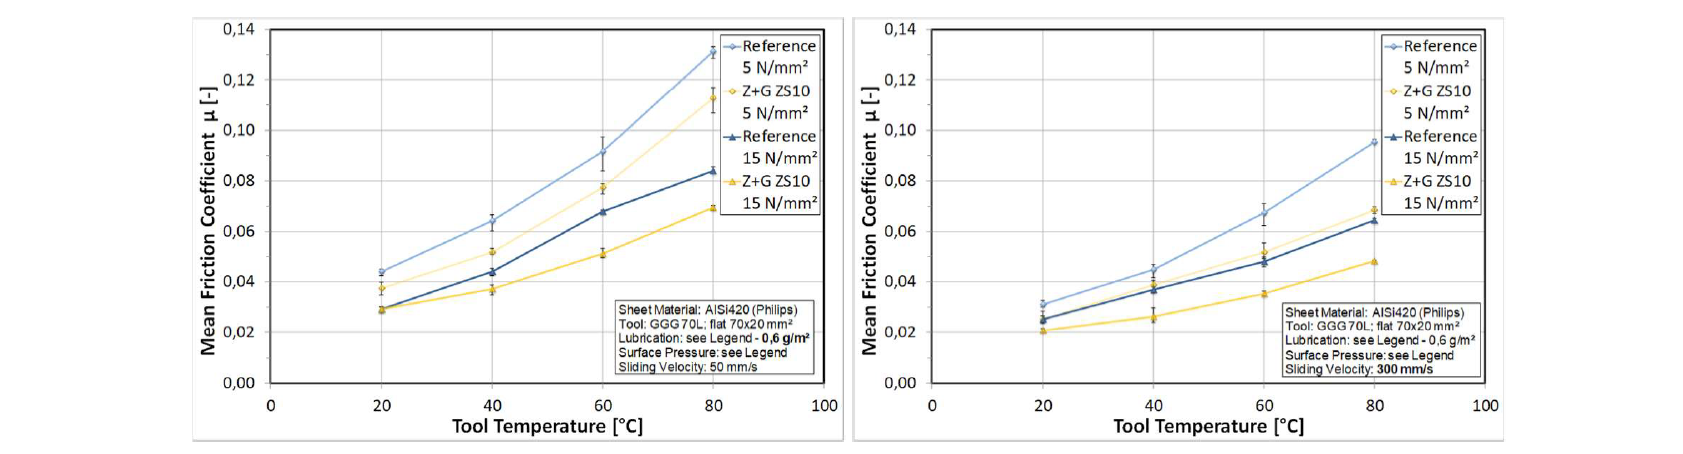
Fig. 7. Sliding velocity and surface pressure with tool temperature of Reference lubricant and ZS 10 Basic 50mm/s and 300 mm/s
5 Test in the demonstrator tool
The final test stage is the demonstrator progressive tool at Philips under conditions close to serial production. The die is designed to be especially temperature sensitive and was developed within the ASPECT project [5]. Fig. 8 shows the product created in this process.

Fig. 8: The strip layout of the demonstrator process (a) and its empirical end result (b)
The test runs were executed during one of the hottest weeks of 2020, with temperatures reaching over 35°C outside. As the temperature control in the test room is rather primitive, this clearly has its effects on the test results as well: room temperatures were between 27°C and 29°C.
At the beginning, the reference lubricant is used, starting with a long run with the lubrication machine spraying 400 ml/hour onto the strip. Once the tools are cooled down to room temperature, the volume flow is changed to 600 ml/hour. In the third run, the same procedure is followed, only now setting it to 800 ml/hour.
After these runs, the lubricant is changed from the reference to the ZS10 basic. To prevent oil carryover all systems and dies are cleaned and a small layer of ZS10 lubricant is applied on the dies. Afterwards, the runs were started with a volume flow of 800 ml/hour. For the ZS10 the 800 ml/hour turned out to be too high so that the first die set was drenched with lubricant, resulting in slug pulling. Therefore, this run was aborted. After the tools were cooled down the runs with 600 ml/hour and 400 ml/hour are executed.

Fig. 9: Temperature increase over time per forming step for all the runs performed in week 20.33
The relatively high room temperatures can also be observed in the temperature measurements of the tools (See Appendix A), starting at these room temperatures. To omit the influence of the changing ambient temperature, only the temperature increase during all the runs for both steps is plotted in Fig. . It can be seen that the amount of lubricant or lubricant type hardly influences the temperature increase over time.
To reach a steady state, a run was done of half an hour using the reference lubricant with a setting of 400ml/hour. At that point, temperatures are still rising, but its derivative to time is decreasing more and more.
For the other runs, it was chosen to abort after 10 minutes, as the biggest temperature increase is happening in that time window.
The hole and flange diameters created during the test runs can be seen in Figure 10 and Figure 11 respectively. Unfortunately, it must be concluded that the short-term variation in the signals is relatively large, making it harder to draw conclusions. Nevertheless, some clear trends are visible in the data that can be linked to temperature and the applied lubricant.
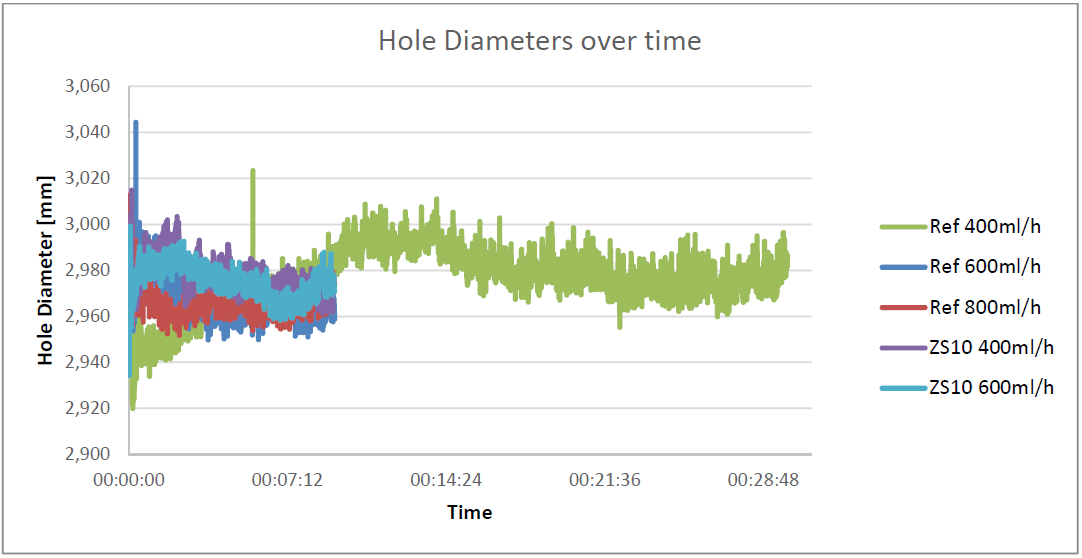
Fig. 10. Hole diameter over time for all the runs performed in week 20.33
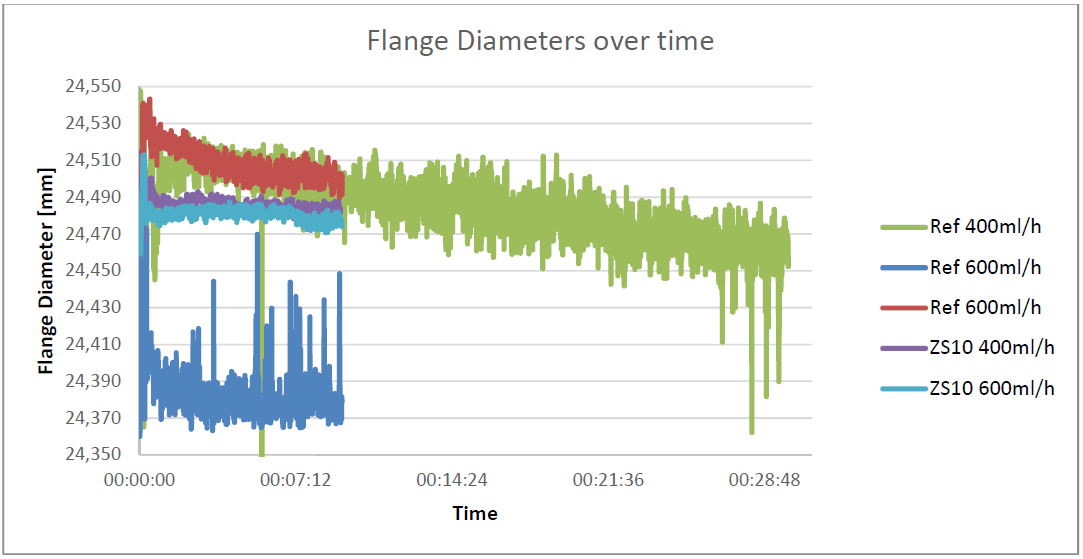
Fig. 11. Flange diameter over time for all the runs performed in week 20.33
It can be seen, that in the run with the reference lubricant and volume flow of 400 ml/min the hole diameter is increasing in the beginning and it shows a decreasing trend after approximately 12 minutes. For the flange diameter, a decrease over the full test duration is observed.
Generally, the trends in hole diameter are decreasing with time and temperature. Although the long run with volume flow of 400 ml/hour and the reference lubricant was performed at the lowest room temperature (see start temperatures of the graphs with absolute Temperature in Appendix A), no clear link between Temperature and the change in trend could be observed. The trend for the long run changes direction around the point that the tools of step 1 and 2 reach temperatures of 33.5 and 34.8°C respectively (see Appendix A). In some of the other runs, the trend is already downwards for the hole diameter below these temperatures. Therefore, it is assumed that a dynamic lubricant thickness is also of influence, meaning that in the first run, starting with relatively dry tools, the local lubricant layer is increasing over time.
All the reference runs are performed within one day, starting with the 400ml/hour run and the runs with 600 and 800ml/hour directly afterwards, only with periods in between to cool down the tools. The second day, this is done for the ZS 10 Basic lubricant, only now starting with the highest amount. It can be seen that for the first run with ZS 10 Basic lubricant, the trend in hole diameter is also increasing in the first part and changing to a downwards trend afterwards. Because of the viscosity of the lubricant, it takes time before all the lubricant has dripped off from the forming parts. The time between runs on one day is not enough to trigger the influence of the dynamic lubricant layer. However, when the time between runs is one full night or longer, the time is large enough to create a real impact, meaning that the first run on the new day again starts with relative dry forming parts, which triggers the effect of the dynamic lubricant layer again.
The values in Figure 11 for the run with reference lubricant sprayed on at 600 ml/hour are clearly lower than the other runs. Up to now, it is not clear what caused this difference.
If both lubricants are compared directly, no real effects in hole diameter can be seen. A significant effect can be observed in the flange diameter, showing a much more stable trend for the ZS10 Basic, indicating the friction values become more stable as a function of temperature in the first deep drawing step.
6 Conclusion
A reference lubricant and the new developed lubricant, ZS 10 Basic, were investigated in a ball on plate test, in a strip drawing test and in a demonstrator tool to investigate the friction and wear behavior with temperature. Each setup has advantages and disadvantages and can only display parts of the influences.
With every stroke at the deep drawing process, fresh areas of the sheet metal were exposed to the tool surface [2]. In contrast to the deep drawing process, the ball on plate test has a repetitive contact with the same area of the friction partner. Additionally, we can´t use the original tool and strip materials for the friction partners. The ball on plate test has only a point contact. This means the testing by ball on plate test should be less sensitive for the change of viscosity with temperature.
We used the ball on plate test to investigate the friction and wear behavior of the specific lubricant formulations over a temperature range, which we expected to be the same in the demonstrator tool (Table 1) on a microscopic scale.
During a ball on plate test run, the area of the wear scar is growing constantly, and a stable friction level is established during the test run. The oscillation during the ball on plate test causes a permanent change in speed with starts and stops by the change of direction at the end of the amplitude’s way. The conditions at this end points are much closer to the boundary lubrication regime, then in a flat strip-drawing test.
With its point contact in the boundary lubrication regime, the ball on plate test is not suitable for a complete test of the performance of a forming lubricant for sheet metal forming. The deep drawing process has a high ratio of hydrodynamic lubrication [10].
In contrast to start and stop situation, the friction during the flat strip-drawing test is measured in the stationary speed phase, after overcoming the static friction [4]. The values from the starting and the ending are cut off. A advantage is the usage of the original tool and strip material.
Finally, the friction behavior at the demonstrator tool is compared to the ball on plate and the strip-drawing test. The results indicate a more stable performance of the ZS10 basic lubricant over temperature compared to the reference lubricant and additionally even lower friction values. The differences in the results between both tests can be explained by the differences in the test setup as discussed above.
The results from progressive tool at Philips are showing large variations in hole diameter, but more pronounced effects in flange diameter. It can be seen, that the ZS10 basic shows hardly any influence of temperature, whereas the reference lubricant shows a decreasing trend over temperature, which confirms the results already found in ball-on-plate and strip-draw tests.
The demonstrator tool results, with test conditions close to serial production, are promising. We conclude from this that the new developed lubricant can provide more stable production conditions with a broader process window.
Acknowledgements
The investigations were carried out within the “ASPECT” project – “Advanced Simulation and Control of tribology in metal forming Processes for the North-West European Consumer goods and transport sectors”, co-funded by the INTERREG North West Europe Programe: www.nwe.eu/aspect. The authors want to thank for funding this project and gave grateful acknowledgements to the project partners for their support.
APPENDIX A: TEST RESULTS OF INDIVIDUAL RUNS
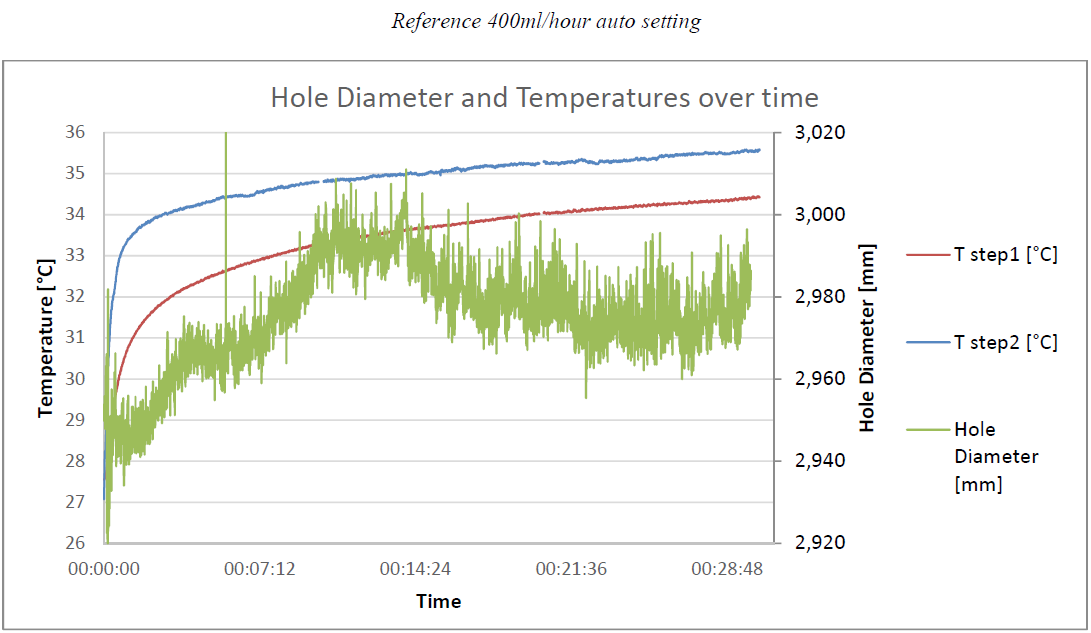
Fig. 12. Temperature and Hole diameter measurements over time with Reference Lubricant and lubricant setting at 400ml/hour
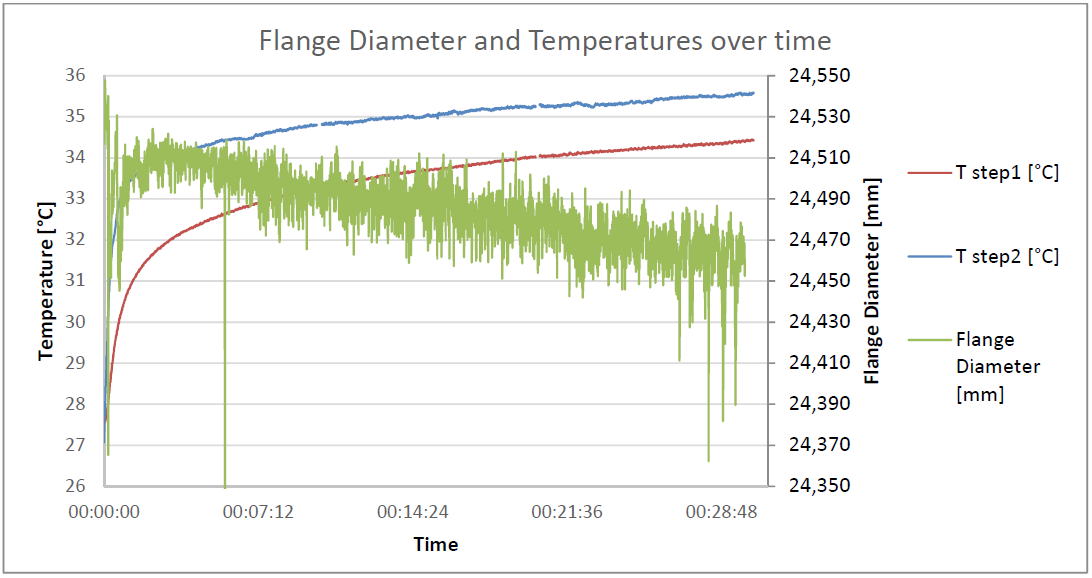
Fig. 13. Temperature and Flange diameter measurements over time with Reference Lubricant and lubricant setting at 400ml/hour

Fig. 14: Temperature and Hole diameter measurements over time with Reference Lubricant and lubricant setting at 600ml/hour
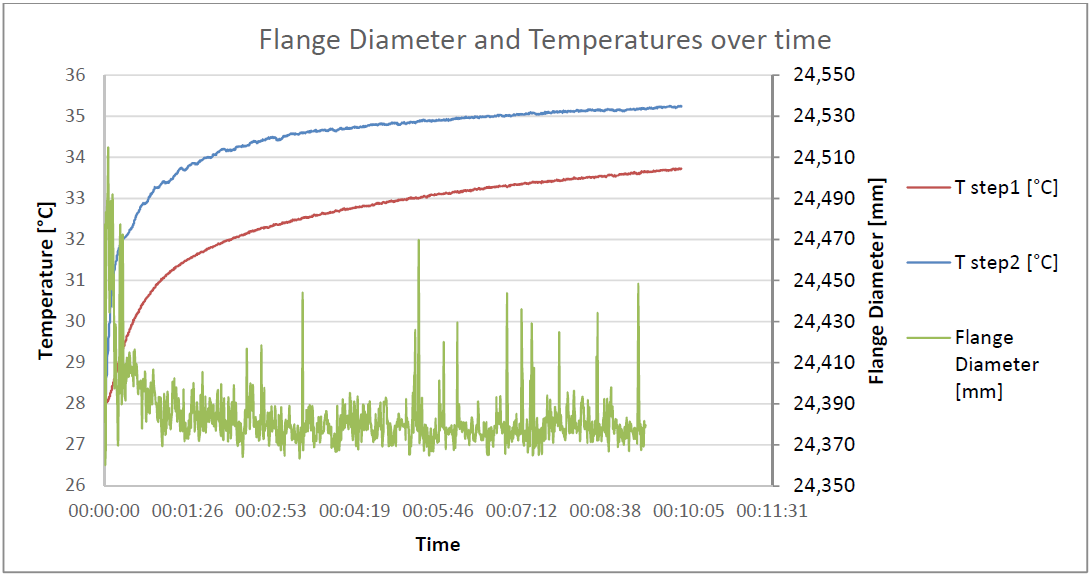
Fig. 15: Temperature and Flange diameter measurements over time with Reference Lubricant and lubricant setting at 600ml/hour

Fig. 16. Temperature and Hole diameter measurements over time with Reference Lubricant and lubricant setting at 800ml/hour
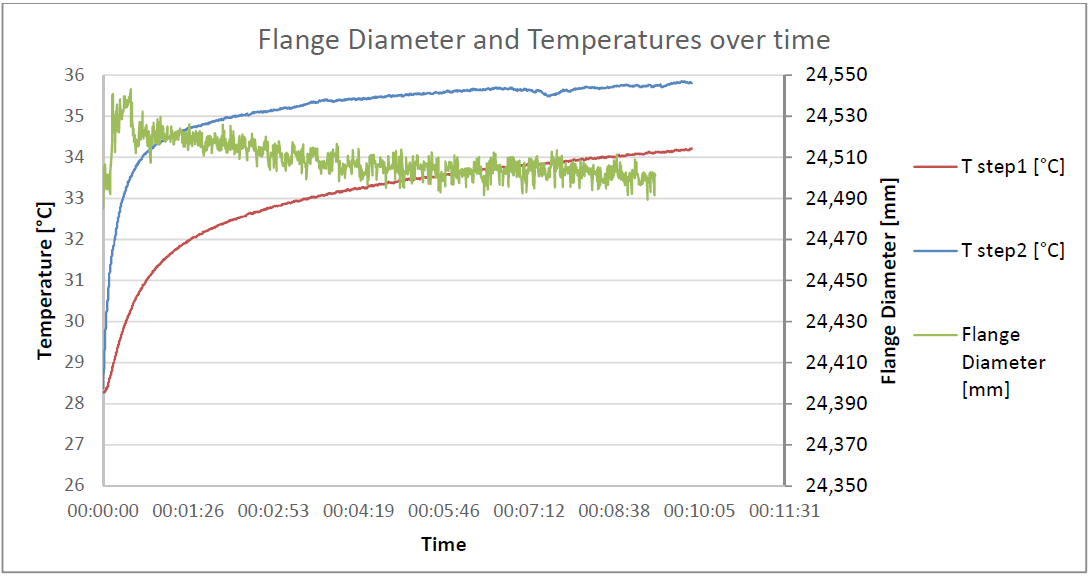
Fig. 17. Temperature and Flange diameter measurements over time with Reference Lubricant and lubricant setting at 800ml/hour
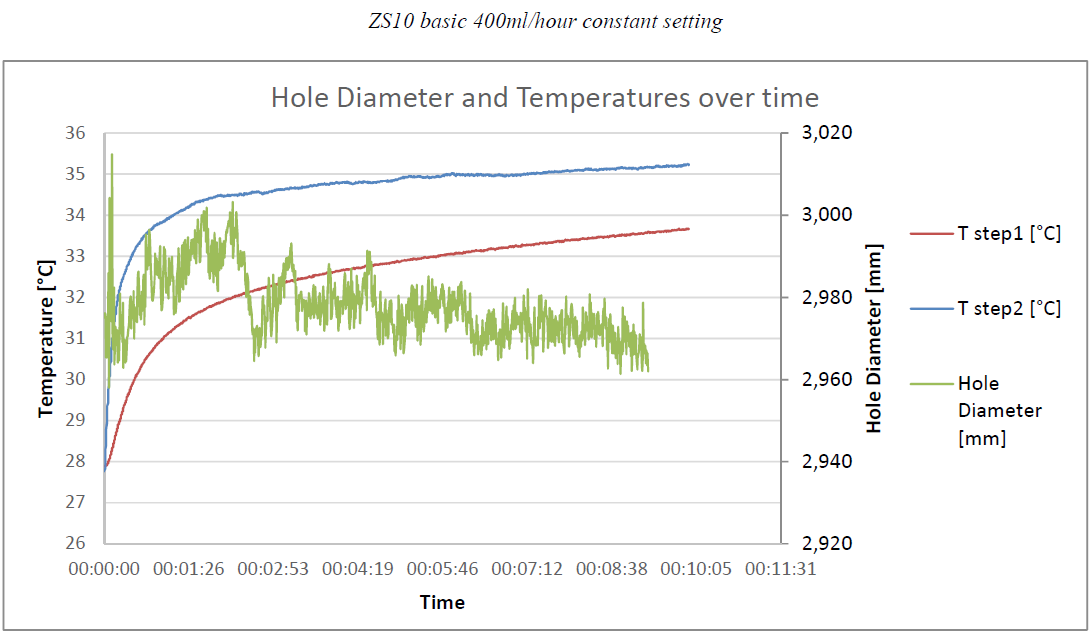
Fig. 18. Temperature and Hole diameter measurements over time with Z&G ZS10 Lubricant and lubricant setting at 400ml/hour
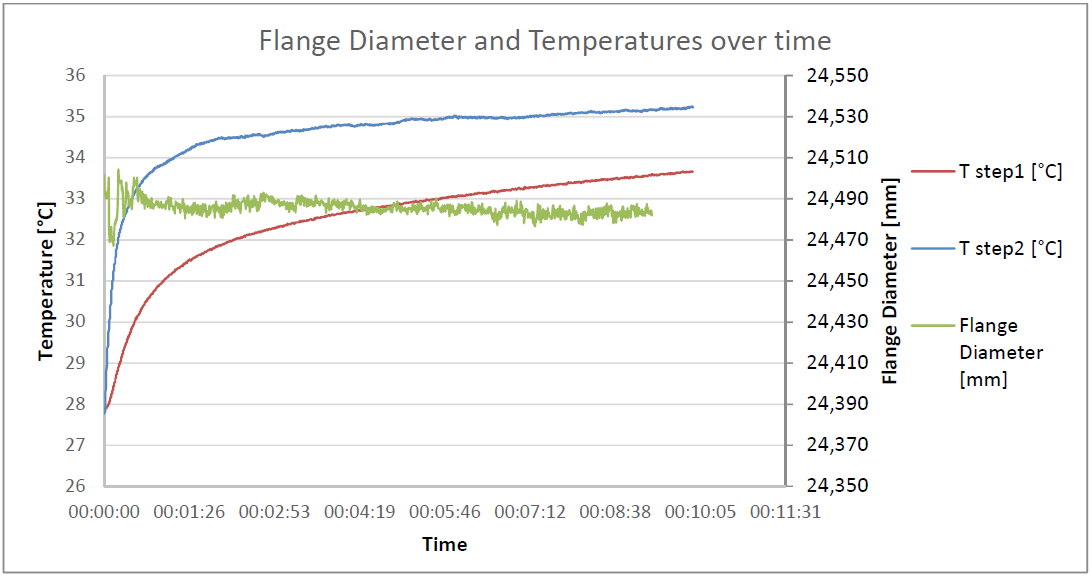
Fig. 19. Temperature and Flange diameter measurements over time with Z&G ZS10 Lubricant and lubricant setting at 400ml/hour
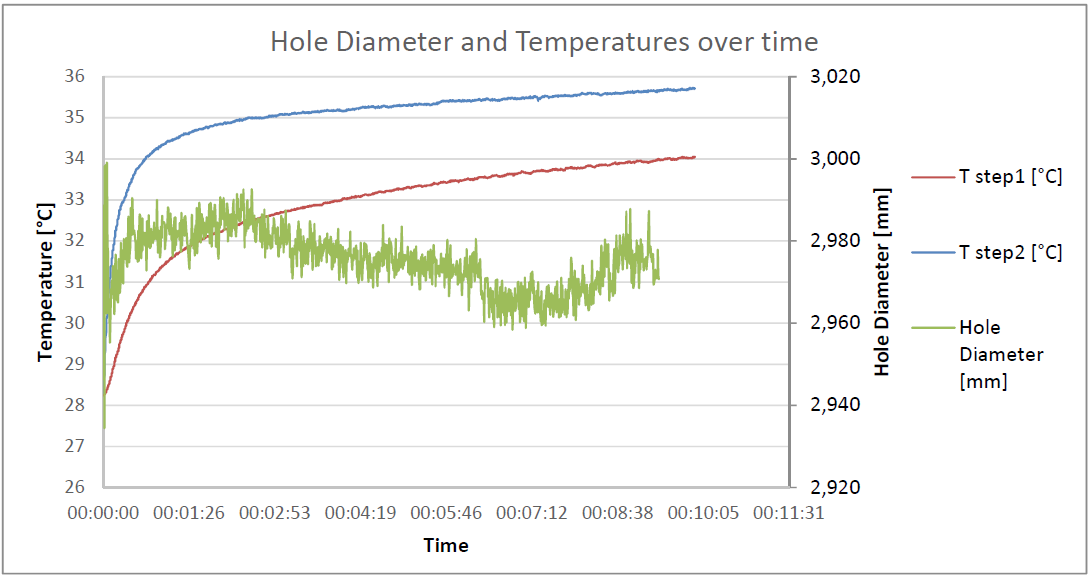
Fig. 20. Temperature and Hole diameter measurements over time with Z&G ZS10 Lubricant and lubricant setting at 600ml/hour

Fig. 21. Temperature and Flange diameter measurements over time with Z&G ZS10 Lubricant and lubricant setting at 600ml/hour
