1 Introduction
Individualization and precision as trends in the manufacturing industry require decreasing the number of forming parts per run while maintaining or even improving quality and production speed [1]. Numerous process parameters influence the forming process and the part quality. One significant parameter is the friction which highly affects the geometry of the forming part and thus the producibility, see Fig. 1. High process stability is needed, which can only be achieved by predicting and controlling the transient process and temperature increase at start of production. Tool heat-up in the start-up phase negatively affects the production stability by increasing the friction. This leads to product failures. The handling of the transient temperature effects is currently done reactively, by trial-and-error approaches, based on the individual experience of the machine operators.
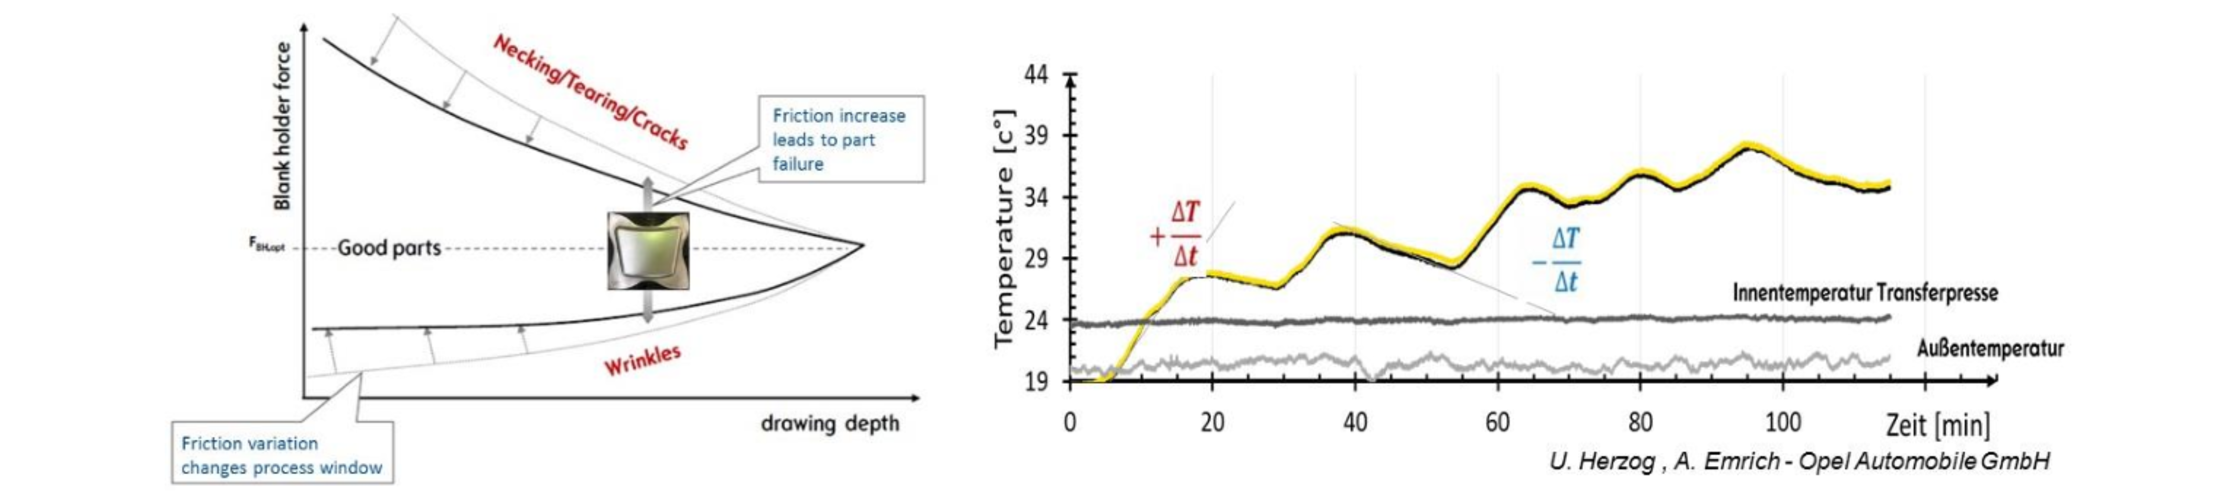
Fig. 1. Friction influence on process window and part failure and non-steady temperature progression in real forming tool [2].
Furthermore, a lot of forming simulations still not consider friction variations. They use a temporally and locally constant friction coefficient µ (see chapter 2). However, it must be considered that the friction coefficient changes temporarily and locally. Some of those approaches are specified in [3]. In a European funded project called ASPECT, much effort was done for measuring and modelling the temperature dependence of friction [4], [5], [6]. This paper focuses on experimental results.
2 Basics of Friction in Sheet Metal Forming
In the forming process, the blank slides from the blank holder area into the die. Sliding friction with lubrication occur in the contact area. A certain friction is necessary in local tool areas for controlling the material flow. In other tool areas, however, low friction must be achieved to ensure high strain without cracking. Numerous studies, started already with WILSON at 1st ICTMP in 1997 [7], have analysed friction, apart from material properties, as a substantial influencing factor. The friction share increases with drawing ratio to become more and more the process limiting variable. Thus, a possible friction increase can lead to part failure in form of necking or cracks. But also friction variations can change the process window and result in part failure, see Fig. 1.
Common description of friction is the law of COULOMB with a proportionality of friction force FR and normal force FN . The proportionality factor is characterised as friction coefficient µ.

It is assumed that friction force and direction of relative movement are oriented contrary. It must be pointed out that constant values of the friction coefficient describe the reality insufficiently. Numerous studies detected a dependence of the friction coefficient both on the tribological system [8] and on normal load, sliding velocity or temperature (see also chapter 3.3).
The sheet slides on lubricating films of molecular magnitude. With insufficient lubrication, the boundary layers may break up locally and weld joints may develop. With an increase of sliding velocity and quantity of lubricant, portions of the interface are supported by hydrodynamic fluid lubrication (boundary or mixed friction). The thickness of the lubricating film increases, but the lubrication gap remains smaller than the surface roughness heights of tool and sheet. With further increase in sliding velocity and with enough lubricant, complete hydrodynamic friction can be achieved. This condition, however, cannot be obtained in practical metal forming operations. The greatest influence of sliding velocity, normal stress and lubricant viscosity occurs in the area of mixed friction [9]. In this case, the sheet must contain the lubricant as long as possible in the contact area during the sliding action.
3 Friction Tests with Temperature Variation
3.1 Basics of Strip Drawing Tests
Both for technical and economic reasons it is hardy possible to analyse the frictional characteristics in real processes. Instead, the analysis in a model test considering the characteristics of the forming process has proven to be reasonable. Therefore, suitable model tests must be used which enable the direct measurement of the friction. But the request for instrumentation accessibility contradicts with result transferability on the real process. For the selection of a test principle a suitable compromise between all requests must be found. Considering the special characteristics of the forming process, those tests must reproduce the relevant tribological system and load. Due to the complex microscopic friction mechanisms it is obvious to use a strip drawing test instead of abstract testing principles like pin-on-disc tribometer or others. Thus, a variety of strip drawing tests were developed by pulling the sheet metal through a fixed tool. To emulate the locally varying tribological characteristics at certain specific areas, those tests reproduce different individual tool sections (Fig. 2).
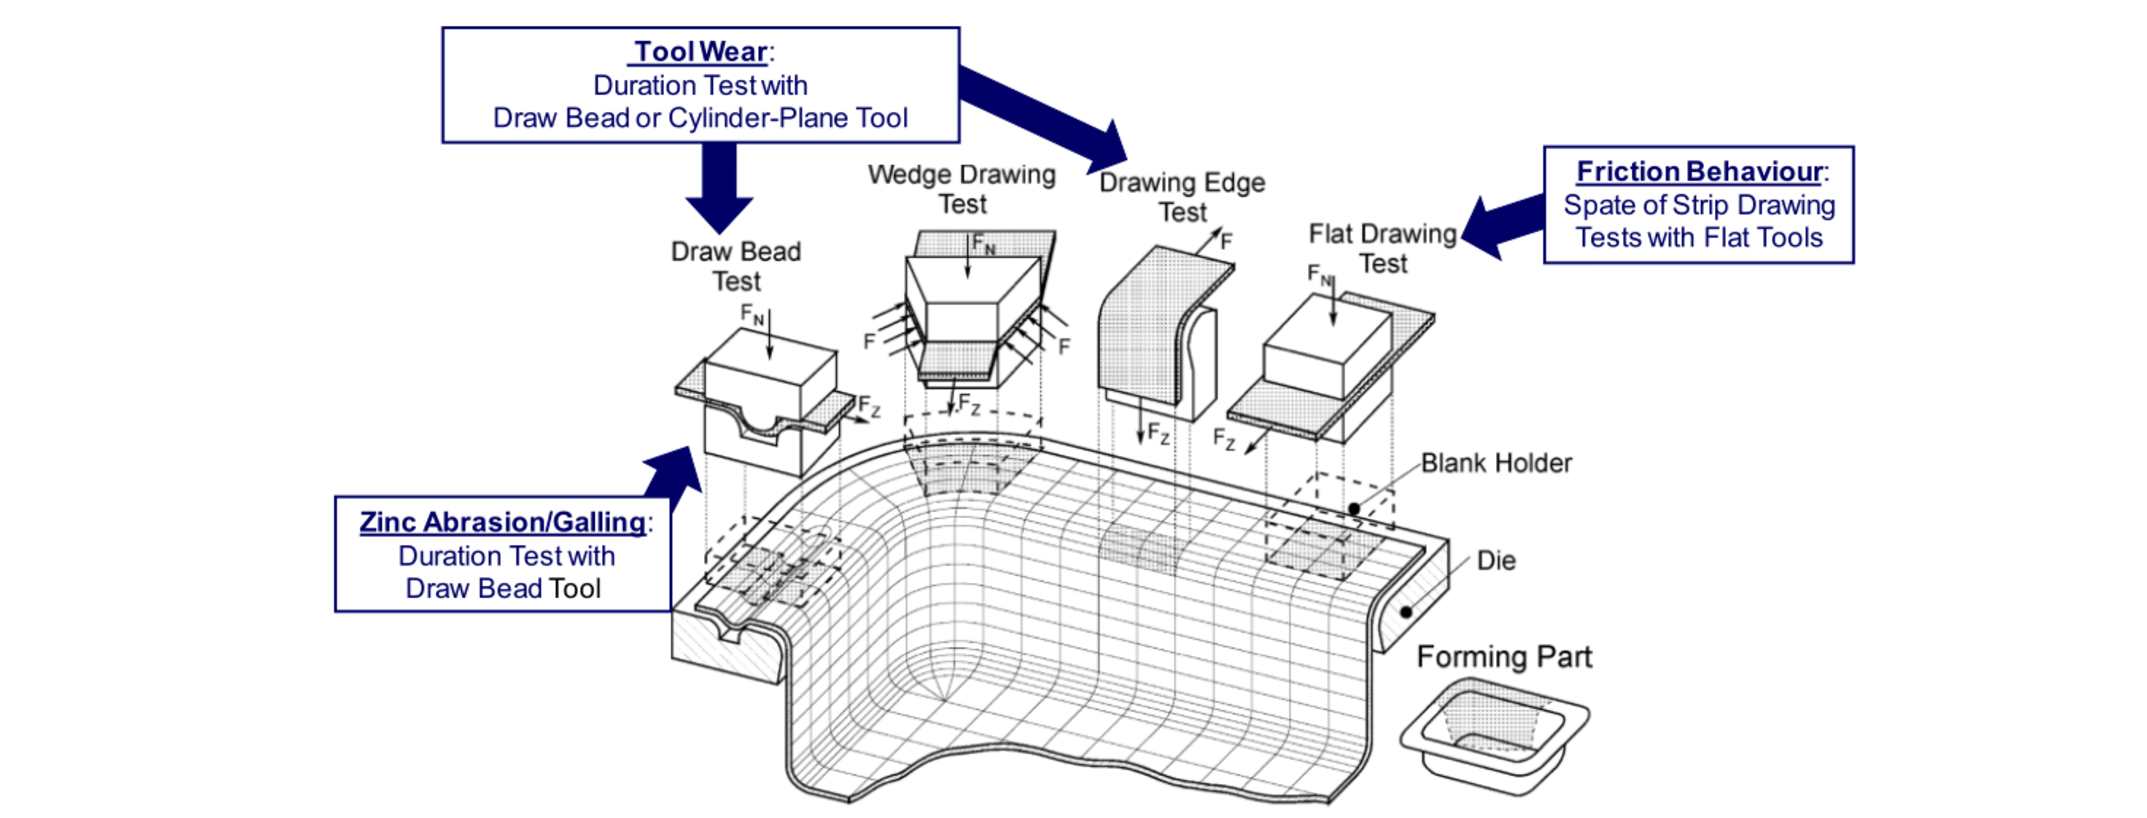
Fig. 2. Strip drawing tests reproducing different tool sections [10].
Important for choice of tool section is the objective, whether friction or tool wear should be analysed. Tool wear always occurs at sections with high normal load and relative motion between sheet and die. These conditions are acting especially in the area of sheet bending like drawing edge or draw bead. For judgment of the friction behaviour, in contrast, the flat contact area under the blank holder is of major interest, because the forming result is influenced primarily by the friction forces acting in these large areas.
3.2 Description of Test Method
FILZEK TRIBOtech and Darmstadt University of Technology have developed a standard testing procedure for evaluation of friction behaviour in sheet metal forming ([10], [11]). The test stand enables strip drawing tests for the measurement of frictional forces directly at the tools (Fig. 3). Flat tools reproduce the tribological system blank holder-sheet metal-die.
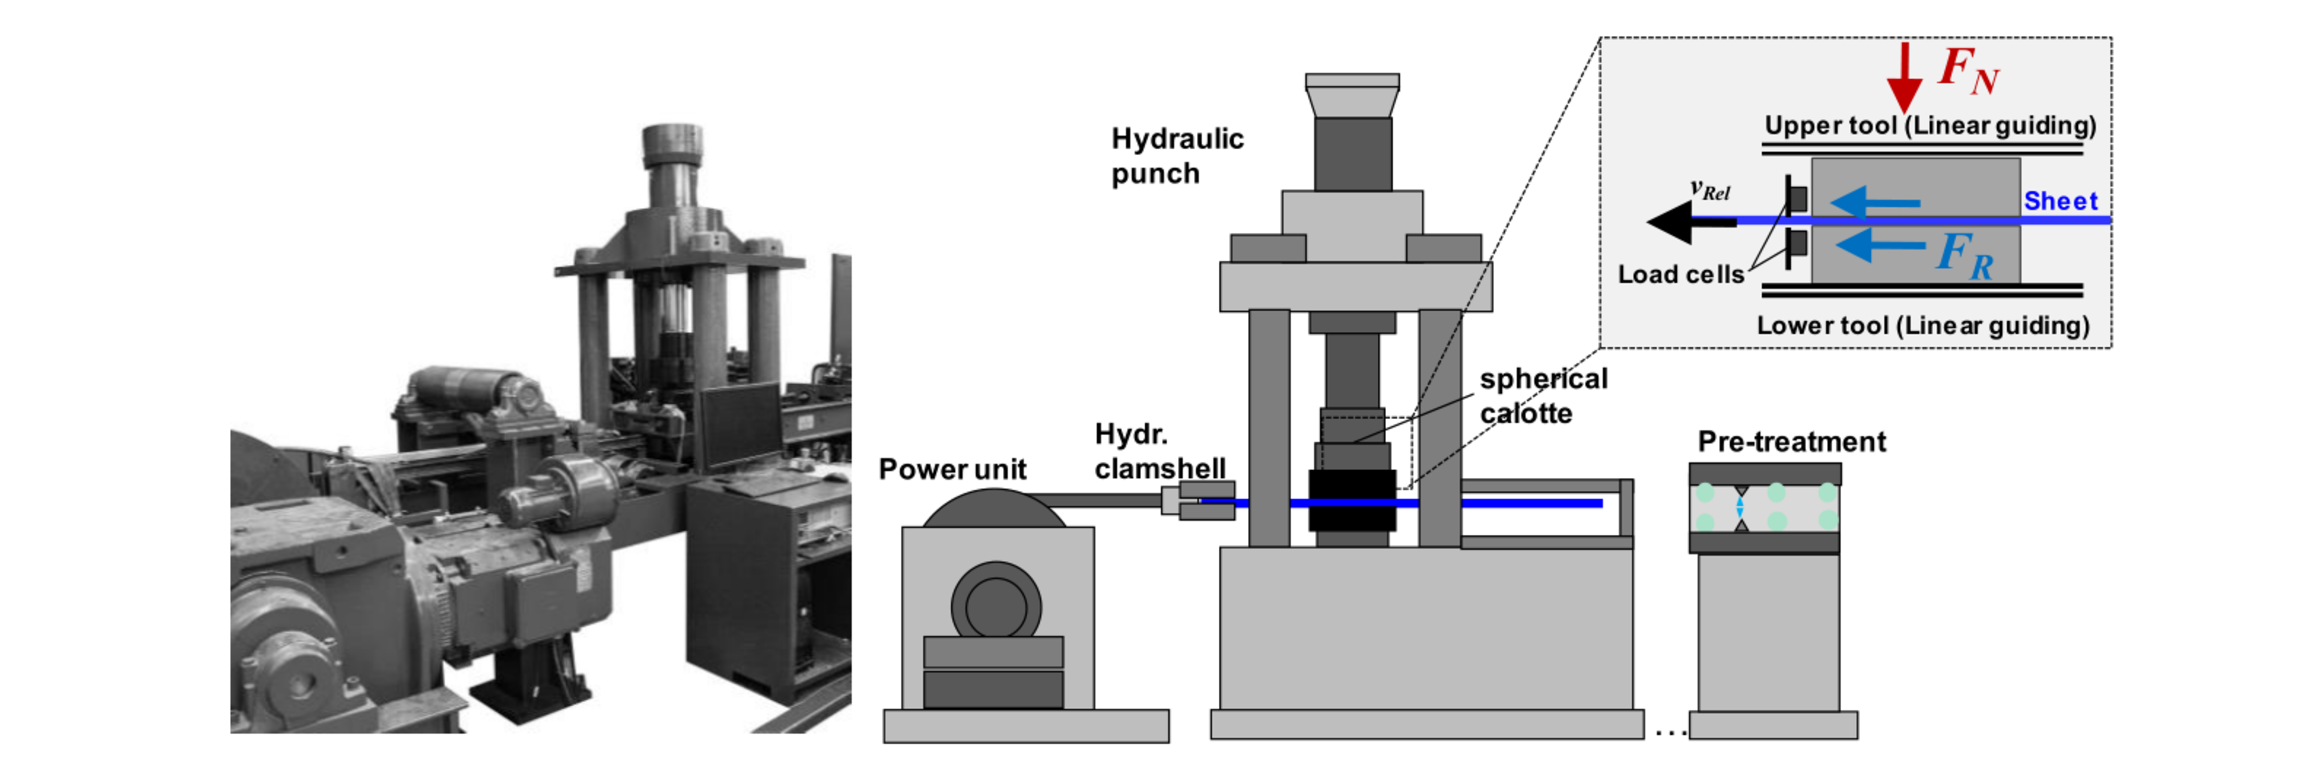
Fig. 3. Friction test stand according to VDA-guideline 230/213 using strip drawing principle.
The sheet metal material can be handled either directly from the coil or as single strips from blanks. A separate oiling unit applies lubricants exactly in a range of 0,3 – 5 g/m². The prepared sheet metal material passes into the tool stored on load cells. The friction forces and the normal force are measured and encoded as well as sliding distance and velocity.
Several additional construction parameters of strip drawing test stands are important for right emulation of the real process conditions. One parameter is the tool size. Just a sufficient tool width of over 40 mm can minimise the undesired and unrealistic squeezing out failure of the lubricant at the tool edges. In addition, a maximised tool length is desired to minimise tool tilting due to friction torque. This is important to assure even and homogeneous contact conditions. The right tool storage is also of importance. The best solution is the tool storage with load cells in-plane of the strip combined with a spherical calotte.
For each tribological system being tested, contact normal stress is varied systematically with all other conditions kept constant. It has been proven to plot the calculated friction coefficient µ versus contact stress for first analysis. The described test stand and test method is the result of a comprehensive development process within several PhD theses [12]. The suitability of this testing procedure was verified in different publications with comparisons to real forming tests [3], [8], [10]. In addition, this test stand and testing procedure is defined in a VDA (Association of German Automotive Manufacturers) guideline [13].
3.3 Friction Results
A lot of friction tests with variation of both tribological system parameters and technological parameters were executed within the ASPECT project. Special interest attracted the influence of the tool temperature and its interdependencies with other influencing parameters. A first comparison was conducted with different deep drawing steels for automotive body shell parts. The standard friction result (friction coefficient versus surface pressure) for deep drawing steel CR4 GI and bake hardening steel CR180 BH GI was analysed with the varied tool temperature as array parameter. Other parameters kept constant are the tool material cast iron (EN-JS 2070), a tool roughness of Sa = 0,3 µm, a low Prelube lubrication of 0,6 g/m² (Zeller+Gmelin PL61) and a sliding velocity of 50 mm/s.The temperature was varied for every parameter from 20 to 80 °C. The following figure contains on the left hand the exemplary result of CR4 GI. It shows the typical behaviour that the friction coefficient µ decreases versus surface pressure. The friction curve increases continuously with rising tool temperature. Overall, both materials show a very similar friction behaviour.
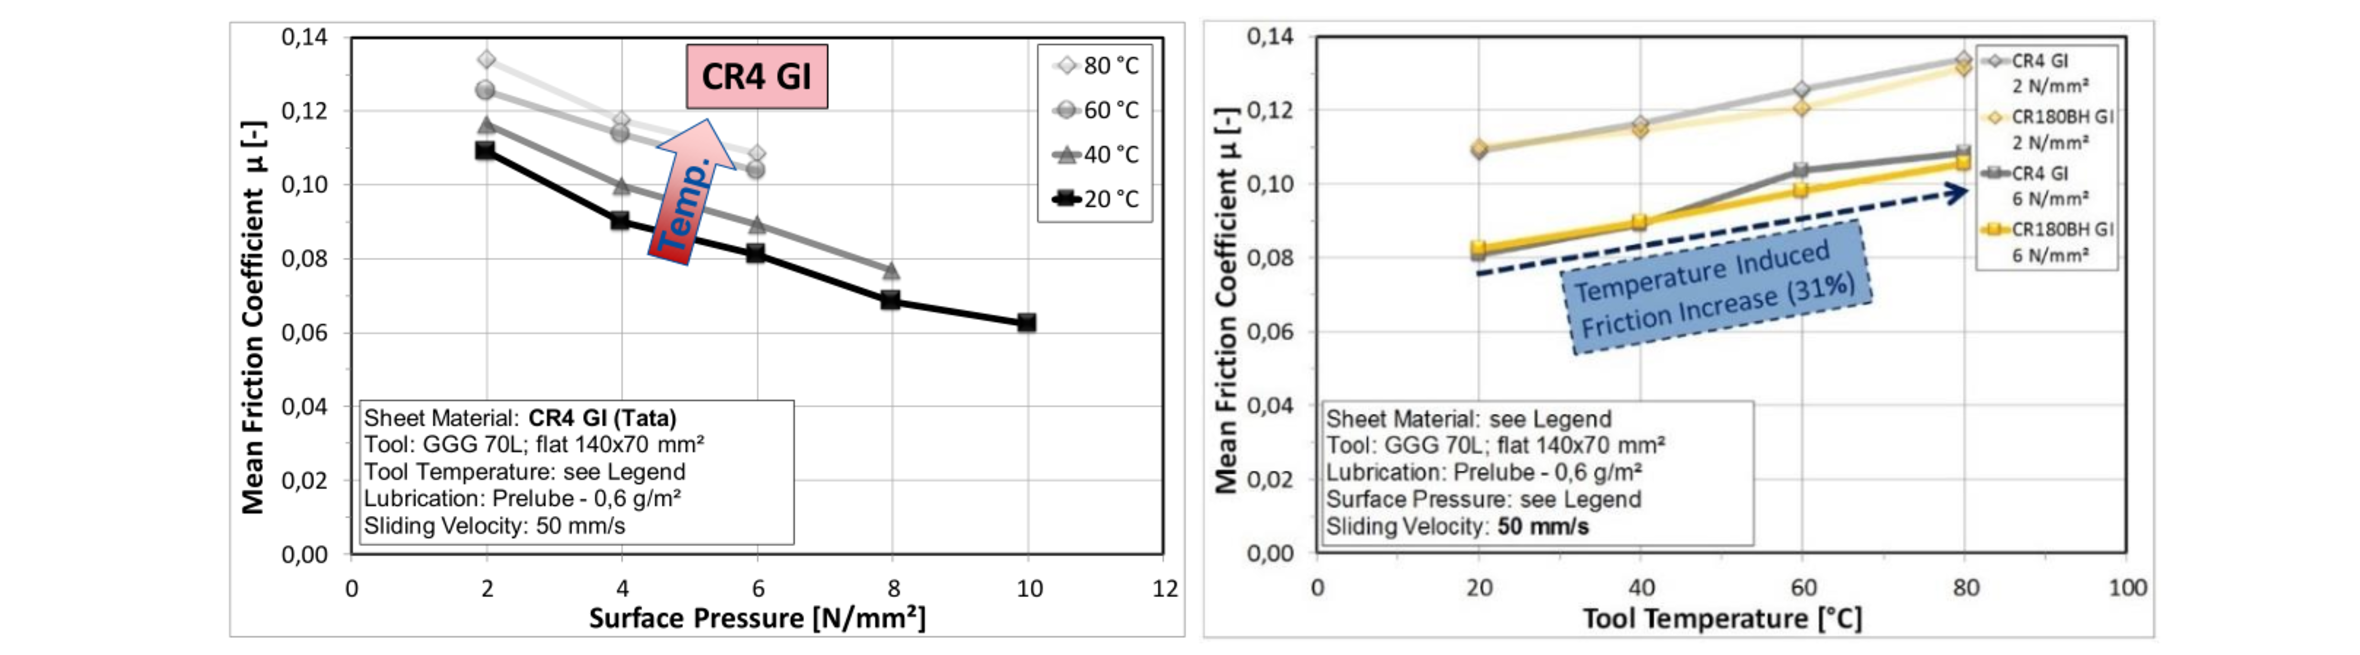
Fig. 4. Friction coefficient versus surface pressure for different tool temperatures.
The material comparison and the influence of the tool temperature is demonstrated in the right diagram plotting the results versus temperature with the surface pressure as the array parameter. The influence of the tool temperature is getting obvious, the increase from 20 to 8 °C is up to 31 %. The temperature influence is similar for both materials. At 20 and 40 °C, both materials show nearly the same friction. At higher temperatures of 60 and 80 °C, the deep drawing steel seem to show a little higher friction increase.
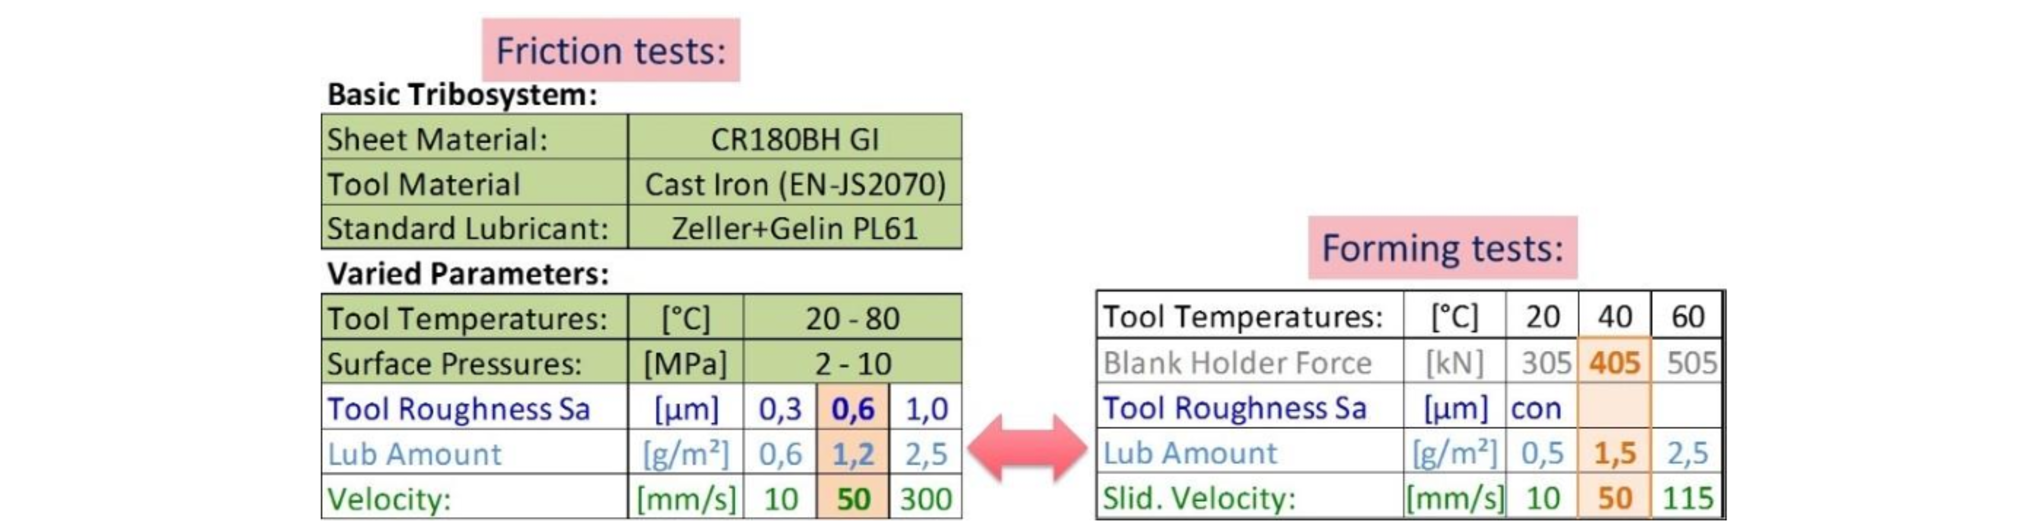
In order to analyse the influence of other parameters and their interdependencies with the temperature influence, a more detailed friction analysis was executed varying also sliding velocity, lubrication amount and tool roughness. A mean adjustment of all 3 parameters were chosen (red marked in the following table), and each parameter was varied from that base.
Table 1. Basic tribosystem and varied parameters (mean adjustment in red).

The following figure contains the friction result for the standard parameter combination marked red in Table 1 , left hand an array of friction curves for different temperatures versus surface pressure, right hand plotted versus tool temperature at selected surface pressures.
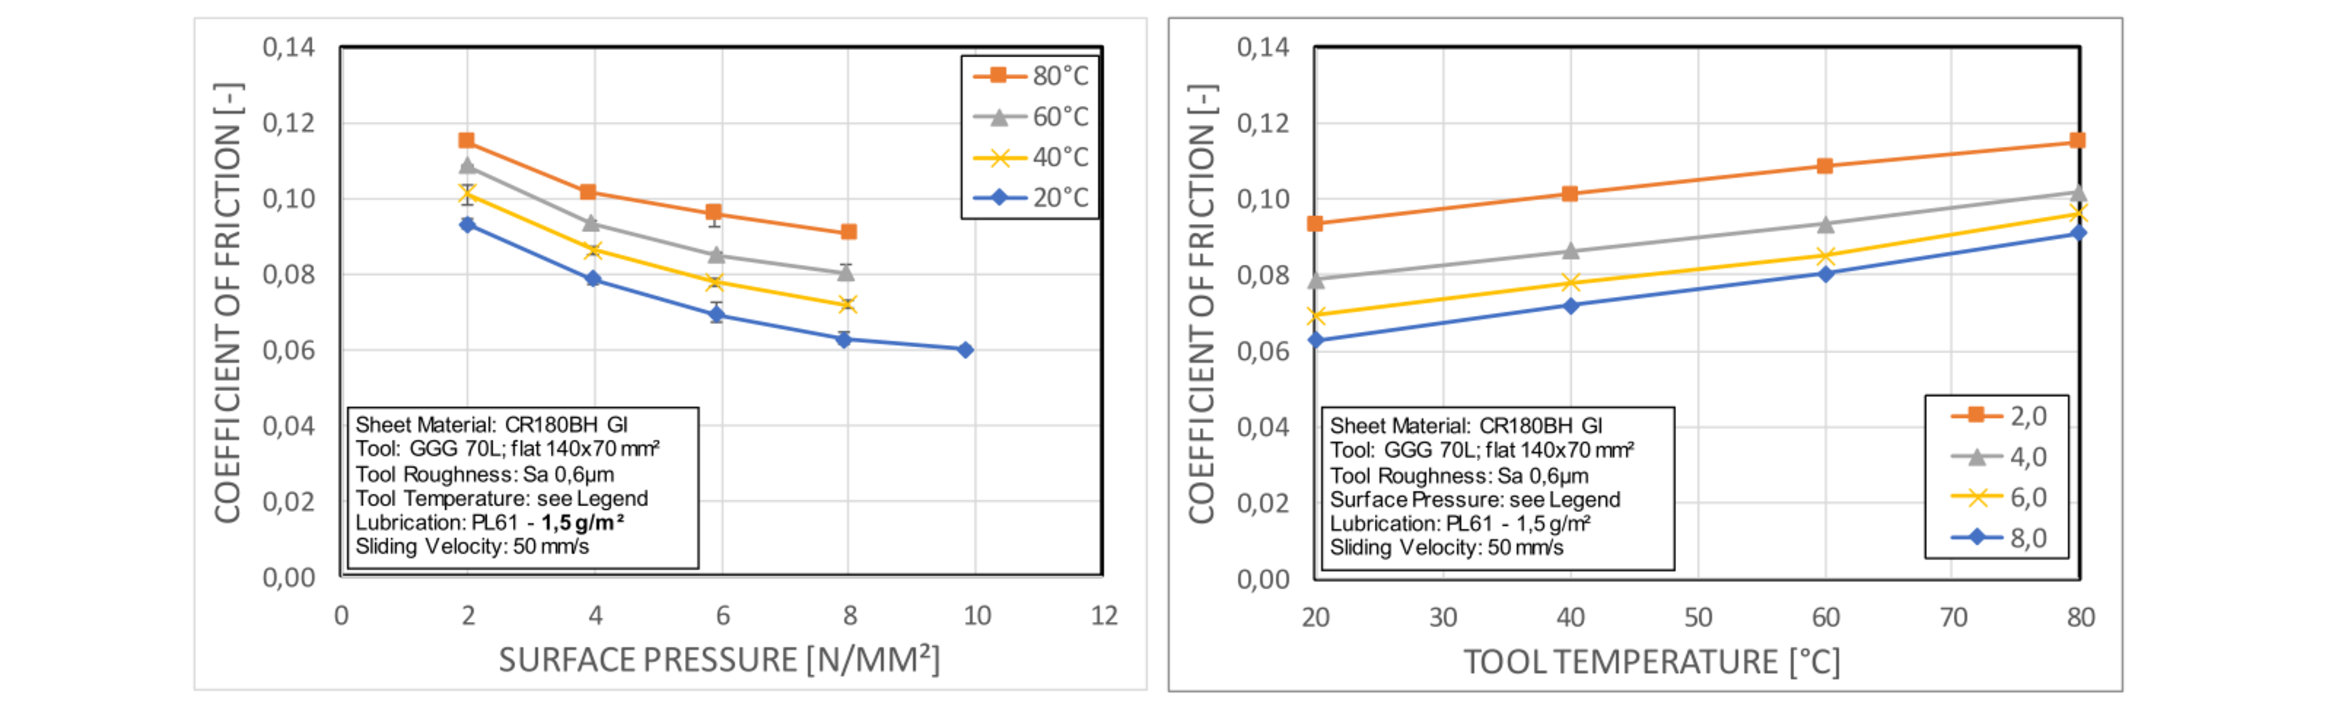
Fig. 5. Friction result for mean modulation of varied parameters.
Deviant from the material comparison above, this mean adjustment includes a higher tool roughness of Sa = 0,6 µm and a higher lubrication amount of 1,5 g/m². The tool temperature influence on friction is demonstrated well in both diagrams. The influence of surface pressure (inclination of friction curve versus pressure), is decreasing a little bit with higher tool temperature. Analysing the interdependency of the tool temperature influence on friction with other parameters, the lubrication amount turned out as the most impressive influence. The following figure show both the influence of lubrication amount at room temperature (left diagram) and the influence of tool temperature for three different amounts (right diagram).
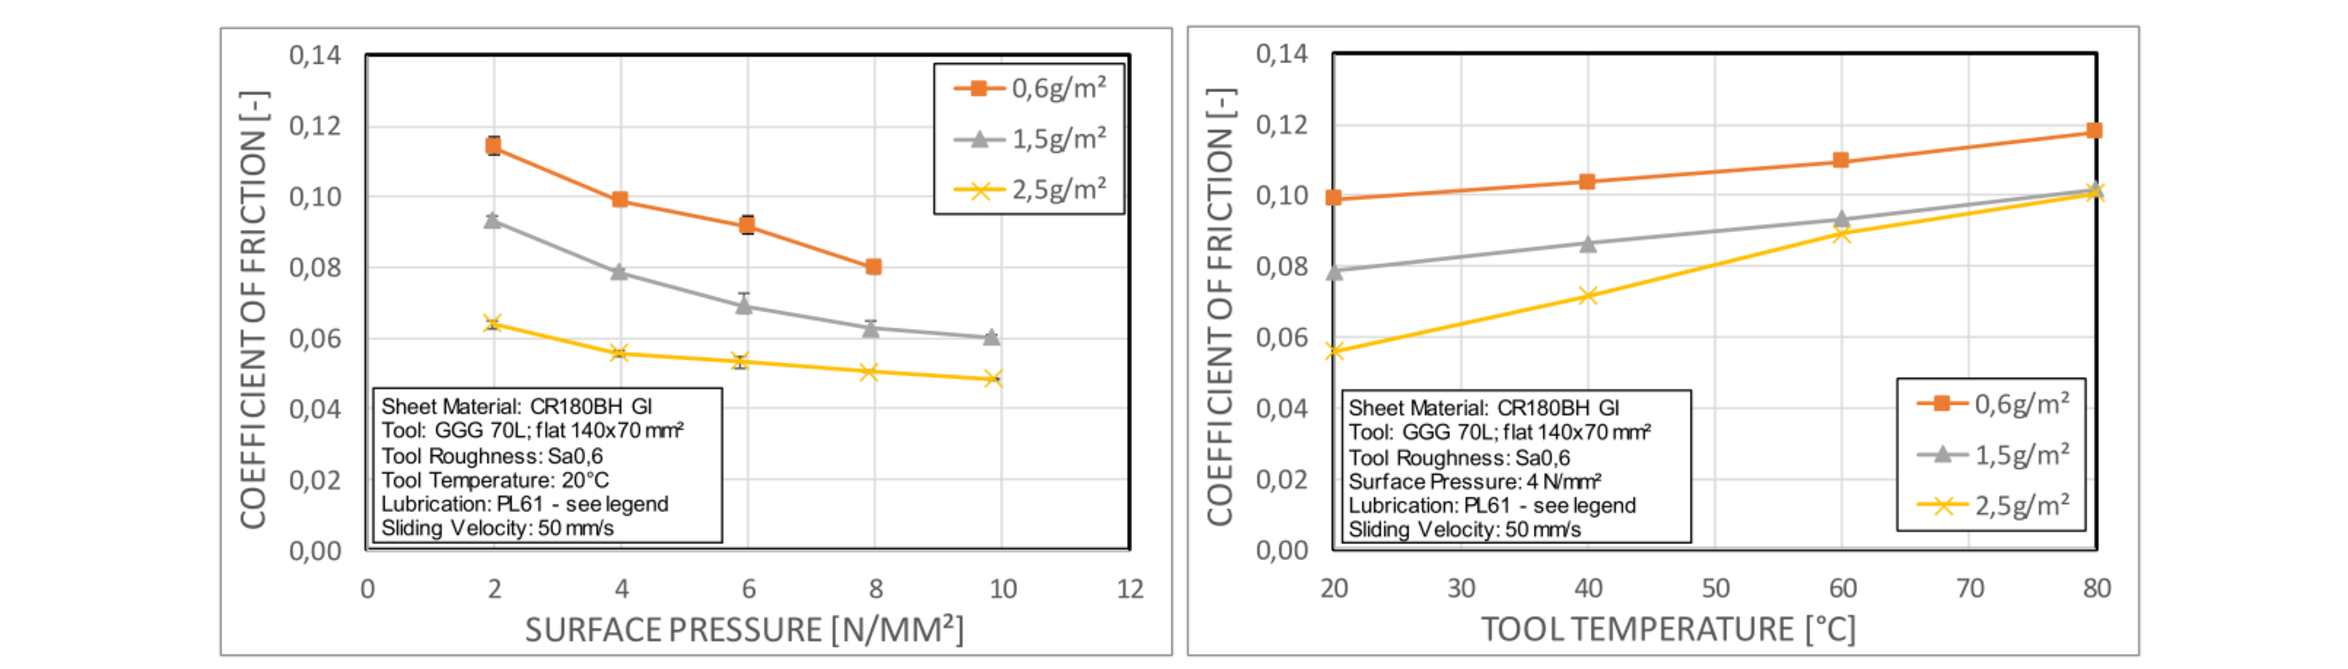
Fig. 6. Influence of lubrication amount on friction at room temperature (left) and interdependency with tool temperature influence (right).
The friction decreases significantly with higher amount of lubrication. The lubrication influence is strongest at low surface pressure. The right diagram demonstrates a distinct increase of friction coefficient versus tool temperature. Concerning the interdependency of lubrication amount with tool temperature, it must be pointed out that the lubrication influence is highest at low temperature. And it decreases more and more with rising temperature, as the friction curves converge versus tool temperature. In other words, the higher the amount of lubrication is, the higher is the temperature induced friction increase. This behaviour arises from the fact that the viscosity of the lubricant decreases with higher temperature. So, a higher lubricant amount can affect the friction best at low temperatures. At high temperatures of 80 °C for instead, the lower viscous lubricant can’t affect the friction behaviour so much, ergo the friction of different lubrication amounts is more contiguous.
The following table summarises these results with values of percental friction changing Δµ. In the left table, it is related to the lowest lubrication amount of 0,6 g/m² to quantify the influence of lubrication amount. And to quantify the temperature influence, it is related to the lowest temperature in the right table.
Table 2. Friction changing Δµ in dependence of lubrication amount and tool temperature.

Similar behaviour and interdependencies can be analysed when varying the tool roughness instead of the lubrication amount. The following figure show both the influence of tool roughness at room temperature in the left diagram and right hand the friction curves of different tool roughness’s versus tool temperature. Similar to the influence of lubrication amount, the friction decreases significantly with lower tool roughness in the left diagram. The right diagram demonstrates again a distinct increase of friction coefficient versus tool temperature. Concerning the interdependency of tool roughness with tool temperature, the tool roughness induced influence on friction is highest at low temperature, and it is reduced with increasing temperature, as the friction curves converge versus tool temperature. The lower the tool roughness is, the higher is the temperature induced friction increase. This behaviour arises from the fact that the lubricant can act better at low temperature. Thus, also a smoother tool roughness affects the friction best in form of lubrication effects at low temperatures.
Table 3 summarises these results with the values of percental friction changing Δµ. In the left table, it is related to the highest tool roughness of Sa = 0,9 µm to quantify the influence of tool roughness. And to quantify the temperature influence, it is related to the lowest temperature in the right table.
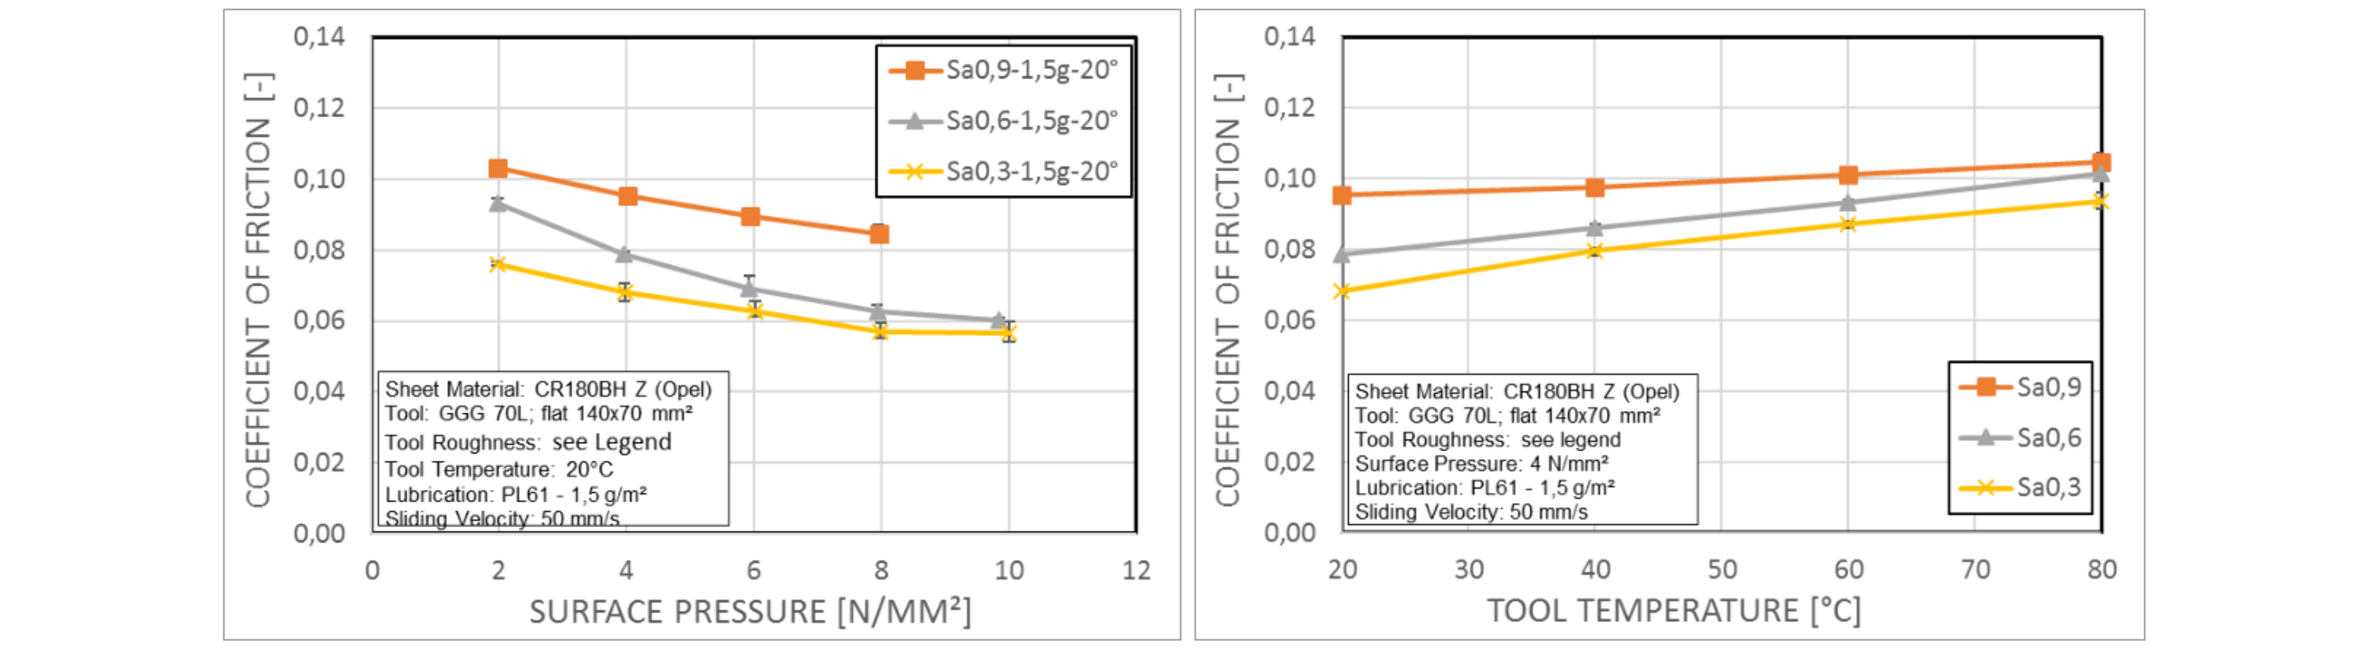
Fig. 7. Influence of tool roughness on friction at room temperature (left) and interdependency with tool temperature influence (right).
Table 3. Friction changing Δµ in dependence of tool roughness and tool temperature.

A little different behaviour and interdependencies can be analysed when varying the sliding velocity. The friction decreases significantly with higher sliding velocity. The influence seems to be independent of the surface pressure. The right diagram demonstrates the already known increase of friction coefficient versus tool temperature. The friction curves for different velocities proceed nearly parallel, but considering the percental changing, a similar interdependency between velocity and tool temperature must be pointed out, see Table 4.
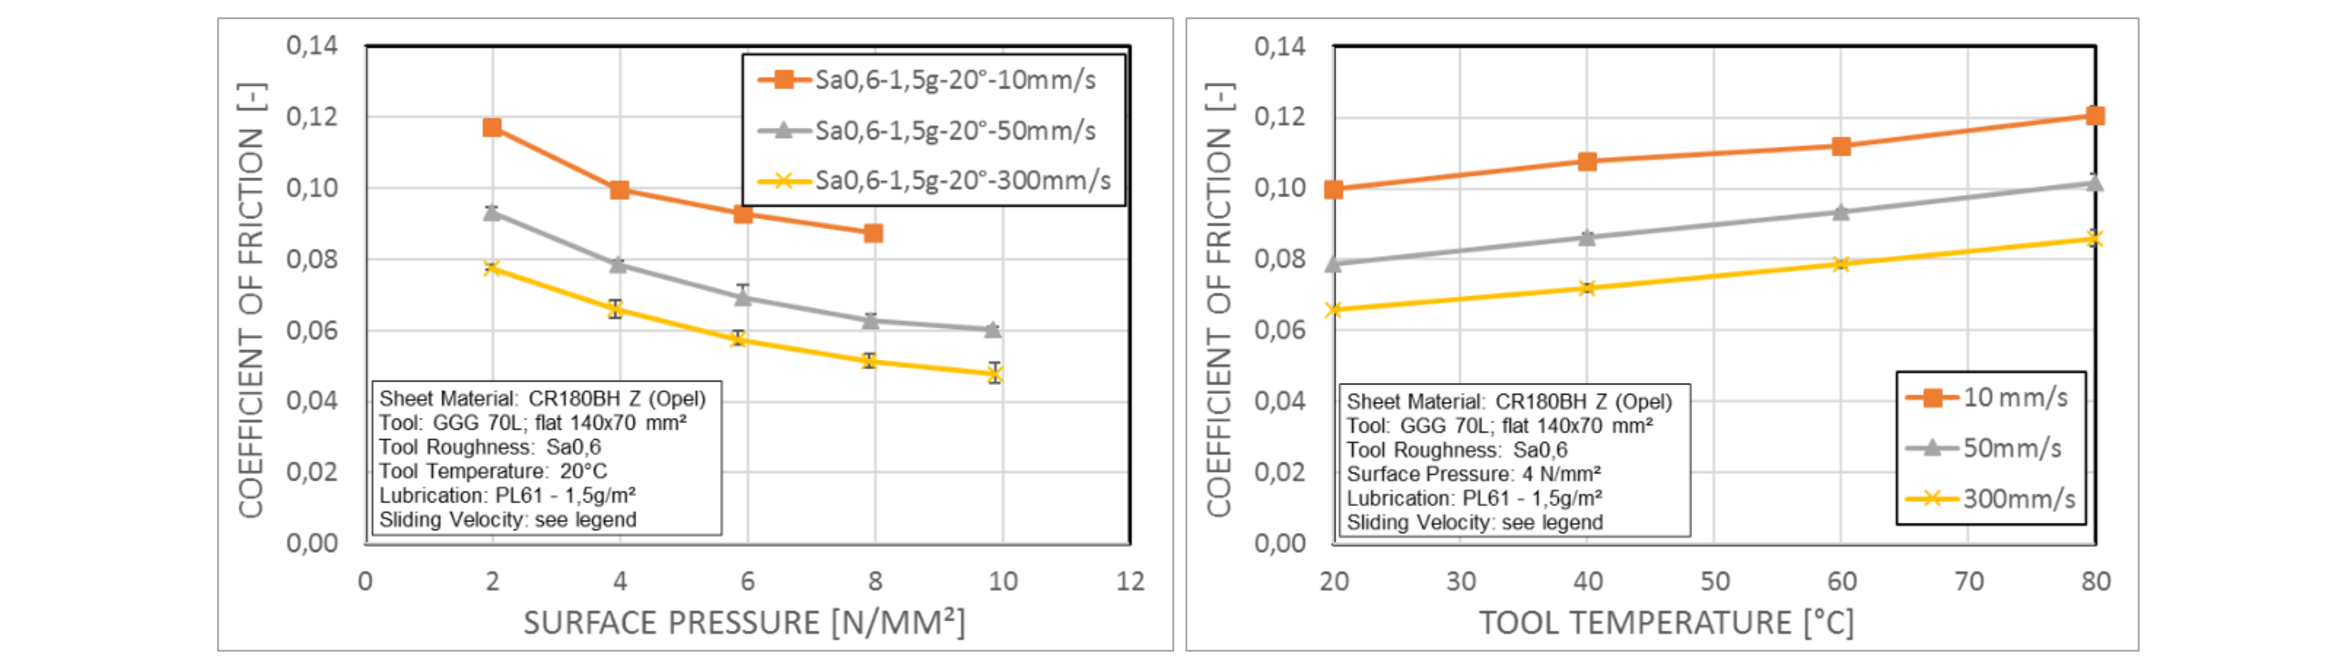
Fig. 8. Influence of sliding velocity on friction at room temperature (left) and interdependency with tool temperature influence (right).
Table 4. Friction changing Δµ in dependence of sliding velocity and tool temperature.

As summary of all these test results it can be asserted that all presented parameters have a significant influence of friction behaviour. And the influence of the tool temperature has a distinct interdependency with all these parameters.
4 Forming Tests with Temperature Variation
A further project part was the verification and demonstration of the friction influences, especially the tool temperature, in a real forming demonstrator. The demonstrator should enable detailed analysis of such friction impacts under reproducible laboratory conditions. Thus, deep drawing tests with temperature variation should be enabled. In addition, the lab-scale forming process should enable the demonstration of a control possibility to countersteer the negative temperature effects versus adapted blank holder force. Furthermore, it should enable the validation of friction modelling methods developed by other project partners. This led to the requirements that a part geometry close to reality must be realised, and the demonstrator tool must be heatable up to 100 °C. Of course, the forming process should be endued with a high friction sensitivity.
4.1 Basics of Forming Demonstrator
An extensive FE study was done with different possible geometries like rotational symmetric cup, simple rectangular parts and parts with similarities to car body components. The final result was the following lab-scale forming tool in Fig. 9. The complex, close to reality geometry was realized with a trapezoidal punch with concave and convex zones and angled walls.
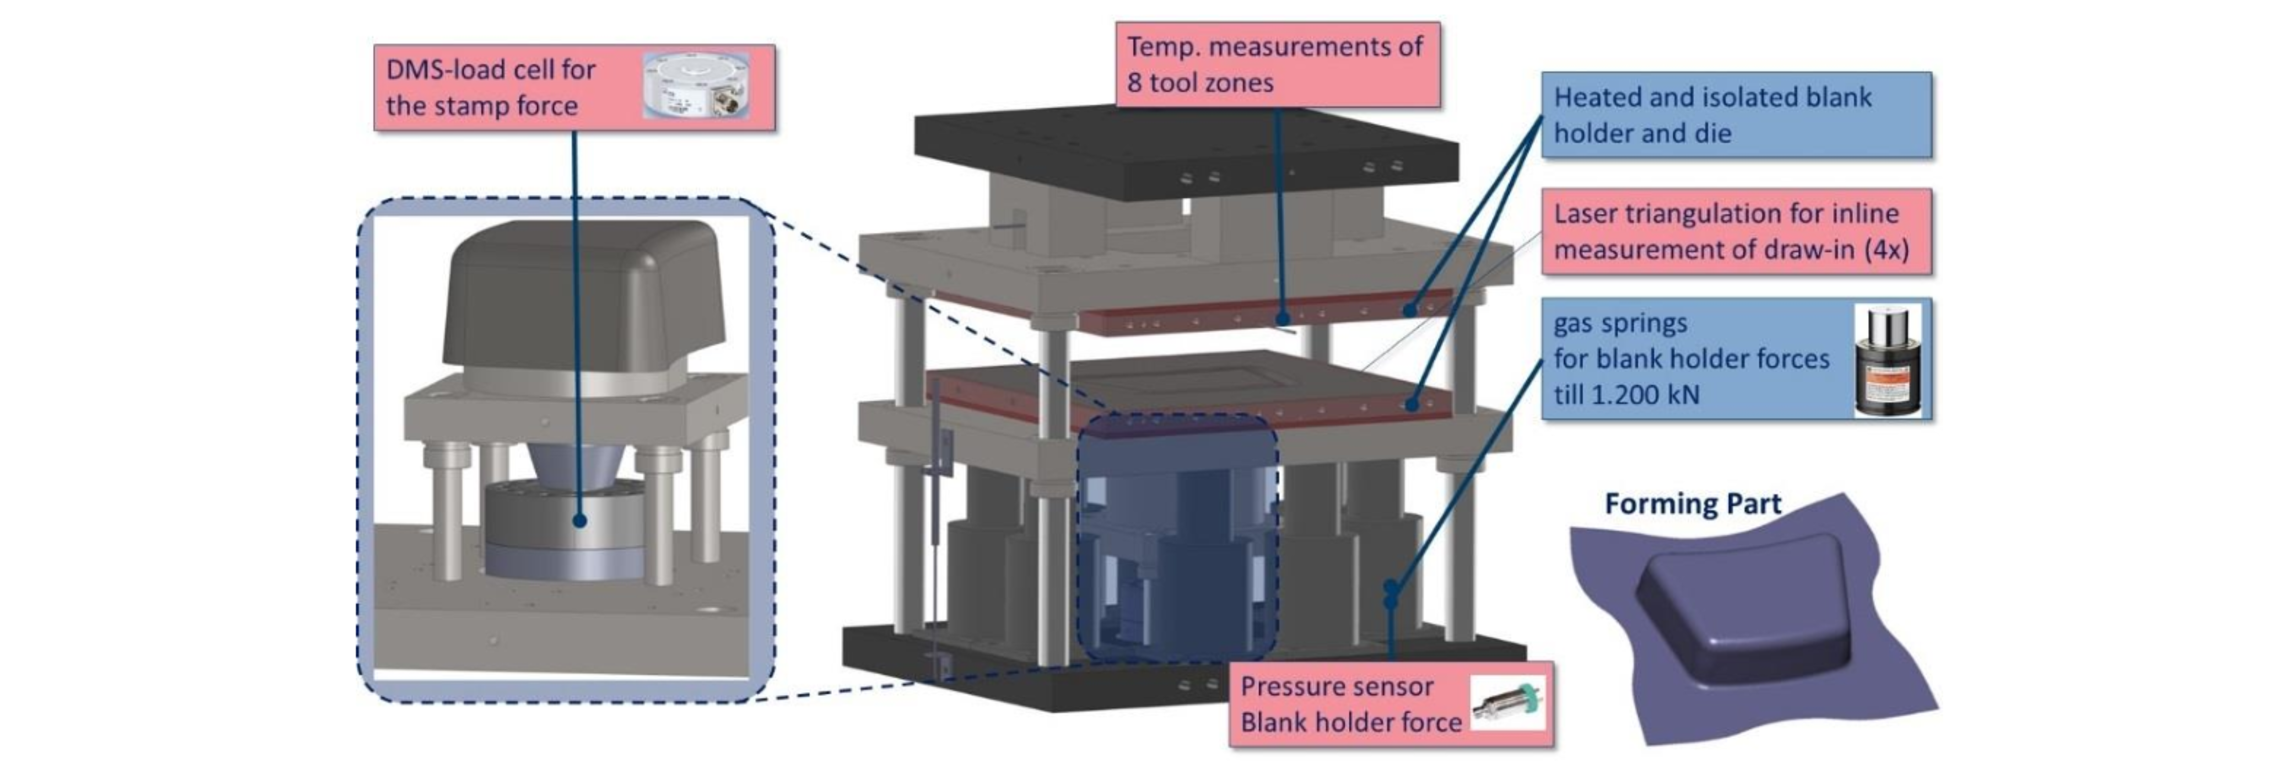
Fig. 9. Instrumentation of forming demonstrator.
Special features are that blank holder and die are heated and isolated respectively. The temperature is controlled in 8 independent zones at die and blank holders with temperature sensors in each zone. The tool has 8 gas springs to apply a blank holder force of up to 1.200 kN. In addition, an extensive measuring equipment is mounted. This includes sensors for measurement of drawing depth, blank holder force and a 500 kN load cell for the punch force. A special importance was attached to the measurement of the material draw-in. Therefore, an additional laser triangulation system (microepsilon) was implemented with 4 independent sensors at all 4 edges of the blank, enabling the inline measurement versus time or drawing depth.

Fig. 10. Laser triangulation inline measurement of material draw-in.
Finally, the tool is equipped with two HBM Quantum X universal amplifiers with 16 channels for punch force, blank holder force, drawing distance, 8 tool temperatures and 4 material draw-ins. The following figure shows the completely mounted tool. An exemplary forming part is shown in the right picture. The standard blank size is 570x465 mm², the punch size 475x345 mm², and the maximum drawing depth is 125 mm.
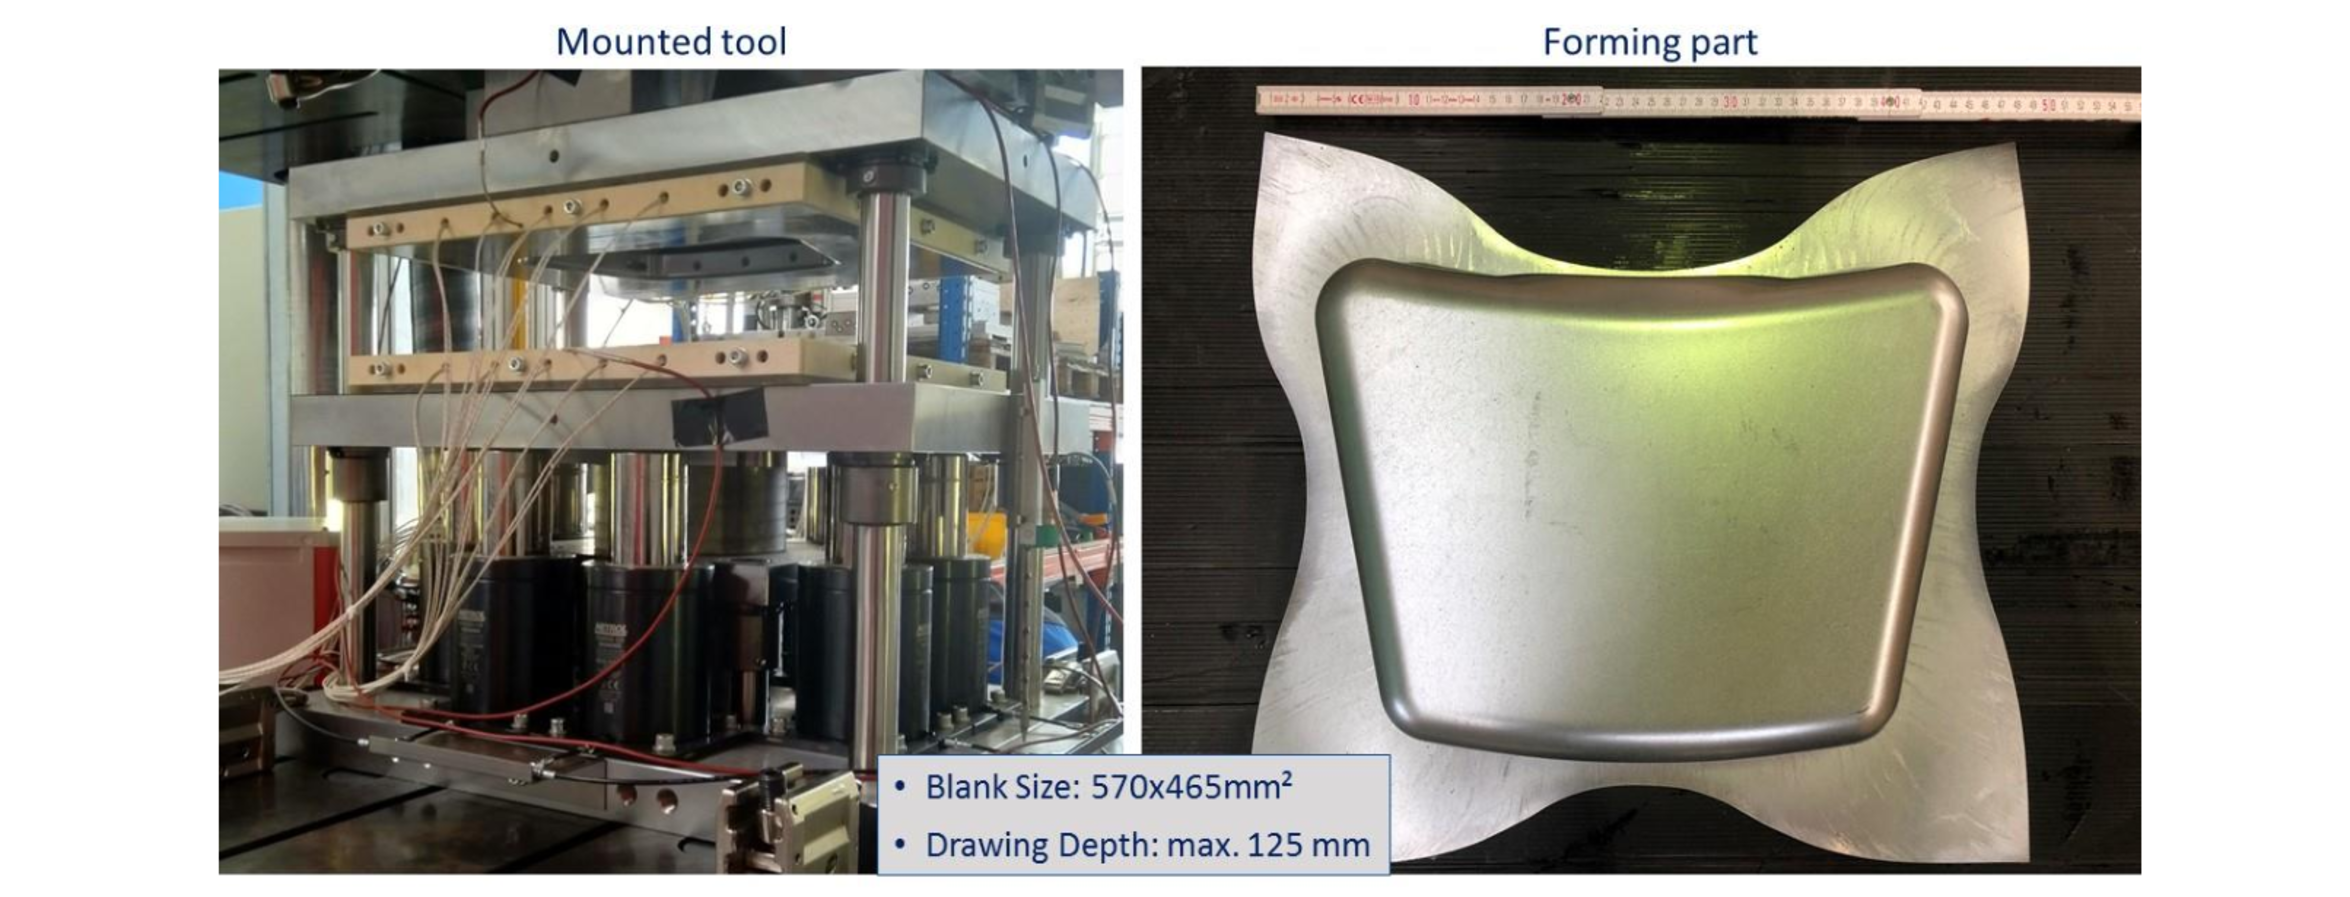
Fig. 11. Mounted tool and exemplary forming part.
4.2 Forming Results
The first analysis of friction sensitivity was executed with deep drawing steel CR4 GI at room temperature with different lubrication conditions. The next figure shows the maximum attainable drawing depth at a blank holder force of 505 kN, from left to right with high, medium and low friction.
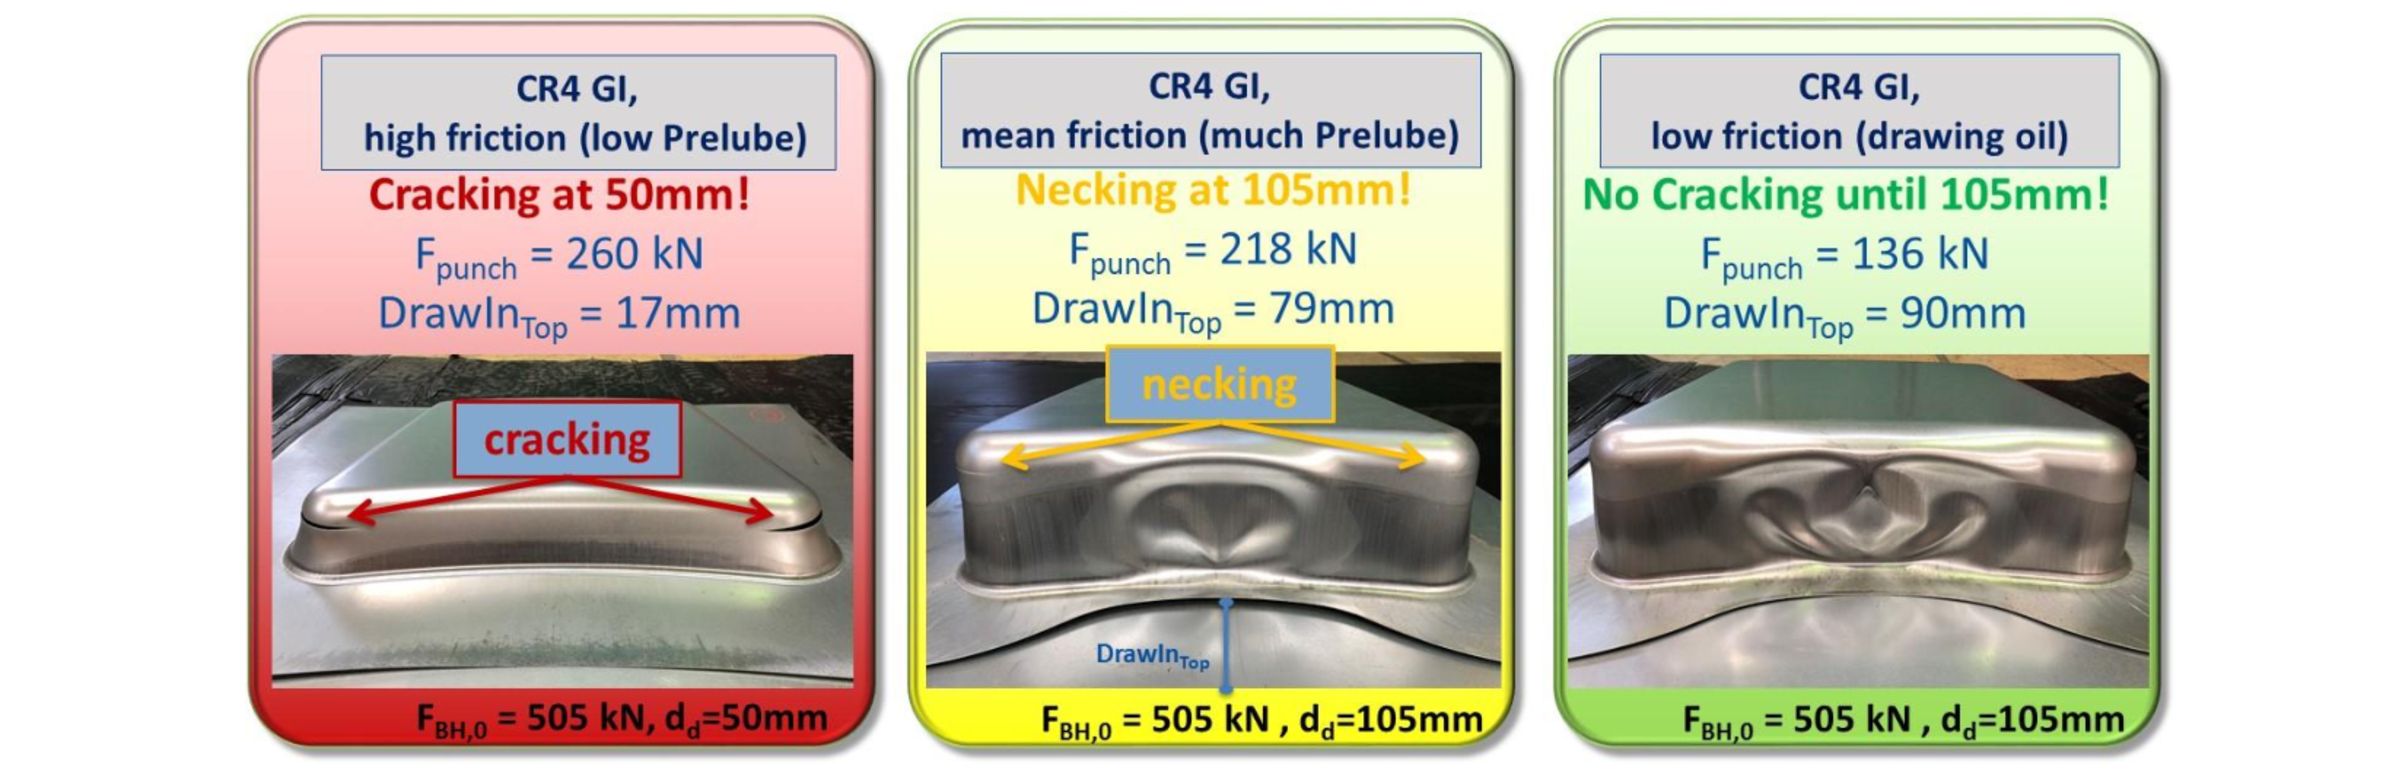
Fig. 12. First check of friction sensitivity.
Independent of the tribological system, the part always cracks in both corner radii of the longer base side called “top”, see Fig. 10. Also the main draw-in is always analysed at this concave curved side. At “high” friction, realised with a low Prelube (Zeller+Gmelin PL 61) lubrication of 0,5 g/m², cracks already occur at a drawing depth of 50 mm. In addition, the measured punch force amounts to a high value of 260 kN. The main draw-in is 17 mm. The middle of the figure represents the forming result at “mean” friction. This friction condition was rebuilt by a higher Prelube lubrication amount of 2,2 g/m². The process reaches distinctly higher drawing depths of 105 mm (+110 %), when the material starts necking in both corner radii. The material draw-in is significantly higher and gains 79 mm at the top. In addition, the maximum punch force reaches a lower value of 218 kN (-16 %).
The condition “low” friction was realised with a high viscous drawing oil (Zeller+Gmelin KTL N16) and a high amount of 2,2 g/m². The result demonstrated on the right-hand side of the figure is the forming part at the same high drawing depth of 105 mm and for scientific comparison with the same blank holder force of 505 kN. It has to be mentioned, that this blank holder force isn’t sufficient for such a low friction, because the too high draw-in leads to an extensive wrinkling of 2 nd order. Nevertheless, the sheet material doesn’t show any necking in any corner. The material draw-in increases to 90 mm, and the very low maximum punch force were measured with 136 kN (-48 %). These results prove a very good friction sensitivity!
The tool temperature influence on the forming process was demonstrated initially with the same material CR4 GI but now with a default drawing depth of 80 mm, a default starting blank holder force of 455 kN and a default lubrication amount of 2 g/m². The left box of the following figure shows the first result at room temperature. The mentioned default parameters were chosen in that way that the forming part is formed out well to a high strain, so near to the process limit of cracking. The maximum punch force amounts to 206 kN, the material draw-in gains 58 mm. Comparing the forming result at 60 °C in the central box, the influence of the temperature induced friction increase is getting obvious. Cracks occur in both corner radii of the long side. In addition, the punch force rises to 261 kN (+27 %), and the draw-in decreases to 49 mm (-15,5 %). The right box now demonstrates the idea of the ASPECT project, that the friction increase can be controlled by decreasing the blank holder force. Indeed, at the same tool temperature of 60 °C but with a reduced blank holder force of 355 kN, a good forming part without cracking or necking reached. The measured punch force is down to 239 kN, the maximum draw-in reaches a little higher 52 mm.

Fig. 13. Influence of temperature induced friction increase and principle of process control (reduced blank holder force) with CR4 GI.
In a later project part, a more extensive parameter study was executed with the bake hardening material CR180BH GI. It appeared curious that the higher strength steel didn’t reach the same maximum drawing depths as the deep drawing steel at comparable blank holder forces. Both materials showed similar friction, but the BH180 cracked earlier, see the following figure. A little disadvantage must be mentioned that this material was already aged for several months.

Fig. 14. Comparison of CR4 GI and CR180BH GI.
The temperature influence was analysed taking also into account the parameters that were already identified with its interdependencies in the friction tests above. Therefore, it was tried to copy the parameter variations of the friction tests on the real forming process. The tool roughness couldn’t be varied, but lubrication amount, sliding velocity and blank holder force (for varied surface pressure) could be varied similarly.
Table 5. Basic tribosystem and varied parameters (mean adjustment in red).
This analysis should focus in detail on material draw-in and punch force but without material cracking. Therefore, the forming tests presented in the following had to be executed with a lower drawing depth of 50 mm. A higher default drawing depth couldn’t be chosen because the forming part would crack already at high friction conditions like high tool temperature, low lubrication amount or low velocity. Fig. 15 compares the achievable forming results at different temperatures for the mean adjustment above. All four material edges show a decreasing material draw-in versus tool temperature. The absolute values of the draw-in are not so high (max. 26 mm) due to the low drawing depth. The temperature induced changing of the material draw-in was calculated additionally related to the initial forming result at room temperature in the table at the bottom of Fig. 15. And the changings were calculated also in percental values. All four edges show a temperature induced reduction in material draw-in of 4,1 – 16,3 %. The average increase of the material draw-in over all edges reaches 8,4 %.
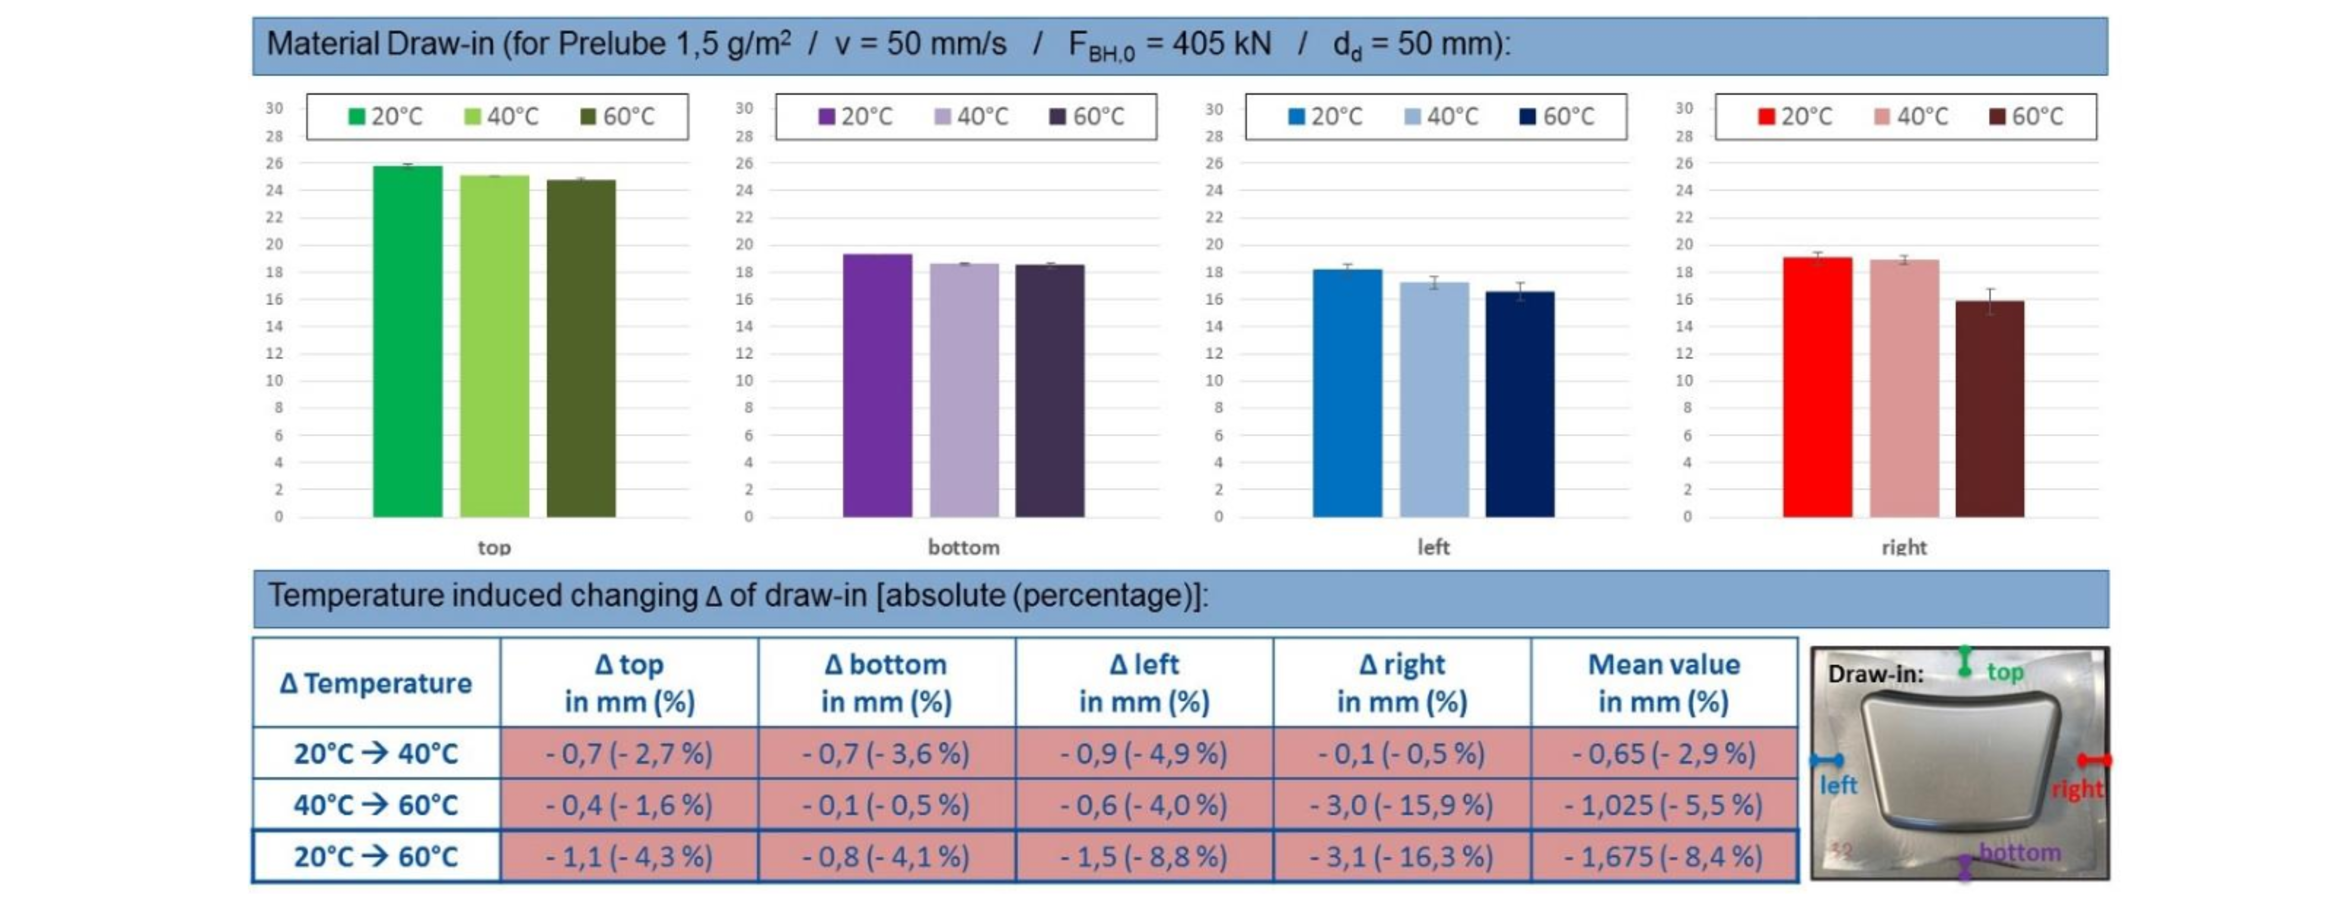
Fig. 15. Material draw-in and temperature induced changing.
Furthermore, the punch force was measured at the different temperature tests. And a single value at a drawing depth of 45 mm (shortly before slow down of press) was taken to quantify the temperature influence, as demonstrated in the following figure. The punch force reacts a little more sensitive on the temperature increase, it rises by 17 kN or 10,4 % from 20 to 60 °C.
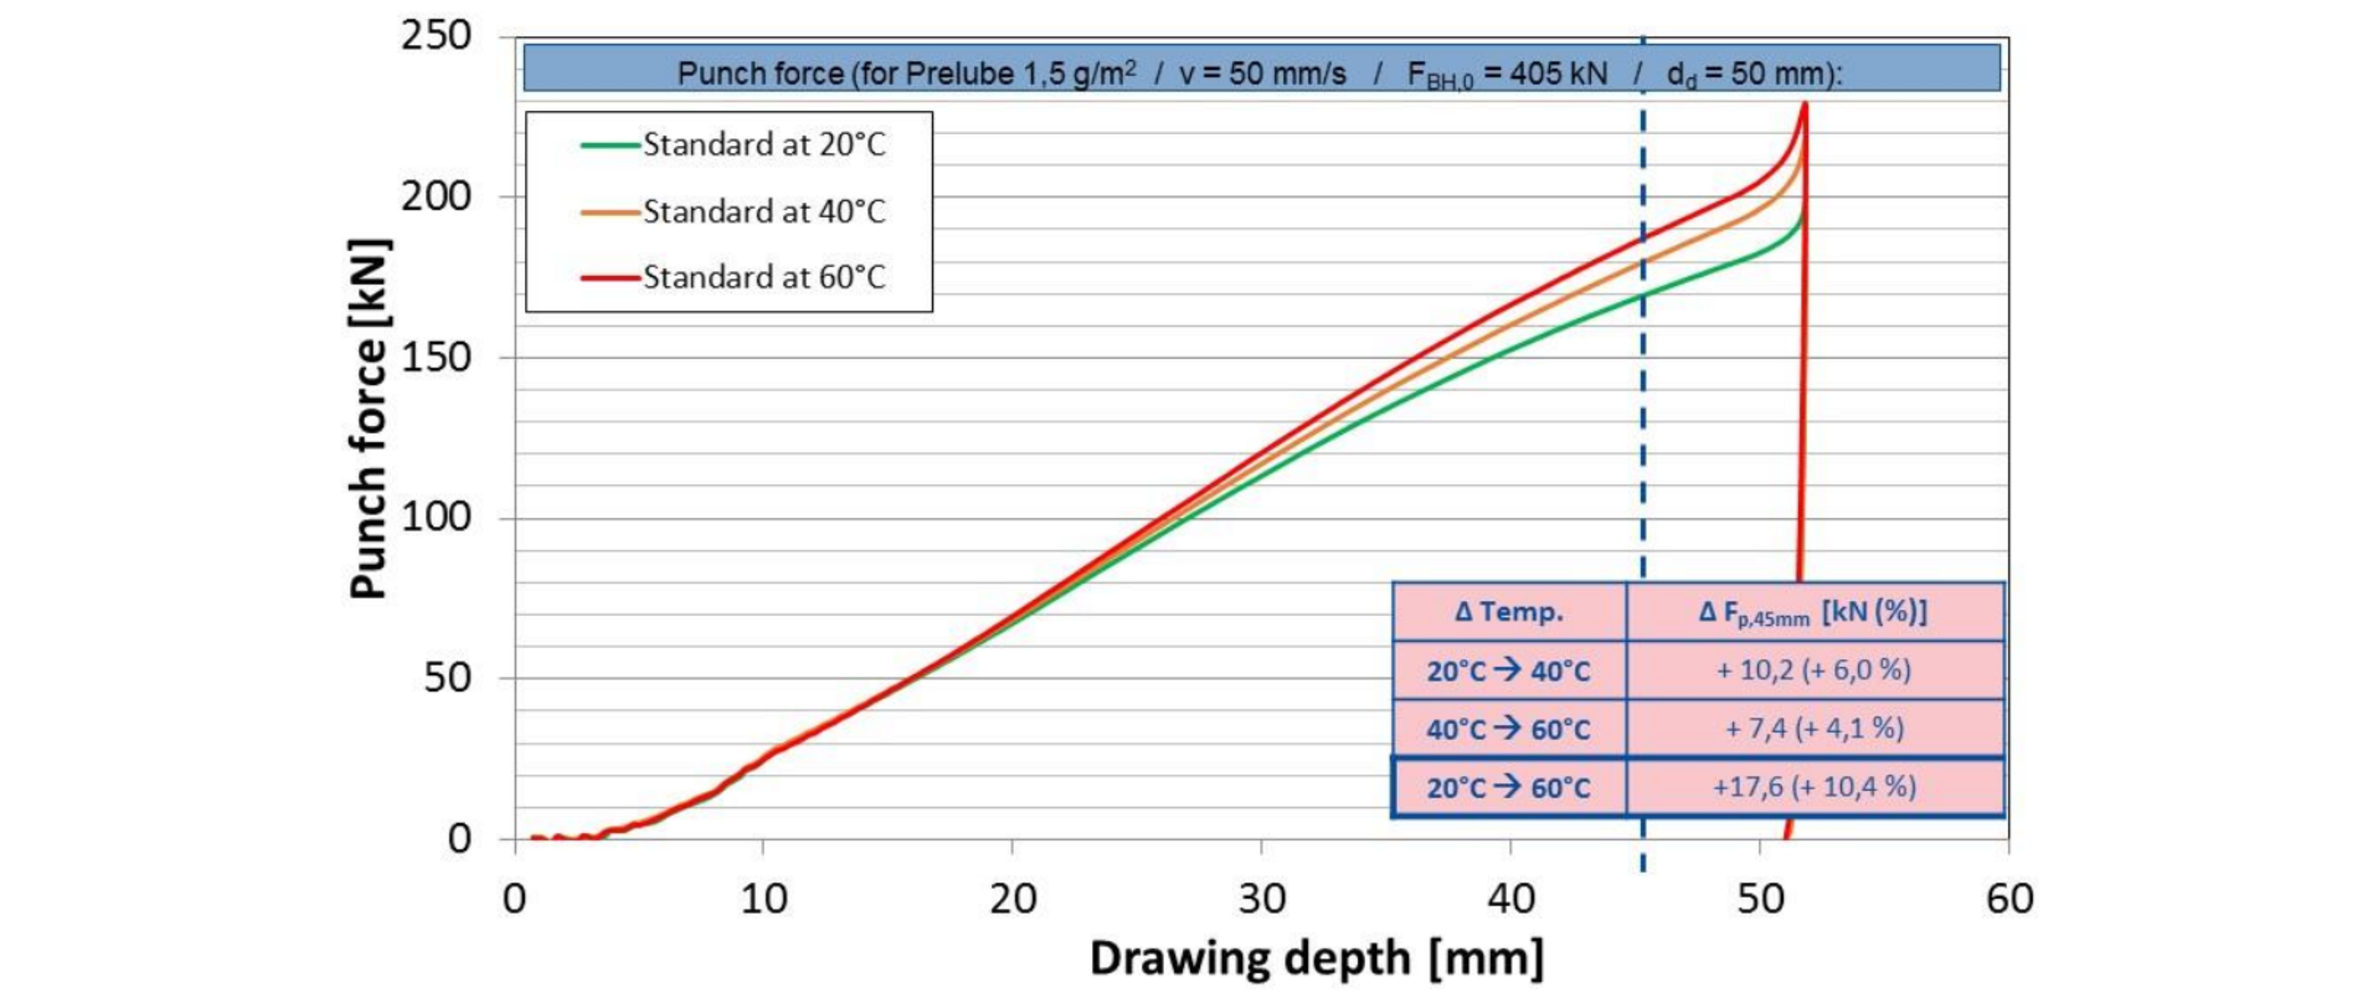
Fig. 16. Maximum punch force and temperature induced changing.
Hereinafter, the influencing parameter lubrication amount is presented at a mean tool temperature of 40 °C, because it gained the strongest influence both in the friction tests above and in the forming tests. The following figure compares the three different lubrication amounts in the same way.
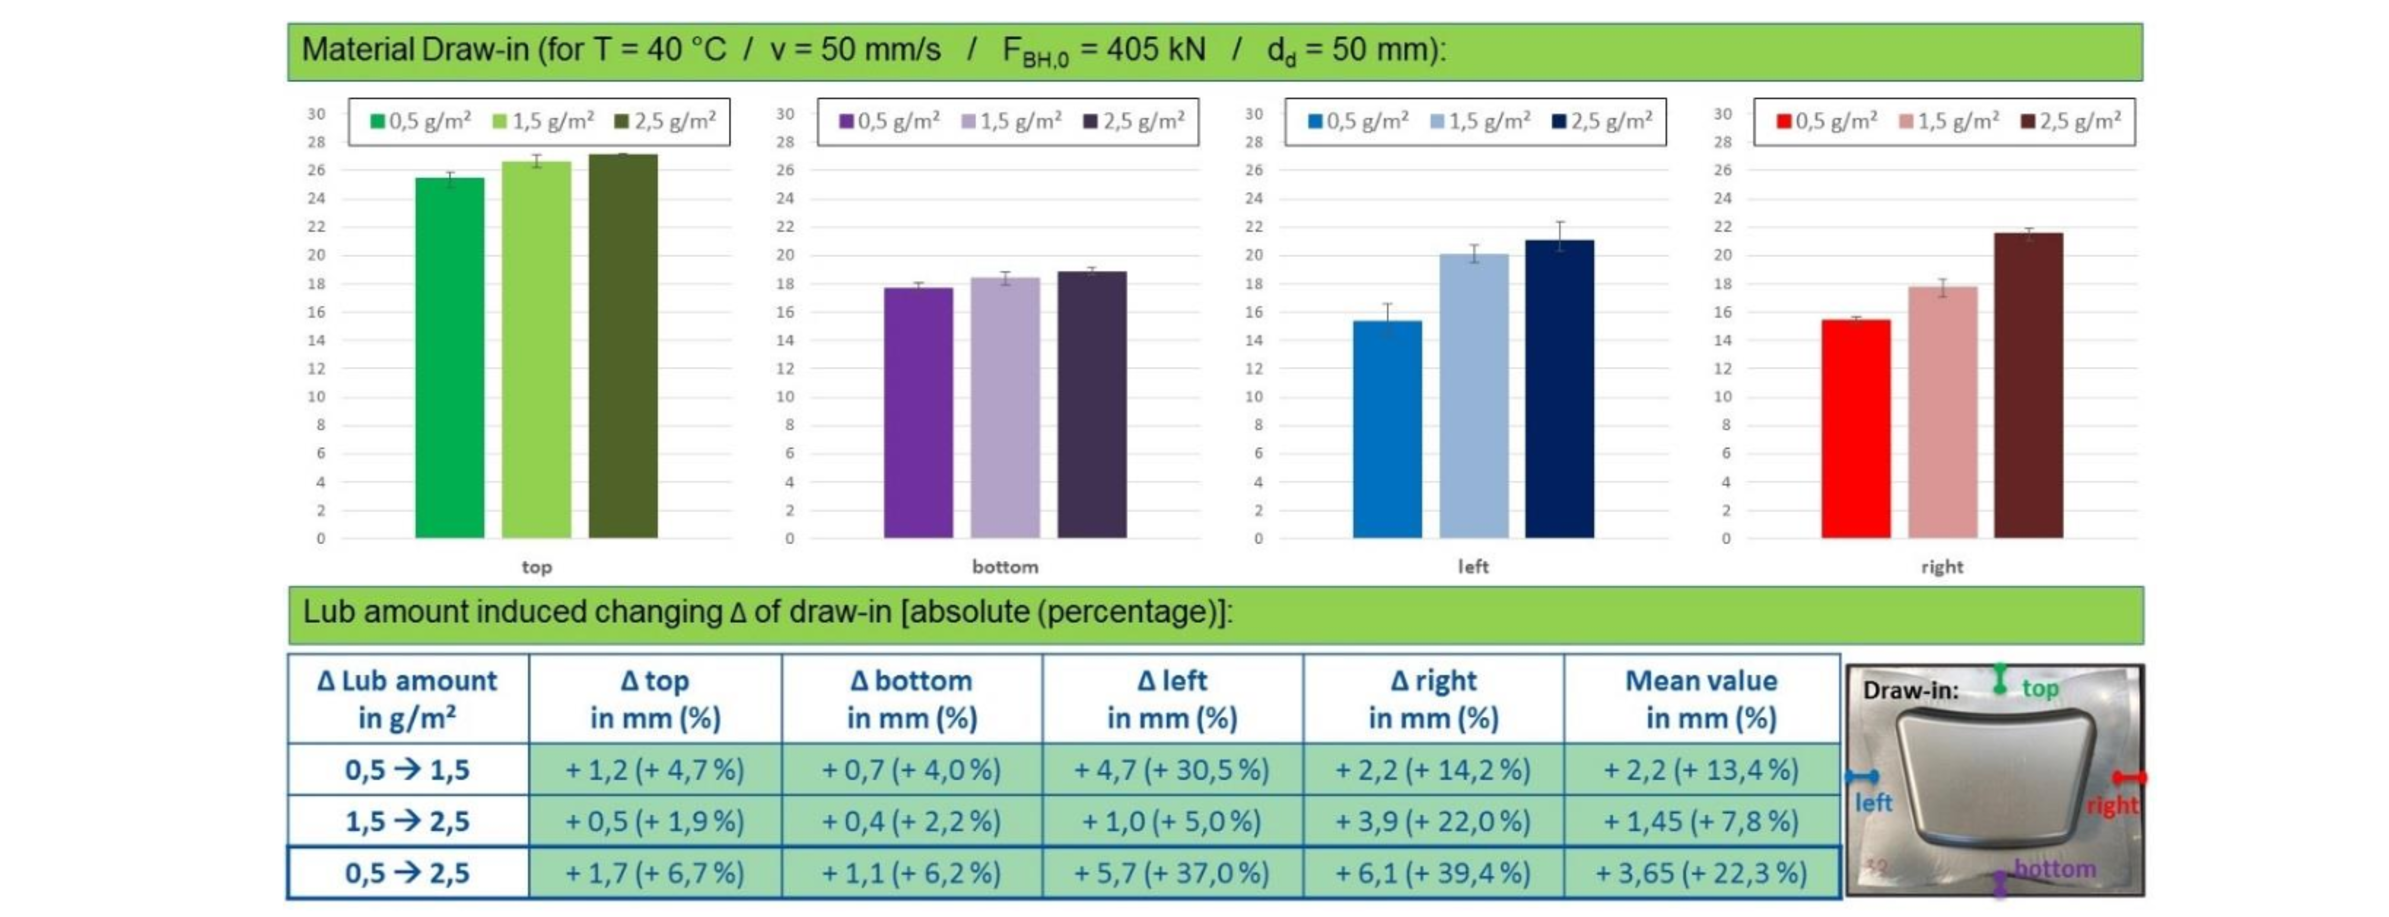
Fig. 17. Material draw-in and lubrication amount induced changing.
The results demonstrate a distinct increase of the draw-in versus lubrication amount. The average gain of the material draw-in over all edges reaches 22,3 %. The maximum punch force couldn’t be analysed so well because the combination of low lubrication amount and high temperature already caused material cracking. Hence, the punch force couldn’t be analysed for this parameter combination. Nevertheless, the following table demonstrates well the influence of lubrication amount on the resulting maximum punch force.
Table 6. Maximum punch force and lubrication amount induced changing.

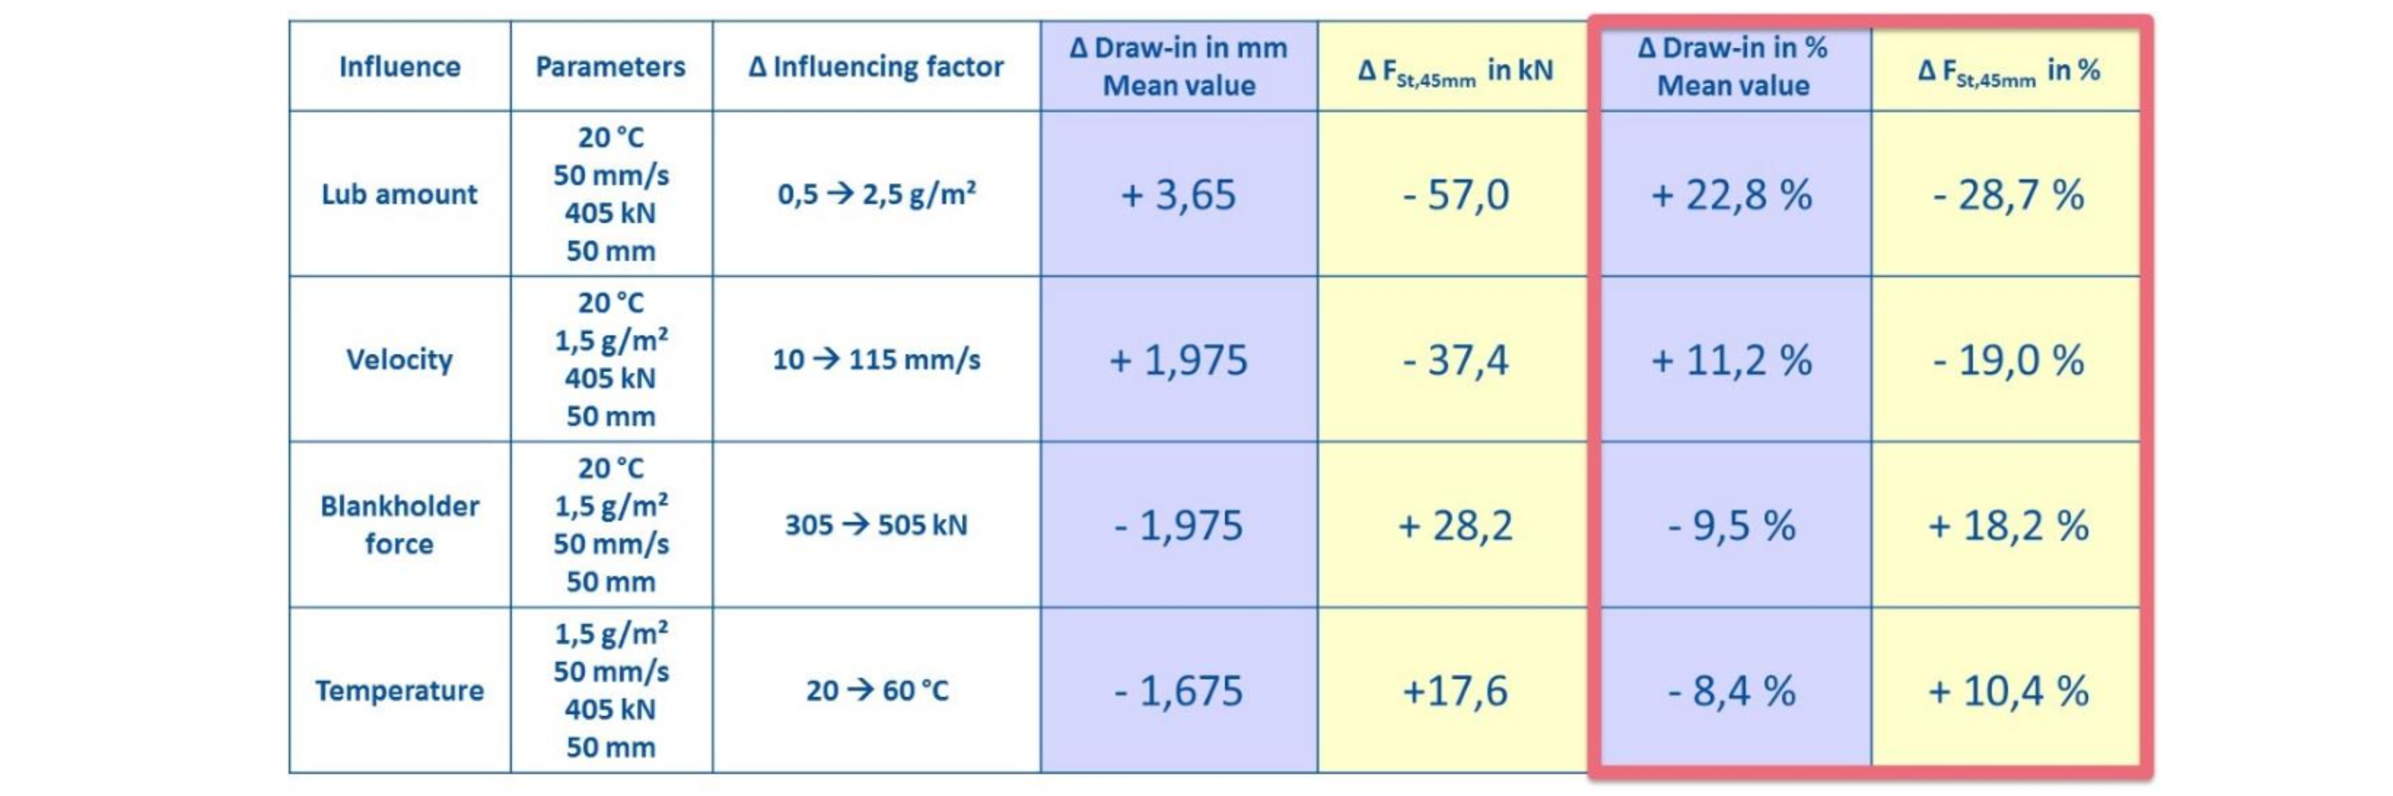
The two other influencing parameters sliding velocity and blank holder force were varied in the same matter. But more important is a quantitative comparison of the different influences on the forming results. Such a comparison was tried in the concluding Table 7.
Table 7. Summarising comparison of parameters influencing material draw-in and punch force.
5 Conclusions and Outlook
The influence of tool temperature on forming result was demonstrated both in laboratory friction test and in forming test with a heated lab-scale demonstrator. A rising temperature from 20 to 80 °C increases the friction forces up to 77 %. When considering the temperature induced friction increase, the different interdependencies with other parameters are important. The higher the lubrication effects are - smooth tool surface, high lubrication amount, high velocity, low surface pressure - the higher is the temperature influence.
In forming operations, the temperature influence from 20 to 60 °C was analysed with an increased punch force of 10,5 % and a reduced material draw-in of -8 %. But the higher the drawing depth is (with lower blank holder forces), the higher is the temperature influence. It should be considered that other parameters like lubrication amount or velocity have a higher impact on the forming result. An increased lubrication amount for example reduces the maximum punch force by – 29 %, and the corresponding maximum material draw-in rises by 22 %.
Other project parts considered the friction results in finite element simulations of the forming demonstrator part. These FE results correlate well with the experimental results, but have to presented in a later paper.
Acknowledgements
This research was carried out within the project “ASPECT – Advanced Simulation and control of tribology in metal forming Processes for the North West European Consumer goods and Transport sectors”, co funded by the INTERREG North West Europe programme (www.nweurope.eu/aspect.)
