1 Introduction
The sheet metal forming (SMF) and diemaking industry requires accurate and efficient production process in order to face the demanded short delivery times. Accordingly, the accuracy of the simulations becomes a key factor, where friction has been pointed out as one of the most influencing parameter [1]. Advanced research in recent years focused on material [2] and tribological characterization have dismissed the trend of implementing a constant Coulomb coefficient of friction model, independent on the process variables [3]. Recent works show the benefits of the modelling of frictional behavior in terms of process parameters such as contact pressure [4] sliding velocity [5], material strain [6], lubrication [7] or temperature [8]. Even though different testing methods have been proposed for friction characterization (see Figure 1), when friction maps depending on contact variables such as the contact pressure is aimed, strip drawing test is the most widely applied test [9]. The reason for this is that even if the other tests shown in Figure 1 are able to reproduce specific areas of the tooling, the contact pressure between the sheet and the tool is not homogeneous and it is not possible to define values of the coefficient of friction depending on the contact variables [10]. These other tests are usually applied when a qualitative comparison between different tribosystems wants to be achieved. Next question when doing a friction characterization is the contact variable ranges that should be covered. Therefore, the question that the work tries to answer is which range of the different contact variables that affect the coefficient of friction should be covered when generating new friction maps. That contact variables that, as a result determine real contact area are, for instance, strain rate of the sheet metal, material type or lubrication type and amount. However, and being contact pressure and sliding velocity two of the most important contact variables, the present work centers on these two variables for which the coefficient of friction (CoF) shows an exponential decay [11].
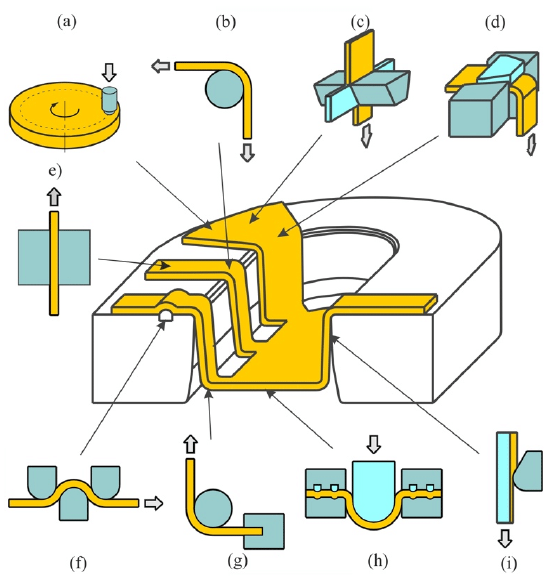
Fig. 1. Tribological tests representing the friction conditions in the specific area of the draw piece: (a) pin-on disc, (b) bending under tension, (c) drawing with tangential compression, (d) bending with tangential compression, (e) strip-drawing test, (f) draw-bead test, (g) strip tension test, (h) hemispherical stretching, (i) strip-reduction testing [12]
As the starting point of the work, information of the contact variable ranges covered by different authors have been gathered in Figure 2. These values correspond to different test stands, but specially strip drawing, at which a homogeneous and controlled contact pressure can be achieved.
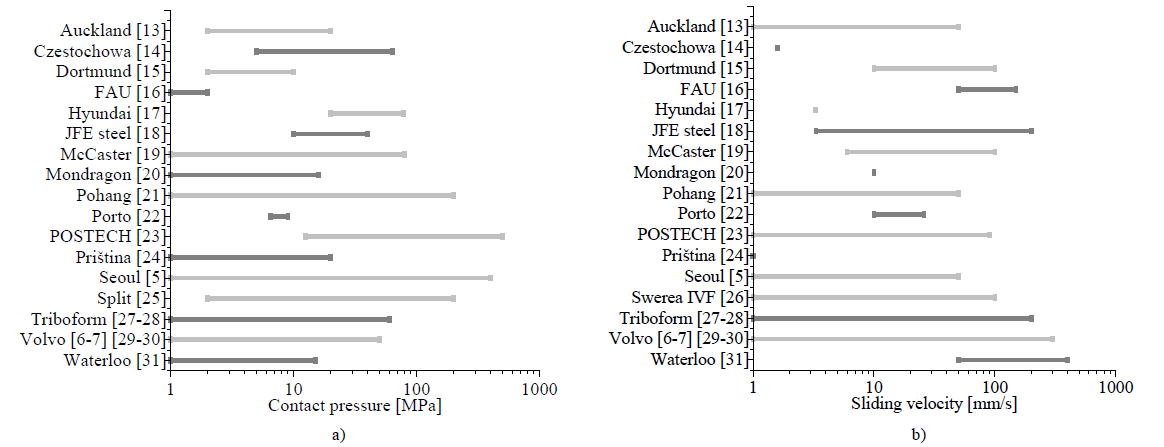
Fig. 2. Friction testing parameter ranges covered by different authors [5]–[7], [13-31] in logarithmic scale a) Contact pressure b) Sliding velocity
Therefore, and observing the wide range used for the two contact variables by previous authors, the present work aims to identify the ranges of contact pressure and sliding velocities occurring in different deep-drawn components. To that end, nineteen different industrial components representing a high variety of shapes have been numerically simulated to statistically analyse the contact pressure and sliding velocity ranges.
2 Methodology
2.1 Components and SMF simulations description
Autoform R8 finite element method software was used for the study. As the main objective of this work is to have a general contact pressure and velocity ranges distribution overview independent on the part shape, the initial forming (deep drawing operation) of nineteen industrial components case studies have been analysed. For that purpose, the selected parts were numerically analysed, from which the pressure and velocity values have been exported at different stages of the die-closure over different zones of the tools (Die, Blank Holder and Punch). These parts mostly correspond to automotive components, even though some aeronautical components have also been included. All the principal process parameters and material specifications used for the numerical simulations are shown in Table 1. It has also to be mentioned that the forming velocity corresponds to a sinusoidal motion of different mechanical presses. For this initial approach, a constant coulomb coefficient of friction has been introduced.
Table 1. Simulation parameters of the nineteen different industrial components

2.2 Division of die areas and forming time
In order to evaluate the impact of the tool geometry, the tool set has been divided in different representative areas (Fig. 2). All those areas can be grouped in flat areas (i.e. blank holder, inner ring, flat area (male) and flat area (female)), and curved areas (i.e. groove radius (inlet), groove radius (outlet), die inlet radius, inner radius). In order to analyse the evolution of the parameters during the drawing process, eleven evenly spaced stages have been studied between the initial contact (drawing process start) up to the complete die-closure (drawing process end). As example, in component Nº 1; results were analysed at different die-closure distances: 160 mm, 144 mm, 128 mm, 112 mm, 96 mm, 80 mm, 64 mm, 48 mm, 32 mm, 16 mm and the complete closure of the dies (0 mm). Additionally, 20 random points were taken in every zone at each stage in order to have a good statistical representation. That makes a total of 1980 data points per component: 20 random points over 9 zones at 11 stages.
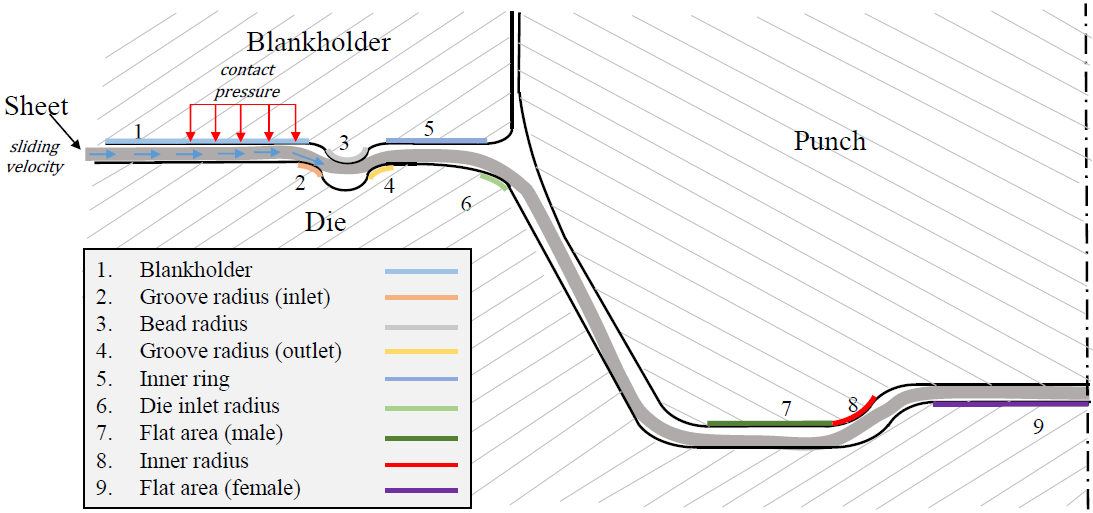 Fig. 2. Discretization of the tool geometry into different areas for contact pressure and sliding velocity evaluation
In order to get a normalized comparative values representing the evolution of the pressure and sliding velocity of each component, the die-closure process (analysed at 11 stages as previously explained) has been normalized and averaged in thirds; representing the initial, intermediate and final drawing process (1/3; 2/3 and 3/3). Therefore, “N1 component, Blankholder, 1/3 mean value” corresponds to the averaged of the 20 random points obtained over the blankholder area of the N1 component on the stages: 160 mm, 144mm, 128 mm and 112 mm (around 80 data points). Finally, in order to get the statistical averaged of the contact conditions on a specific area, the mean value of the 19 components have been taken.
3 Results and discussion
Figure 3 shows the global main values of the sliding velocity and contact pressure for each studied area, taking into account the 19 components and divided in thirds of the die-closure. Averaged values of the results are depicted in column representation, along with all data points in order to visualize the variability of the value. Nevertheless, as the comparison is between different parts and the deviations are high, even within each component, Figure 3 is divided in bars and series of data points. The bars correspond to the average values of all the components. The series of data points are represented to indicate the range of values for every variable. This data corresponds to the maximum, average and the minimum values of each component. In other words, the bars show the general tendency for each variable and the points show the range of variables. For example, if the pressure over the blank holding area on the last third of the die-closure is analysed, a mean value of 3 MPa is observed. However, some particular maximum random values of 17-23 MPa are also observed for 2 out of the 19 components. According to contact pressure, it tends to rise during the forming process reaching the maximum value in the final stage; at the same time that the needed press force arises, to form the material into the final shape. The pressure rises in the blankholder area and inner ring at the end of the process, because thickening of the material occurs and as a result more pressure is generated. In the inner flat areas (male and female) contact does not happen until the die is perfectly closed. In a similar way, in the inner radius and die inlet radius, even though the sheet is retained during the whole process, there is no a significant contact until the tool really closes. Finally, regarding the groove radius inlet/outlet and the bead radius, it is shown that as the blankholder is closed from the initial drawing step, a considerable contact pressure occurs from the beginning of the process and slightly increases due to thickening as well. When it comes to velocity tendencies, it may increase or decrease depending on the tool area and not its geometry itself. Nevertheless, if we analyse the drawing direction flow through the groove outlet radius, the inner ring, the die inlet radius, the inner areas and the inner flat areas the differences might occur due to the thickening of the material and its subsequent restriction. In general, areas where there is no thickening show an increase in sliding velocity, which means that material flow significantly increases at the final stage of the drawing, even the velocity of the press is lower.
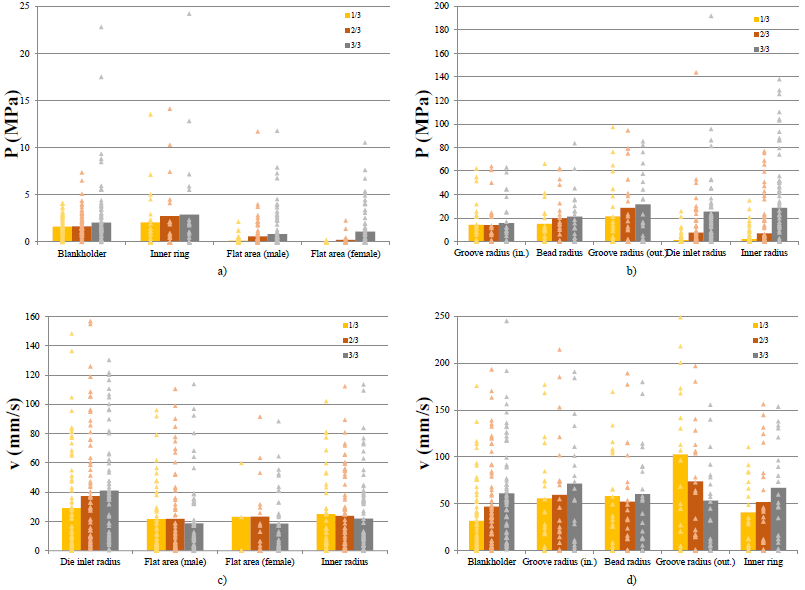
Fig. 3. Contact pressure and sliding velocity tendencies and ranges for initial, intermediate and final part of the forming process. a) Contact pressure in flat areas b) Normalized contact pressure in curved areas c) Sliding velocity in inner areas d) Sliding velocity in outer areas
4 Conclusions
The results show the importance of pressure and velocity ranges determination for different tool areas. Contact pressure within a numerical model differs from the smallest considerable and homogeneously achievable contact, (≈1 MPa) to 100 MPa. Nevertheless, different contact pressure and velocity ranges should be covered by area, being the pressure lower at flat areas and velocity ranges similar (at flat-curved areas). To summarize, the pressure and velocity ranges should be determined for every tool area and performed at the friction test that represents best:
-
On the one hand, in the case of flat areas, the average contact pressure value is 3MPa. In some particular cases, this pressure might arise to higher values up to 15 MPa.
-
On the other hand, in the case of curved areas, the average contact pressure values arise up to 20 MPa but maximum values of 100 MPa can occur in the peaks of contact area.
-
Finally, and regarding velocity, inner areas have sliding velocities around 20-25 mm/s whilst in outer areas the average value is twice that value (50 mm/s). Maximum values oscillate around 100 and 200 mm/s respectively.
Acknowledgements
The authors would like to thank Spanish Government for the funding of the project ALUTOOL: Desarrollo de nuevas tecnologiás de vanguardia para la producción de superficies funcionales de alto valor añadido orientadas al sector del estampado de aluminio under the program RETOS with reference number RTC-2017-6245-4 and financed by Ministry of Science, Innovation and Universities. The economical support, collaboration and technical support in the study of the company BATZ S. Coop. is gratefully acknowledged too.
