1 Introduction
The increasing demand for light weight design has an impact on the development and manufacturing of sheet metal parts. In order to meet the requirements of lightweight construction, the sheet metal processing industry is demanding a growing number of high-strength (AHSS) and ultra-high-strength steels (UHSS). About 90 % of the car body parts have the potential to use this type of steel and 25 % of the total mass can be reduced [1]. Additionally, since the strength of the AHSS and UHSS is at least twice as high as that of the conventional deep drawing steel grades such as normal DC-steel, less raw material is also required for the manufacture of components. Despite the advantages of using AHSS and UHSS, the approach leads to a new challenge for the tribological process design. Due to the higher strength, it is necessary to apply a high blank holder pressure to avoid defects in the forming process, such as wrinkling in the deep drawing process [2]. The previous study of the authors proved that the life span and the wear resistance of the forming tools decrease dramatically with the increasing normal pressure on the forming tools [3]. As a result, it is necessary to discuss the approach for wear detection in sheet metal forming.
In the authors’ previous study, an inline method for wear detection through the measurement of thermoelectric current based on the Seebeck Effect was proposed [4] and applied in strip drawing test with different tool geometries [5]. With these approaches, the adhesion wear on cold work steel tools can be detected by thermoelectric current and the signal curve correlates well with the measured surface roughness of the tool described by the 3d surface roughness Sz [4]. Through the analysis of the signal, a boundary value of the thermoelectric current which separates the mild and severe wear can be observed [4]. In real forming processes, however, different types of tool materials and sheet metals are used and it is worth discussing the effectiveness of wear detection through thermoelectric current for different tribological systems. Since the Seebeck coefficient depends on the material composition and the temperature [6], the influence of the Seebeck coefficient on the effectiveness of inline wear detection is discussed in this paper. First, the physical description of the measuring principle is discussed in section two, which gives a short overview of the basics of the measurement. Secondly, a specially designed device for determining the Seebeck coefficient of metals is introduced and the measured Seebeck coefficients of typical materials in the strip drawing test are illustrated. Last but not least the obtained Seebeck coefficients and the threshold values are compared.
2 Physical description of the measurement principle
In the strip drawing test, the sheet metal is clamped with a force of FN through the cylindrical blank holder and the flat die and drawn by a gripper at a maximum speed of 100 mm/s (Figure 1a). For current measurement, two copper cables from the tool holders of the blank holder are connected with the interface of the measurement module NI 9219 from National Instrument. The measured value is the potential difference between the interfaces HI and LO of the module and the current is calculated by dividing the shunt resistance inside the measurement module. The schematic measurement principle is described in Figure 1b. As a result of sliding, two heat sources emerge between the blank holder, sheet metal and die, which is illustrated by T1 and T2. According to the Seebeck effect, the potential difference arises as a result of the temperature gradient between the contact area and the connector on the tool holders for the lead material such as forming tools. Therefore, two sources of thermal voltage emerge in opposite direction in the blank holder and die. Together with the contact on the sheet metal and the measurement module NI 9219, an electrical circuit is built.
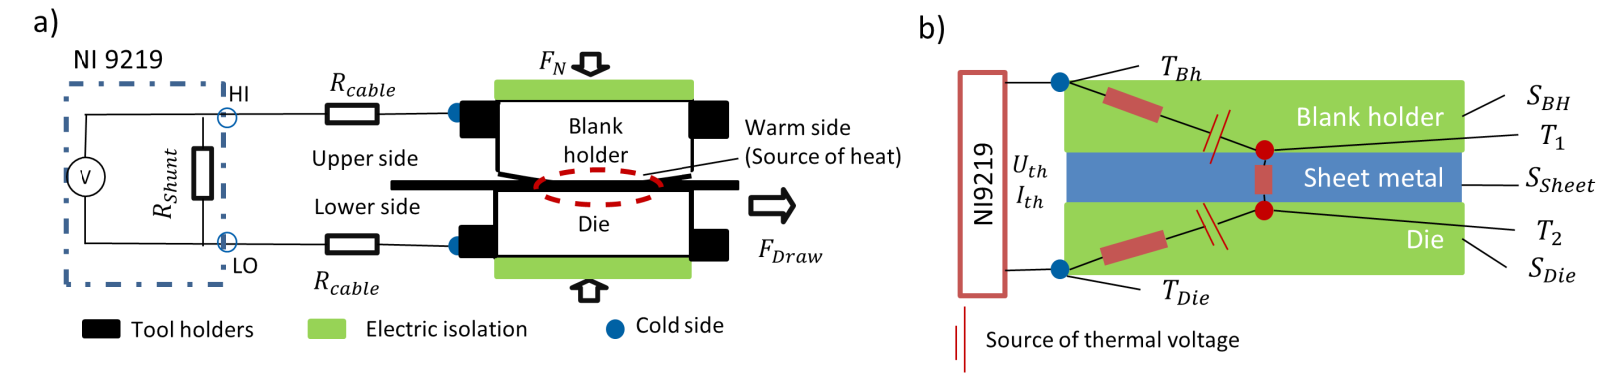
Figure 1 a) measurement of thermoelectric current in strip drawing test per module NI 9219 of National Instrument [4]; b) electrical schematic of the measurement principle
The principle of the emerged thermoelectric voltage is described by following equation,

where Uth stands for thermoelectric voltage, T temperature and S Seebeck coefficient. According to equation (1), the generated thermoelectric voltage is dependent on the Seebeck coefficient, the temperature difference between the contact (warm side) and the tool holder (cold side: TBH and TDie). For simplification, the equation (1) is transformed into equations as followed:

Equation (2) is based on the assumption that the cold side temperature 𝑇𝐵𝐻 and 𝑇𝐷𝑖𝑒 is identical to the room temperature 𝑇𝑅𝑇 and it is obvious that the generated thermoelectric voltage is dependent on the sum of the Seebeck coefficient of tools 𝑆𝐵𝐻 and sheet metal 𝑆𝑆ℎ𝑒𝑒𝑡 as well as the sum of 𝑆𝐷𝑖𝑒 and 𝑆𝑆ℎ𝑒𝑒𝑡. Therefore, the equation (2) can be simplified as equation (3), where 𝑆𝐵𝐻+𝑆 and 𝑆𝐷𝑖𝑒+𝑆 are the combined Seebeck coefficient of the tool and sheet metal. The residual r=(𝑆𝐷𝑖𝑒−𝑆𝐵𝐻)𝑇𝑅𝑇 is determined by the difference of both Seebeck coefficients of tools and the room temperature. To eliminate the residual, the contact temperature T1 and T2 can be described as the sum of the room temperature TRT and temperature rise ΔT1 as well as the sum of TRT and ΔT2. The equation (3) is transformed as followed:

Compared to equation (1), equation (4) is simplified significantly. The generated thermoelectric voltage is influenced by the temperature rise of the two contact loci ΔT1 and ΔT2 as well as the combined Seebeck coefficients. Since the sign of the two terms of equation (4) has a different direction, it can be assumed that the positive thermoelectric voltage is caused by the abrupt temperature increase due to severe wear occurrence on the blank holder, while the negative thermoelectric voltage derives from the wear-induced temperature rise on the die.
After connecting to the measurement module NI 9219, an electric circuit is formed and the thermoelectric current is generated, which is described by the following equation:

where Ith stands for the thermoelectric current and 𝑅𝑆ℎ𝑒𝑒𝑡, 𝑅𝐵𝐻, 𝑅𝐷𝑖𝑒 and 𝑅𝑆ℎ𝑢𝑛𝑡 stand for the electrical resistance of sheet, blank holder, die and the shunt resistance inside the measurement module NI 9219. The measured sum of resistance of the whole system is 34.1Ω. Based on the physical description of the measurement principle, the methods for the determination of the Seebeck coefficient are discussed in Section 3.
3 Measurement the Seebeck coefficient
3.1 Measurement device of the Seebeck coefficient for sheet metal
In the first step, a device for the Seebeck coefficient measurement of the sheet metal is developed. According to the Seebeck effect, thermoelectric voltage emerges when a temperature difference occurs within a certain material. Similar to the approach of Demmel et al. [6], a device for the measurement of the Seebeck coefficient is designed for this approach.
In Figure 2a, a schematic diagram illustrates the measurement principle of the Seebeck coefficient. The two ends of the sample are placed on a warm block and a cold block. The warm block ② is heated by a ceramic heater with an output of 130 W, while the cold side ① is connected to a water tank ④. Water with a reference temperature (0℃ or room temperature) is supplied by the water pump ③ through the cold side of the device (see Figure 2c). The whole mentioned system plays a role as a cooling system ①. The temperatures of the cold and warm sides are measured by the resistance thermometer Pt100 with a measurement frequency of 12 Hz, while the voltage between the cold and warm sides is measured by the measurement module NI 9219 from National Instrument, which makes it possible to measure a voltage in μV range. If necessary, the air in the measuring chamber can be extracted by a vacuum pump ⑤. The whole function of water supply, evacuating, temperature data acquisition and temperature control is realized by a control and measuring system based on Arduino.
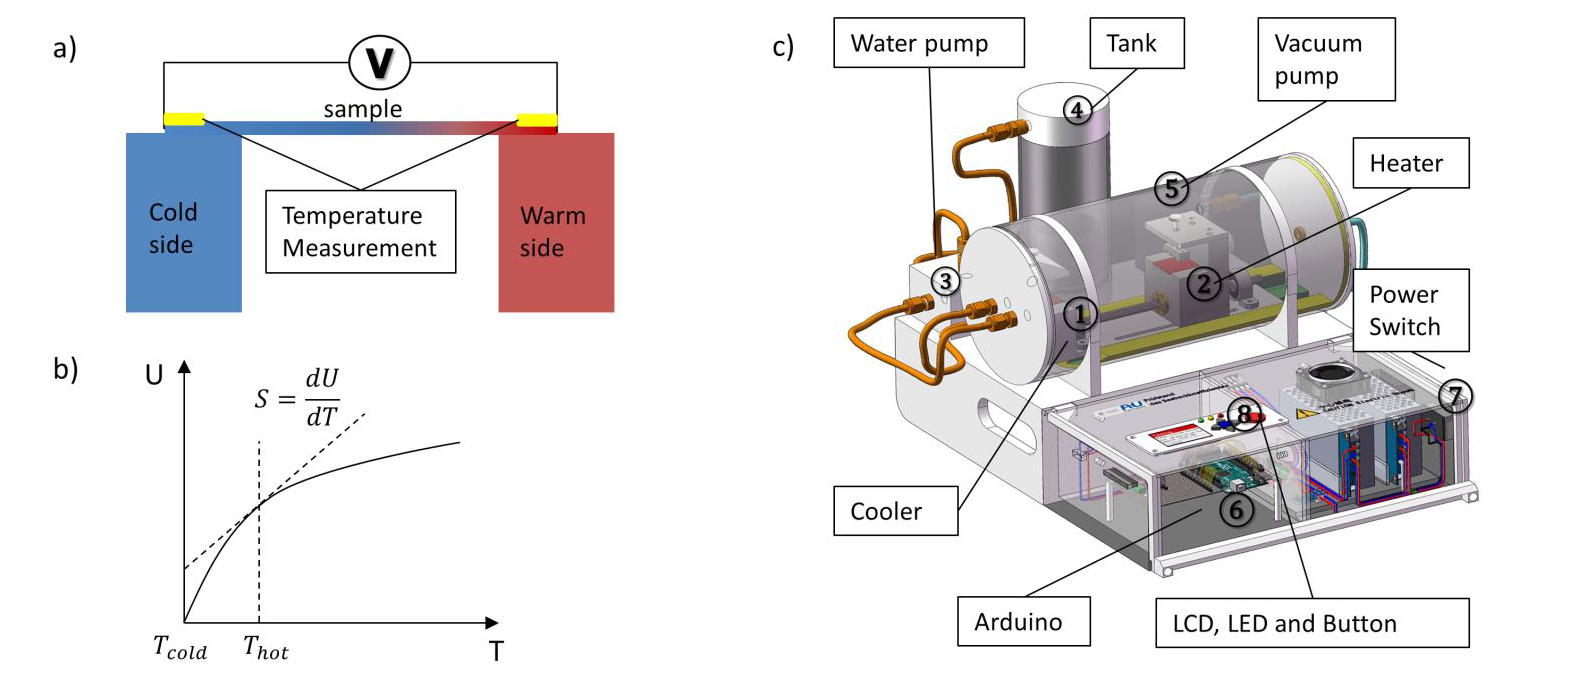
Figure 2 a) Measurement principle of the Seebeck coefficient for metal sample according to Demmel et al. [9]; b) Measured data and the method to determine the Seebeck coefficient; c) Illustration of device for determination of Seebeck coefficient
In Figure 2b, the method for the measurement data evaluation is illustrated. The Seebeck coefficient at the temperature of 𝑇𝑤𝑎𝑟𝑚 corresponds to the gradient of the thermoelectric voltage U relative to temperature T and can be described as following equation (3):

where 𝑆 is the determined Seebeck coefficient, T the measured temperature and U the measured thermoelectric voltage.
Under the background of the wear issue because of increasing demand of light weight design, the sheet metal aluminum EN AW-1050A, aluminum alloy EN AW 5083, stainless steel X5CrNi18-10 and high-strength low-alloy steel H630LA (Manufacturer: C.D. Waelzholz) are selected in this approach for evaluation.
After the mounting of the measured sample, the warm block starts to heat continuously to the required temperature (120°C for aluminum and 250°C for steels) and the thermoelectric voltage between the two ends and the temperature of the warm and cold sides are recorded. Figure 3a shows the data of the Seebeck coefficient measurement, where the temperatures differ between the warm and cold side in the x-axis and the measured thermoelectric voltage in y-axis. The diagram clearly shows a linear development between the temperature differences and the measured thermoelectric voltage. The blue line of the diagram is the result of the linear regression by applying the “curve-fitting” Toolbox of MATLAB and the gradient of the linear regression corresponds to the Seebeck coefficient according to the equation (6). This approach of linear regression for the Seebeck coefficient calculation is similar to the approach of Tozaki et al. [7]. Figure 3b shows the calculated Seebeck coefficients of the test materials after three repetitions. It can be stated that the low-alloyed steel sheet H630LA has the highest Seebeck coefficient, which is about twice that of stainless steel X5CrNi18-10 and aluminum alloy AW 5083. The aluminum alloy AW 5083 and the stainless steel X5CrNi18-10 have a similar Seebeck coefficient similar to the result of Tröber et al. [8], where the difference in Seebeck coefficient between the aluminum alloy and the stainless steel is close to zero.
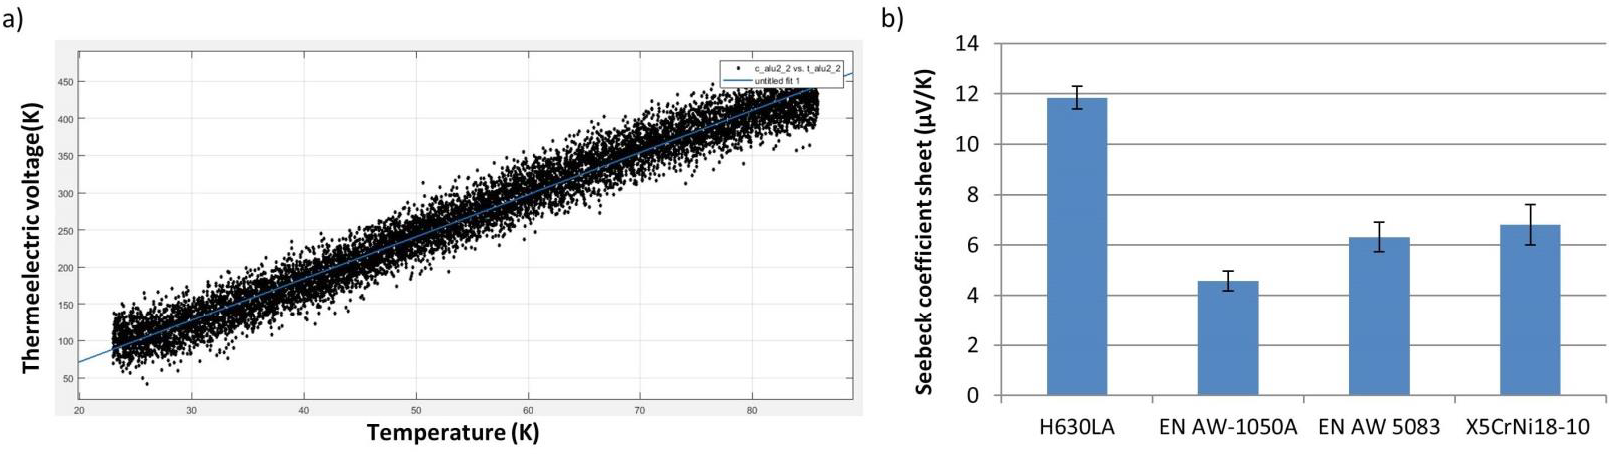
Figure 3 a) Data of the Seebeck coefficient measurement; x-axis: temperature difference between warm and cold side; y-axis: measured thermoelectric voltage(Material: aluminum alloy EN AW 5083); b) Measured Seebeck coefficient of different test materials
3.2 Measurement of the Seebeck Coefficient of tools
Besides the sheet metal, the Seebeck coefficients of the tools are measured according to equation (4). Due to the different structure of the wire connection at the tool holders, the Seebeck coefficient of blank holder and die made of hardened cold working steel X153CrMoV12 is determined separately. According to Figure 4a, the blank holder is mounted in the tool holder, which is made of the unhardened cold-working steel X153CrMoV12. On the side of the tool holder, is a brass bracket mounted for the cable connection. In the tool holder of Figure 4b, the bracket connects the die directly.
For thermoelectric measurement, the cable is connected between the contact position of the tool (heating point: red) and the bracket (reference point: blue). At the same position, two K-type thermocouples are connected at the heating and the reference points for temperature monitoring. With this measurement setup, the Seebeck coefficients of both sides of the tools can be calculated according to equation (6) and illustrated in Figure 4c after three repetitions. It can be stated that the Seebeck coefficients of the blank holder and die are in the same level around 20μV/K, which also corresponds to the approach of Tröber [8]. The reason for this slight difference can be deduced from the different connection methods of the bracket. Comparing the Seebeck coefficient of sheet metals (Figure 3b), the Seebeck coefficient of the tool material dominates.
3.3 Determination of the combined Seebeck coefficient
According to equation (4), the measured thermoelectric current is determined by the combined Seebeck coefficient SBH+S and SDie+S, which are determined by the sum of Seebeck coefficients of tools and sheet metal.
Figure 5 shows the combined Seebeck coefficients of the tools and tested sheet metals. Similar to the results shown in Figure 3b, H630LA shows the highest combined Seebeck coefficient, about a factor 1.2 higher than AW 5083 and X5CrNi18-10 after the sum of the Seebeck coefficients of SBH and SDie. After the determination of the combined Seebeck coefficient and the mathematic description, in the following section the behavior of thermoelectric current in wear detection is analyzed as a case study.
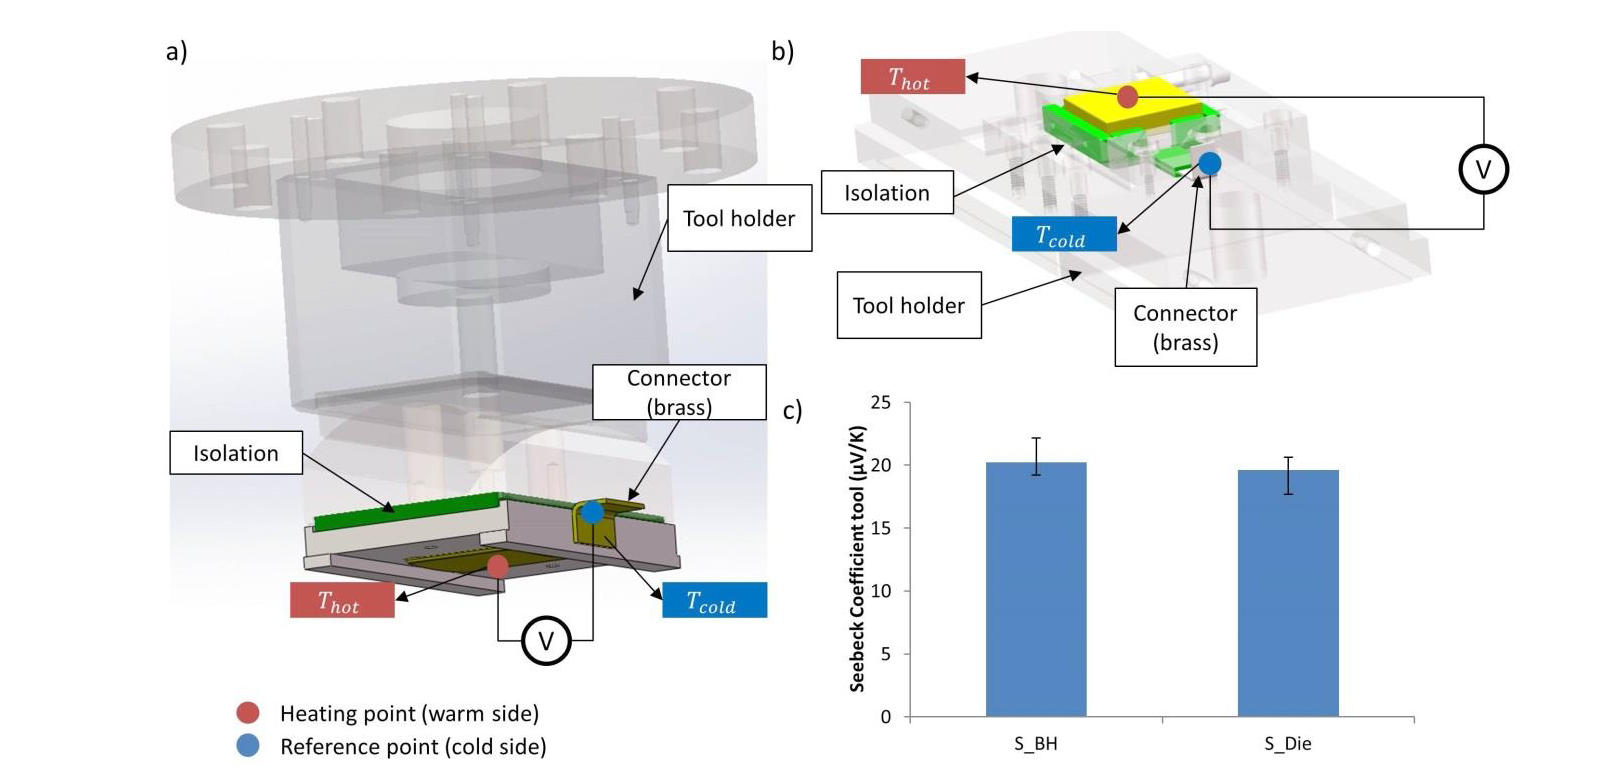
Figure 4 Measurement procedure of the Seebeck coefficient of the a) Blank holder; b) Die; c) the measured Seebeck coefficient of the blank holder SBH and die SDie
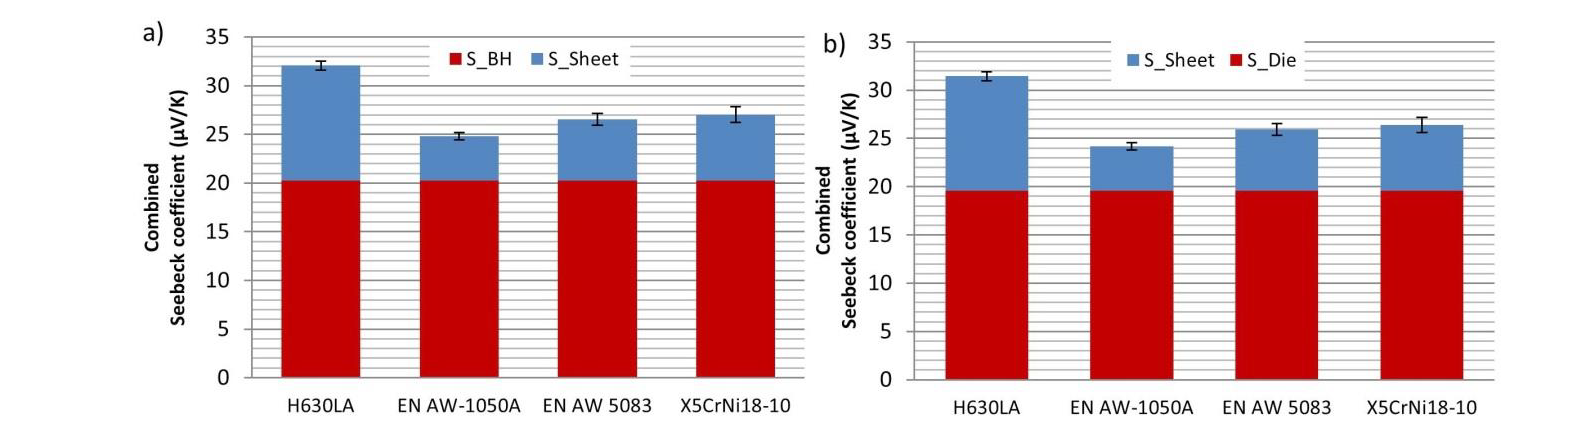
Figure 5 The combined Seebeck coefficients of tools and sheet meta a) blank holder; b) die
4 Case study: wear test of low-alloy steel
In this section, an example of a wear test deployed at room temperature with low alloy steel in a strip drawing test is analyzed. The cold-working steel X153CrMoV12 and the low alloy steel H630LA are used in this test. The sheet metals are lubricated with the lubricant PL61 (Supplier: Zeller+Gmelin) with an amount of 2 g/m2. The normal force of the blank holder is set to 20kN. The sheet metal is clamped with a gripper, the sliding speed is 100 mm/s and the length of each stroke is 100 mm. After the wear occurred on both sides of tools, the wear test was interrupted.
Figure 6 shows the measured thermoelectric current and both sides of the sheet metal roughness. By observing the thermoelectric current and the roughness, three phases of wear development can be identified. In the first phase, no change of roughness is observed on the lower side of the sheet, while the roughness of the upper sides increases only moderately until the 14th stroke. In comparison, the development of the thermoelectric current remains just above 0 μA in the low range and shows a linear increase up to the 14th stroke with a value of 7.36μA. Assuming that the sheet metal roughness of the lower side remains constant, resulting in an unchanged temperature on the die (ΔT2=0), since the combined Seebeck coefficient SBH+S, the measured current Ith and the resistance are known, it is possible to calculate the temperature increase ΔT1 by equation (4) and (5). In this case, ΔT1 is calculated as 7.98°C. In the second phase, the thermoelectric current increases abruptly from the 15th to the 44th stroke with a value of 62.83 μA. At the same moment, the sheet metal roughness on the upper side of the sheet metal increases abruptly up to the 44th stroke, indicating severe wear on the blank holder, while the roughness of the lower side of the sheet metal remains unchanged. Similarly, ΔT1 can be calculated as 68.12°C at the 44th stroke. From the 45th stroke, the current starts to decrease and the wear development steps into the 3rd phase. The decline of the measured thermoelectric current can be derived from the increase of the sheet metal roughness on the lower side, which indicates a tool failure on the die. This tool failure causes an increase of ΔT2, which compensates the measured thermoelectric current according to equation (4).
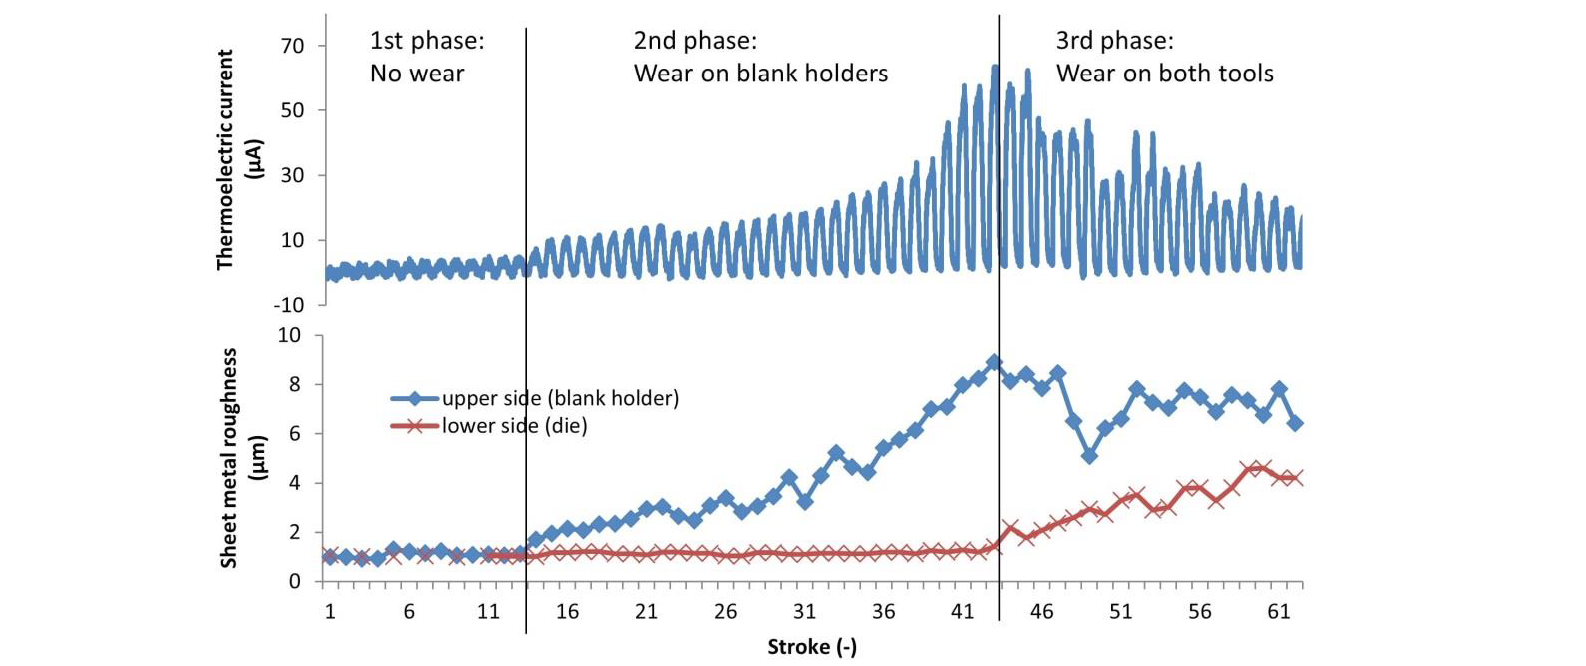
Figure 6 Case study for explanation of measurement principle(tool: X153CrMoV12; sheet metal: H630LA)
5 Influence of the Seebeck coefficient on wear detection through thermoelectric measurement
After understanding the behavior of thermoelectric current with the development of wear, several wear tests with different materials are used to analyze the influence of different Seebeck coefficients on wear detection at room temperature. The wear test is used until severe wear occurs on one of the test tools (2nd phase). The boundary value of the thermoelectric current and the peak value of the thermoelectric current of the last stroke are documented. For the analysis of the last stroke, the surface roughness of the failure tool is measured after the test. Similar to Section 3.1, four different types of materials are used. An example of the wear test with H630LA and its evaluated values is illustrated in Figure 7.
According to equation (3) and (4), the sign of the measured thermoelectric current is dependent on the loci of the wear. If the severe wear occurs in the blank holder, the sign is positive and vice versa. In order to obtain the value of the thermoelectric current on both the positive and negative sides in a targeted manner, the lubrication conditions are different for each wear test. A total of six tests are used for each material and the aim is to generate the severe wear three times on the blank holder (Test 1-3) and three times on the die (Test 4-6). In Table 1, the lubricating condition of each wear test is summarized.
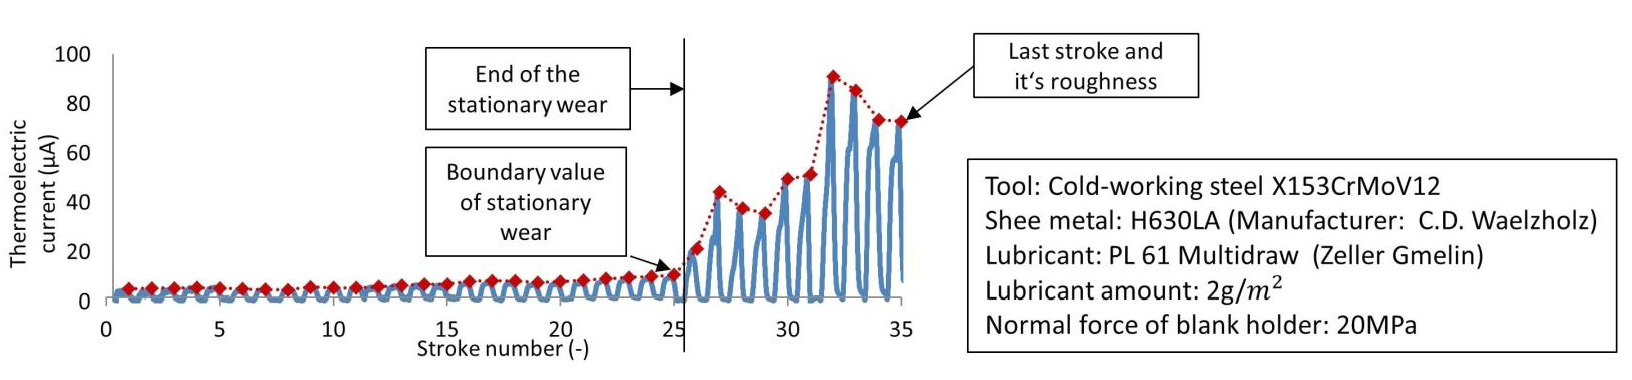
Figure 7 An example of thermoelectric current evaluation
Table 1 Summary of the lubricating condition on wear test
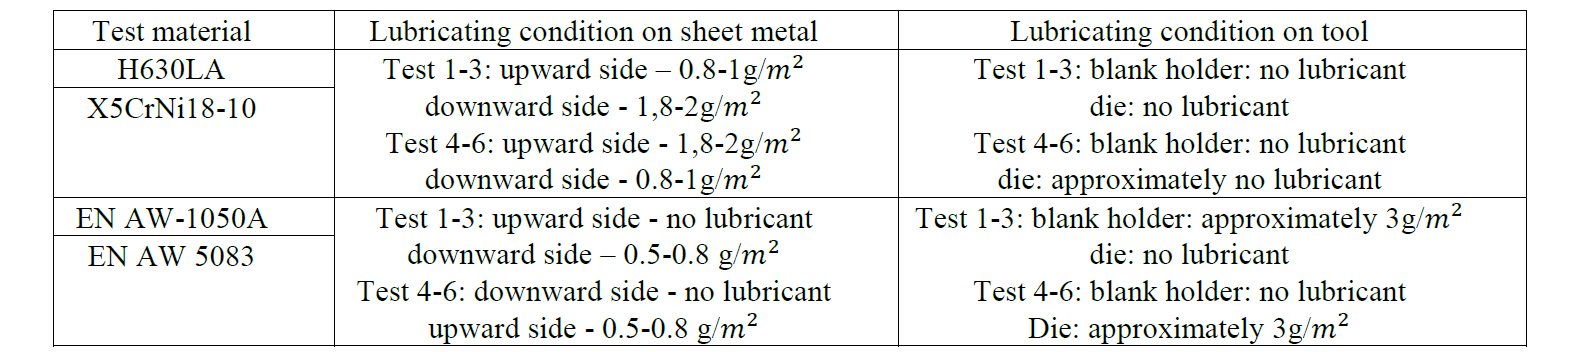
Figure 8a shows the boundary value of Phase 1 of each wear test for three materials. Since the wear development of EN AW-1050A shows an abrupt increase after the occurrence of severe wear and no steady-state phase can be detected, no obvious boundary value can be found. Compared to the measured Seebeck coefficient shown in Figure 5, the boundary value of the current is approximately proportional to the development of the combined Seebeck coefficient. According to the estimated temperature rise at the end of the steady-state based on equation (4) and (5) shown in Figure 8b, the temperature increase of the H630LA is higher than that of aluminum alloy and stainless steel. For low alloy steel H630LA, it can be concluded that the risk of severe wear increases if the contact temperature rises by 10 °C. For stainless steel and aluminum alloy, this boundary temperature is lower.
Besides the current value of the transition, Figure 9 shows the peak value of thermoelectric current of the last stroke and the roughness of wear mark Rt and Rz, based on standard DIN EN ISO 4287 [9]. It is found that the measured thermoelectric current correlates with the roughness parameter Rt, which indicates the highest peak value of wear marks. On the contrary, the roughness parameter Rz is not that sensitive to the change of the current. This effect can be explained by the higher micro-plastic deformation on the sheet metal, when the micro-asperities with high Rt on the tool surface cut the sheet metal. The higher deformation causes a higher temperature increase and leads to a higher measured thermoelectric current. This observation indicates that the maximal peak height of the wear marks plays a more important role on thermoelectric current generation.
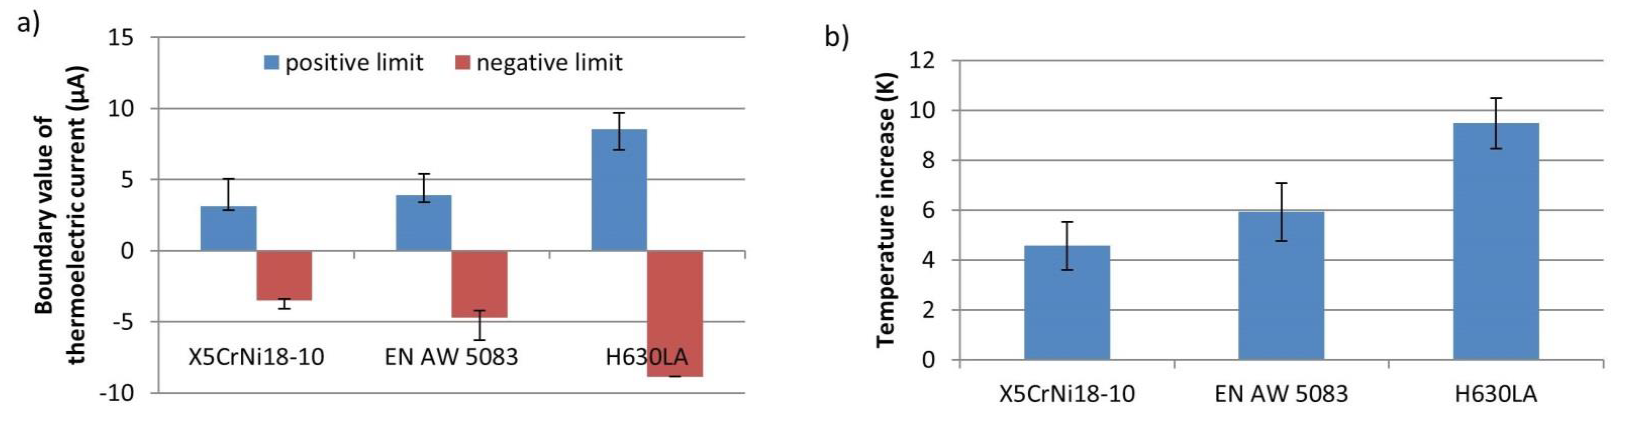
Figure 8 a) Boundary value of thermoelectric current of three test materials; b) estimated contact temperature increase at the end of steady-state
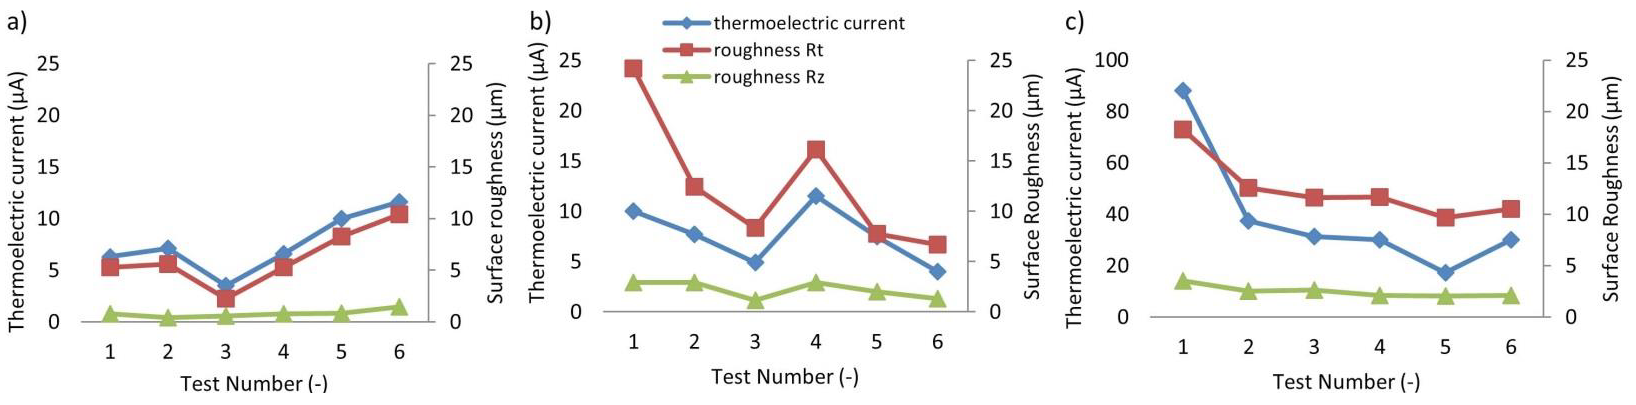
Figure 9 Comparison of the measured thermoelectric current and roughness a) EN AW-1050A; b) EN AW 5083; c) H630LA
6 Conclusion
In this study, a mathematical description of the measuring principle is derived. The measured thermoelectric current is influenced by the contact temperature, which is determined by the extent of tool wear, and the Seebeck coefficient of both the tools and the sheet metal. Based on this mathematical description, several wear tests are applied and the influence of the Seebeck coefficient on the threshold value of mild wear, which is also the limit of mild wear, is determined. In wear monitoring, the determination of this limit value is very useful for effective wear monitoring in sheet metal forming. In the future, more data about the behavior of the thermoelectric current at elevated temperature are to be discussed for a wider range of application of this wear detection method. These will be used to identify correlations between material compositions and the limit value of the thermoelectric current.
Moreover, by analyzing the degree of wear of tools with advanced wear, the correlation between the surface parameter Rt and the thermoelectric current can be found. It shows that the generated thermoelectric current is determined by the peak value of the surface asperities. It indicates that the thermoelectric measurement is very sensitive to local surface failure on the tools and is advantageous for use in sheet metal forming under conditions with extreme contact stress.
Acknowledgements
The investigations presented in this paper were carried out within the research project “Effektiver Modellversuch zur Abschätzung der Werkzeugstandzeit” sponsored by Arbeitsgemeinschaft industrieller Forschungsvereinigungen “Otto von Guericke” e.V. (AiF) and “Europäische Forschungsgesellschaft für Blechverarbeitung e.V. (EFB)”.
