1. Introduction
Automotive stamping is a multi-stage deformation process. In the first stage, a metal sheet is drawn into a definite shape and in the subsequent stages; the drawn component is redrawn, flanged or pierced. During the various stamping stages, a material can undergo two different types of strain path change. These are continuous and discontinuous strain path change. A material undergoes a continuous strain path change at the first draw stage of the stamping where a draw tool with typically complex geometry draws and stretches the material. On the other hand, a discontinuous strain path is induced in the material when the drawn shell from the first stage of stamping is unloaded from the draw tool and subsequently redrawn or flanged or pierced along a different strain path. Study of strain path change has been a hot topic in metal forming for a long time. Graf and Hosford [1, 2] studied the discontinuous strain path change phenomenon and examined the effect of uniaxial, biaxial and plain strain pre-strain on the forming limit of AA 2008 T4 and AA 6111 T4 aluminium alloy. They found that the biaxial pre-strain lowered the forming limits whereas uniaxial pre-strain raised the forming limit when the pre-strain direction was transverse direction (normal to rolling direction of the sheet). The pre-straining near plain strain increased the forming limits slightly when the direction of pre-strain was transverse direction. Dhara et al. [3] further investigated the effect of discontinuous strain path change on forming limits of AA5754-O aluminium alloy by pre-straining the samples in uniaxial tension in a Zwick tensile machine and thereafter re-loaded the samples in the biaxial strain path by using a 50 mm diameter punch in a Nakajima test. They reported that the pre-straining along transverse direction increased the forming limit strains while the pre-straining along rolling direction decreased the forming limits. Similarly, Collins et al. [4] uniaxially pre-strained low carbon ferritic steel samples by stretching along one direction and then re-loaded the samples along biaxial strain path by using a purpose-built biaxial stretching equipment. They found that a uniaxial pre-strain followed by biaxial stretching resulted a significant gain in the limiting strains. During these discontinuous strain path change experiments, a common characteristic emerges as that the two stages of deformation were carried out on different experimental setups and the samples may have experienced dissimilar strain rates during both the stages.
It is thought that the changing strain path effects the formability as it changes the texture and work hardening behaviour of the material [5, 6]. To investigate the effect of material deformation on microstructure, Ghadbeigi et al. [7] and Celotto et al. [8] applied a recently developed technique where mechanical deformation of a material was performed inside an scanning electron microscope (SEM) chamber using a miniaturised test rig and the SEM images were captured from the sample surface while the elongation process was going on in-situ. They elongated the samples along the uniaxial strain path and post-processed the periodically captured SEM images using the digital image correlation (DIC) technique to examine the strain field induced on the sample surface at the meso-scale. At this scale, they analysed the effect of elongation on the strain distribution in the ferritic and martensitic phases of the dual-phase 1000 (DP1000) steel and transformation induced plasticity 800 (TRIP800) steel samples respectively. In addition, they observed the micro-void nucleation and fracture mechanism of these materials. Caër and Pesci [9] contributed to the design of sample for the in-situ deformation technique by designing a cruciform sample that ensured the strain localisation at the centre of the sample while elongating the sample along both the directions using a micromechanical rig. They studied the grain rotation and misorientation development in an annealed AISI 304 stainless steel in-situ during the biaxial loading inside an SEM chamber. In addition, they measured the texture evolution by tracking the captured electron back scattered diffraction (EBSD) data in-situ from the centre of the biaxial specimen periodically during the entire elongation process. They concluded that the loading path had a potential to orient the grains along a particular direction. Kubo et al. [10] proposed an innovative design of cruciform specimen by introducing a notch at each of the corners of the central part of the specimen for in-situ deformation technique. They performed the biaxial tensile test of the specimen made of interstitial free (IF) steel in an SEM chamber and examined the inverse pole figure (IPF) maps, grain average misorientation (GAM) maps and Taylor factor (TF) maps to characterise microstructural changes during the biaxial elongation. In brief, the in-situ deformation technique is a vital tool to understand the effect of plastic deformation induced by strain path change on the evolution of strain, microstructure and texture revealing the changes in formability of the material. However, the work so far has focussed on the effect of discontinuous strain path changes, which is typically observed when material is reloaded between stamping stages. As a result, there is a research gap in the understanding of material behaviour under continuous strain path condition that occurs in the draw process. Addressing this gap will enable formability to be quantified more accurately, thereby increasing the confidence for designers in utilising high strength materials that have low formability.
In this work, the gap was addressed by developing an experimental method to investigate the effect of the continuous strain path transition that occurs in the drawing stage. The method was then used to investigate the effect of continuous loading on the evolution of material strain, microstructure and texture. A novel cruciform sample was designed based on the design of Caër and Pesci [9]. The sample was elongated in a Micromecha biaxial testing rig to enable the continuous strain path change to occur at a set point during the experiment. The strain evolution of the samples were observed at the macroscopic and microscopic scales termed as macro-strain and micro-strain using DIC while the texture evolution was observed with EBSD. The macro-strain evolution at the centre of the specimen confirmed the occurrence of continuous strain path transition. The micro-strain evolution showed rotation of strain bands while the texture evolution conveyed grain rotation during continuous strain path change.
2. Development of continuous strain path change mechanism
The development of the continuous strain path change mechanism was carried out in two stages. In the first stage, finite element (FE) modelling of the strain path change specimen with the testing rig was performed. This optimised the sample geometry and overall design of the rig and the specimen assembly. In the second stage, the actual physical testing of the strain path change mechanism was performed and the macro-strain evolution at the centre of the specimen was evaluated to confirm the occurrence of continuous strain path change.
2.1 FE modelling of continuous strain path change mechanism
The experimental set-up consisting of the Michromecha rig and the cruciform specimen is presented in Fig. 1. The inline grips and transverse grips of the rig were connected through a 45° wedge (Fig. 1). A motor drove one end of the inline grip 1 while the inline grip 2 was securely fastened to the body of the rig. When the motor moved the inline grip 1 along X-axis, its motion was translated into a vertical motion of the transverse grips along Y-axis via the 45° wedge connection (linkage mechanism), thus loading the sample vertically along Y-axis at the same time. The inline grip 1 was moved along X-axis and the transverse grips were moved along Y-axis during the experiments. The maximum load capacity of the rig is 5 kN and the load was recorded while elongating the specimen. To change the strain path during testing, the cruciform specimen geometry proposed by Caër and Pesci [9] was modified to include slotted holes in the vertical arms (Fig. 2). The external dimension of the strain path change sample was 30.4 mm by 30 mm and its thickness was 1 mm (Fig. 2a). The central region was reduced in thickness (0.3 mm) to concentrate the strain in that region and to prevent overloading the load cell of the rig. The thickness reduction was done at the bottom surface by using CNC milling process with a slow feed rate to achieve a uniformly thinned surface. DX54 steel was chosen for the specimen material, as it is a deep drawing quality steel made from a single phase alloy with higher amount of elongation commonly used in automotive applications. The material properties and chemical compositions are detailed in Table 1 and Table 2 respectively. At the start of the continuous strain path change experiment, the slots allowed the bolts of the transverse grips to translate without loading the sample. After a specified elongation that was determined by the length of the slots (0.2 mm), the transverse grips engaged and the specimen was deformed biaxially. However, due to the design of the rig, the deformation was not equibiaxial. Hence, the material was deformed uniaxially at the start of the test before the strain path changed to biaxial strain path resulting a continuous strain path transition.
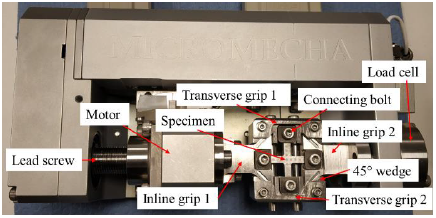
Fig. 1: Experimental set-up consisting of the Micromecha rig and the cruciform specimen
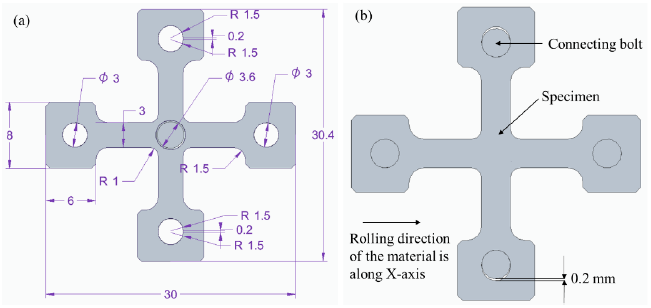
Fig. 2 (a) Design of strain path change specimen and (b) assembly design of connecting bolts and the strain path change specimen showing 0.2 mm travel of connecting bolts in the vertical arms during strain path change
Table 1: Material properties of DX54 steel used in this work
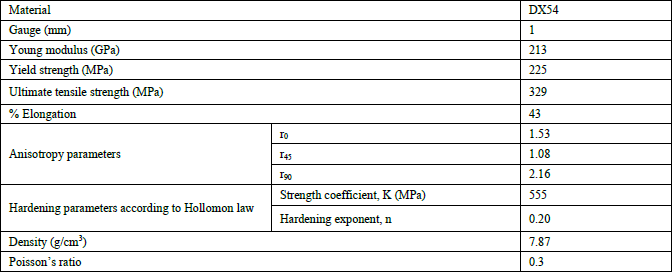
Table 2: Chemical composition (wt %) of DX54 steel used in this work

The rig and specimen were modelled using the finite element (FE) method. The validated model was used to optimise the design of the sample and experimental apparatus. The model consisted of the horizontal grips, vertical grips and the specimen (Fig. 3). The grips and the gripping areas of the sample were modelled as rigid bodies while the specimen was modelled as a deformable body. All bodies were meshed with solid elements of an appropriate size that optimised speed and accuracy. For simplicity, yielding was modelled with the von Mises model and power-law hardening was assumed. More advanced material model such as crystal plasticity based model with anisotropic behaviour and hardening law were beyond the scope of current research and will be studied in future. To model the clamping of the sample to the grips, the nodes in the connecting bolts were joined to the nodes of the grips as constrained rigid bodies while the connecting bolts were making surface contact with the gripping areas of the specimen. Displacement (2.5 mm) was applied to in-line grip 1 along X-axis (Fig. 3) to represent the motor in the physical rig. Inline grip 2 was fixed. The motion of transverse grips 1 and 2 was restricted to the Y-axis, to reflect the physical rig. The model was solved using LS-Dyna explicit v.10.1.0.
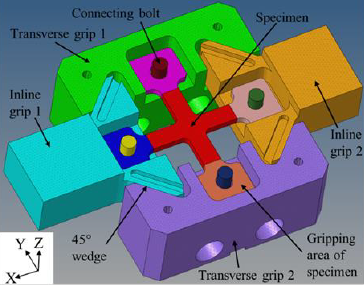 Fig. 3: FE model of the assembly consisting of the grips, connecting bolts and the specimen
2.2 Experimental trials of continuous strain path change mechanism
The FE model of continuous strain path change mechanism was validated against physical trials. During trial experiments with the rig and the sample, the strain evolution in the gauge area of the specimen was calculated to confirm the occurrence of continuous strain path change. During the experiments, it was ensured that the specimen was loosely held in the transverse grips to allow the connecting pins to travel freely in the 0.2 mm slot in the first stage of the travel (Fig. 2b). The strain evolution of the sample during the experiments was measured with the GOM 12M macro-DIC system. The DIC system consisted of two 12MP cameras fitted with lenses to capture the strains in the arms and the central region of the specimen. Measurement frame rate was 1 frame/second and samples were loaded at 0.3 mm/min.
3. Measuring technique of micro-strain and texture evolution during continuous strain path change
The specimens for strain path change were prepared from DX54 steel sheet and were polished (top surface of the specimen) by using silicon carbide (SiC) paper, diamond suspension solutions and finally 0.05 ╬╝m colloidal silica solution. Samples for micro-strain evaluation were etched with KallingŌĆÖs No. 2 regent for 10 seconds. To carry out the microstructural measurements, the polished sample was loaded in the rig and the rig was placed in the chamber of a ZEISS SIGMA field emission gun scanning electron microscope (FEG-SEM). The rig was controlled by using the POROS 2 software supplied with the Micromecha rig. The inline grip 1 was elongated at a rate of 5 ╬╝m/sec. The elongation was arrested after every 0.2 mm travel to perform SEM and EBSD scans (at the top surface of the specimen) for micro-strain and texture analysis respectively. For micro-strain observation, etched sample was used. The micro-strain analysis was performed using the micro (grain level) DIC analysis and texture analysis was carried out using EBSD analysis. For micro DIC analysis, the SEM scans were done by using secondary electrons (SE2) with 20 keV voltage. The captured SEM images were post-processed with LavisionŌĆÖs DIC software (Davis 10) to obtain the micro-strain distribution. The subset size was used as 25 ╬╝m and step size was used as 8 ╬╝m during the micro DIC analysis. For texture analysis, the test was repeated to obtain EBSD scans by using the SEMŌĆÖs EBSD detector. During EBSD scanning, the step size was kept at 0.5 ╬╝m. The EBSD results were analysed in HKL Channel 5 software.
4. Results and discussion
4.1 Strain evolution during continuous strain path change
4.1.1 Simulation vs experimental macro-strain evolution
The simulated X-axis and Y-axis macro-strain (╬Ąx and ╬Ąy respectively) contour of the specimen were computed before and after the strain path change and are presented in Fig. 4.
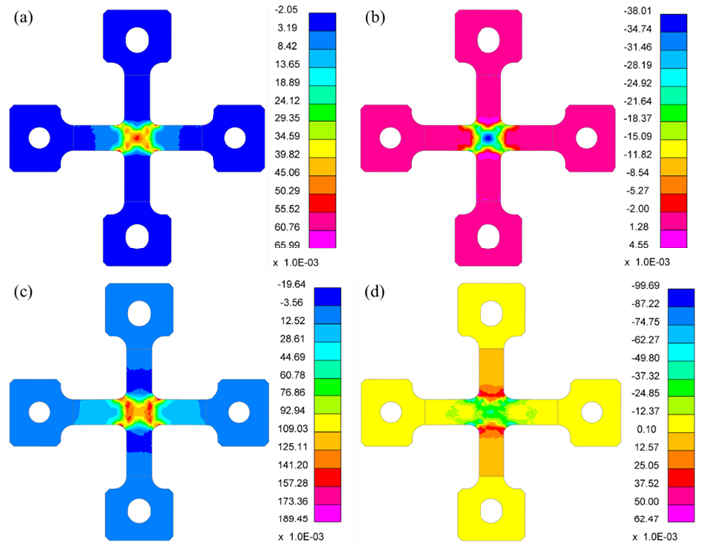 Fig. 4: Simulated macro-strain contour of DX54 specimen during continuous strain path change (a) ╬Ąx and (b) ╬Ąy contour before the strain path change and (c) ╬Ąx and (d) ╬Ąy contour after the strain path change
The experimental ╬Ąx and ╬Ąy macro-strain contour of the specimen before and after the strain path transition was evaluated and is presented in Fig. 5. The spatial resolution of the DIC measurement was 0.43mm.
The macro-strain contours showed the strain concentration and uniformity of the strain distribution at the central region. The behaviour and level of the simulated macro-strain contours were reasonably matching close the experimental macro-strain contours.
The strain path evolution at the centre of the specimen was evaluated from both simulation and experiment and it is presented in Fig. 6. It can be noted that the sample was deformed along uniaxial strain path initially and then it was deformed along a biaxial strain path towards the end of the test. The slope of the uniaxial strain path was found -0.85, which was in between uniaxial tension (slope = -0.5) and pure shear deformation (slope = -1.0). The slope obtained in biaxial strain path was 1.2 that was in little higher than the slope of equibiaxial strain path (slope = 1). There was a good similarity between the simulated and experimental strain path transition curve. The difference in the length of the uniaxial deformation between the experiment and simulated curve was likely to be due to the machining tolerance for the slot and thickness of the central region during manufacturing of the specimen for experimental trial. Hence, the developed strain path change mechanism performed continuous strain path transition.
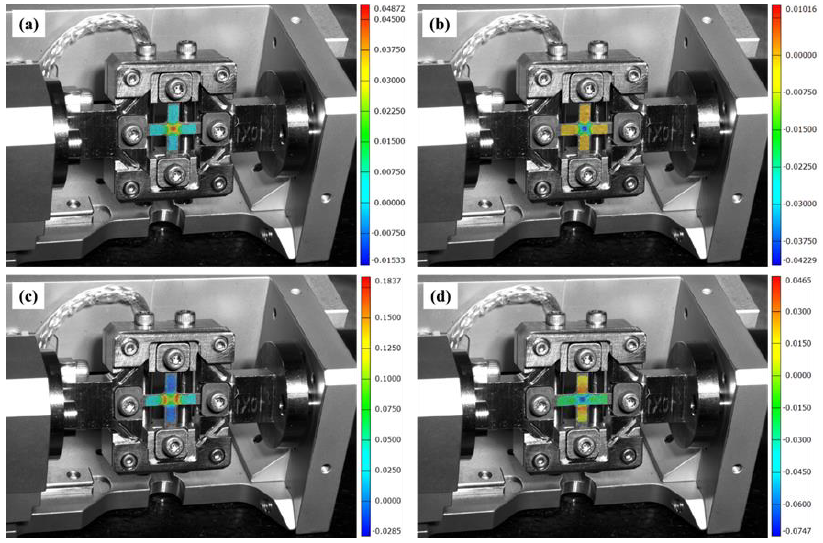 Fig. 5: Experimental macro-strain contour of DX54 specimen during continuous strain path change (a) ╬Ąx and (b) ╬Ąy contour before the strain path change and (c) ╬Ąx and (d) ╬Ąy contour after the strain path change
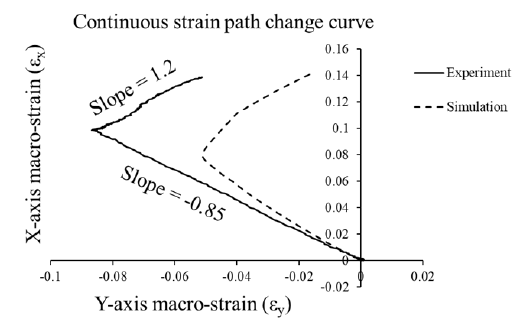 Fig. 6: Experiment vs. simulation continuous strain path change curve of DX54 sample
4.1.2 Micro-strain evolution
The X-axis and Y-axis micro-strain (ex and ey respectively) distributions calculated from micro-DIC analysis showed that the strain distributions were heterogeneous with a wide spread of strains (Fig. 7 and Fig. 8). This is because the grains of the DX54 steel samples were not uniformly deformed. This may be the intrinsic property of the material behaviours in the micro level. However, what we had seen in macro level was the summation of these by considering the suitable homogenization rule. During the initial stage of the experiment when the sample was loaded uniaxially, ex increased while ey decreased. The average strains in the data were reasonably matching with the macro-strain values at the centre of the specimen. At the starting of biaxial strain path, ey started to increase confirming that the strain path change (uniaxial to biaxial) started. The banding of ex and ey micro-strains (indicated by black line in Fig. 7 and Fig. 8) were found approximately 74┬░ and 78┬░ respectively at the end of uniaxial strain path.
When the strain path change occurred and the sample underwent subsequent elongation along biaxial strain path, the angle of these lines appeared to rotate. However, the rotation was minute. The rotation was slightly more prominent in ey strain distribution.
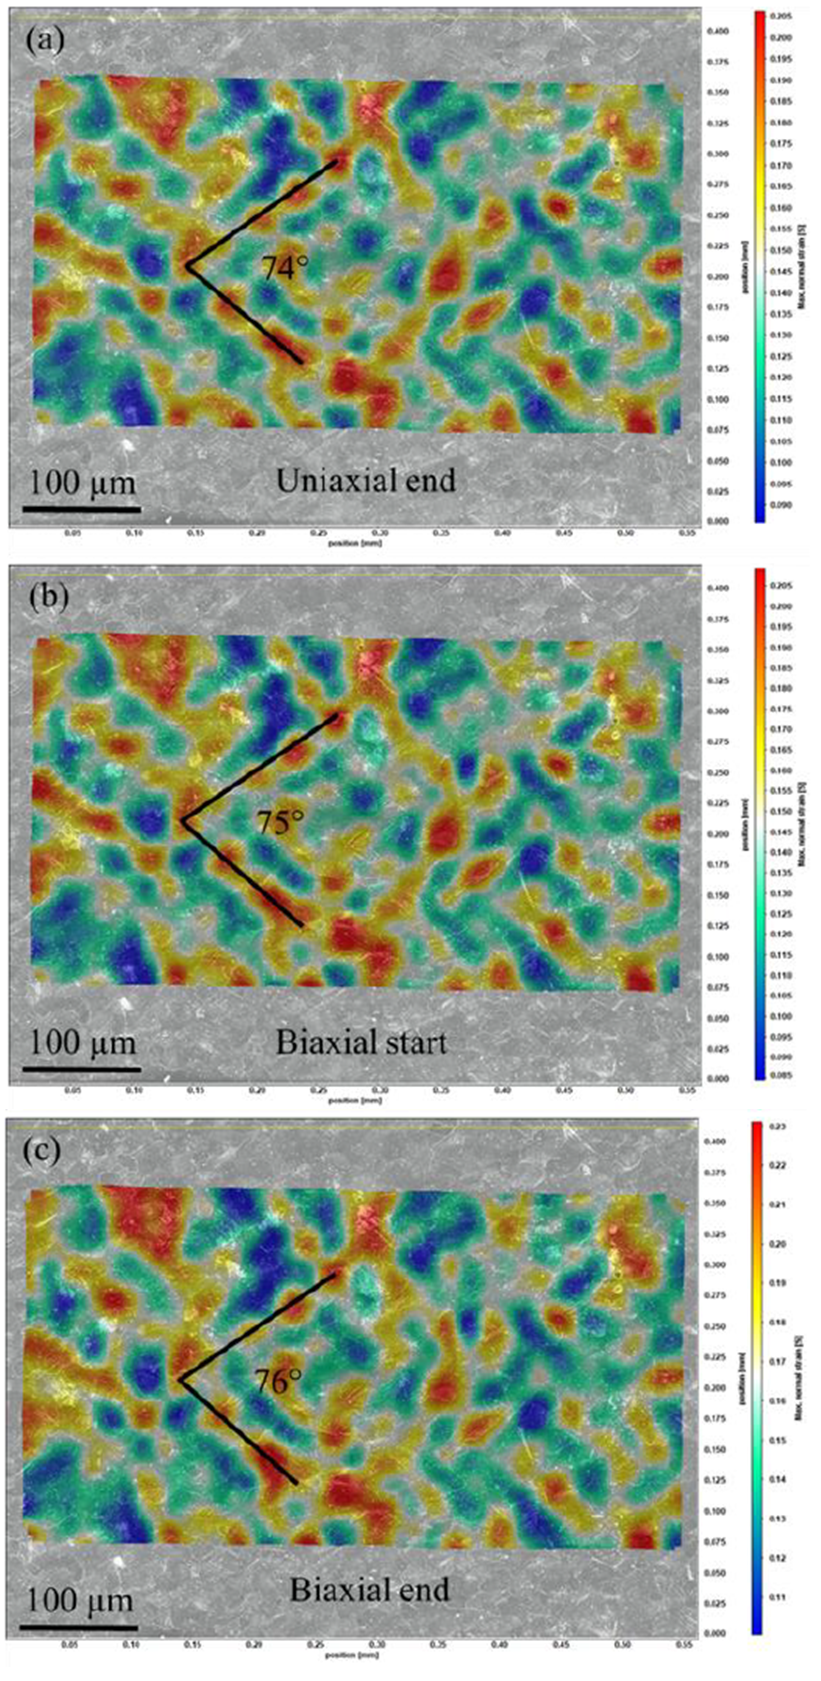
Fig. 7: X-axis micro strain (ex) distribution at the centre of the specimen calculated from micro DIC analysis after: (a) uniaxial end, (b) biaxial start and (c) biaxial end during the continuous strain path change
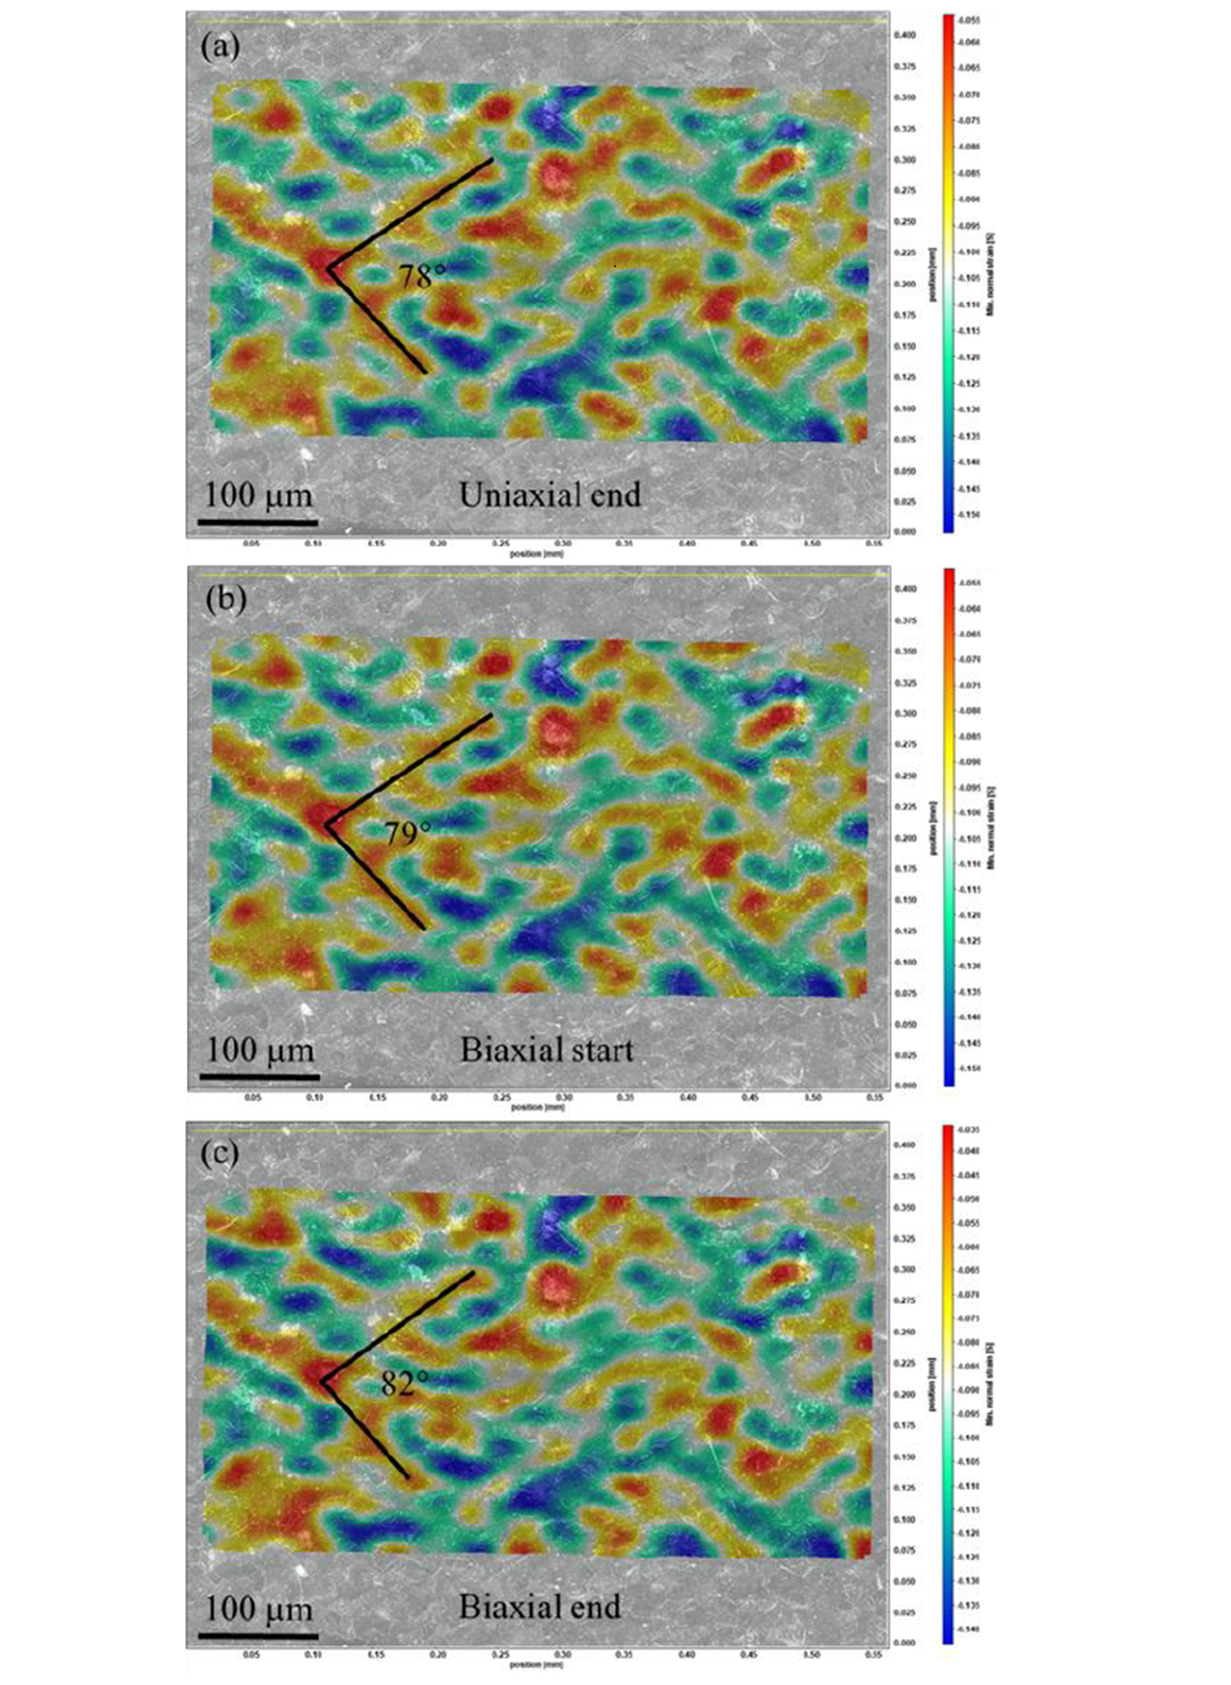
Fig. 8: Y-axis micro strain (ey) distribution at the centre of the specimen calculated from micro DIC analysis after (a) uniaxial end, (b) biaxial start and (c) biaxial end during the continuous strain path change
4.2 Texture evolution during continuous strain path change
Further analysis on microstructural changes was performed by carrying out texture analysis using EBSD mapping of around 400 grains in the gauge area at the centre of the top surface of the specimen. The EBSD X maps, SEM images and inverse pole figure (IPF) X maps are shown in Fig. 9. Evidence of deformation was clear within the grain structure, with grain elongation and rotation occurring with increased elongation of the sample. Grains with orientations of [111] (indicated by black circles) and [001] (indicated by black dotted circles) underwent rotation differently. The [111] grains underwent rotation from the crystallographic direction [111] towards [101] during the entire deformation process. On the other hand, the [001] grains underwent rotation from the crystallographic direction [001] towards [101] during the strain path change. The extensive deformation of the sample surface was shown by the increase in slip bands in SEM images captured during the deformation process. IPF X maps showed the gradual increase of multiples of uniform distribution (MUD) value of [101] grains and the sample showed [101] X texture with a maximum intensity factor of 2.48 at the end of the biaxial strain path. It was also observed that the MUD value of [111] grains was diminished from 1 to nearly 0.5 and the MUD value of [001] grains was diminished from 0.1 to 0.05 during the entire deformation process.
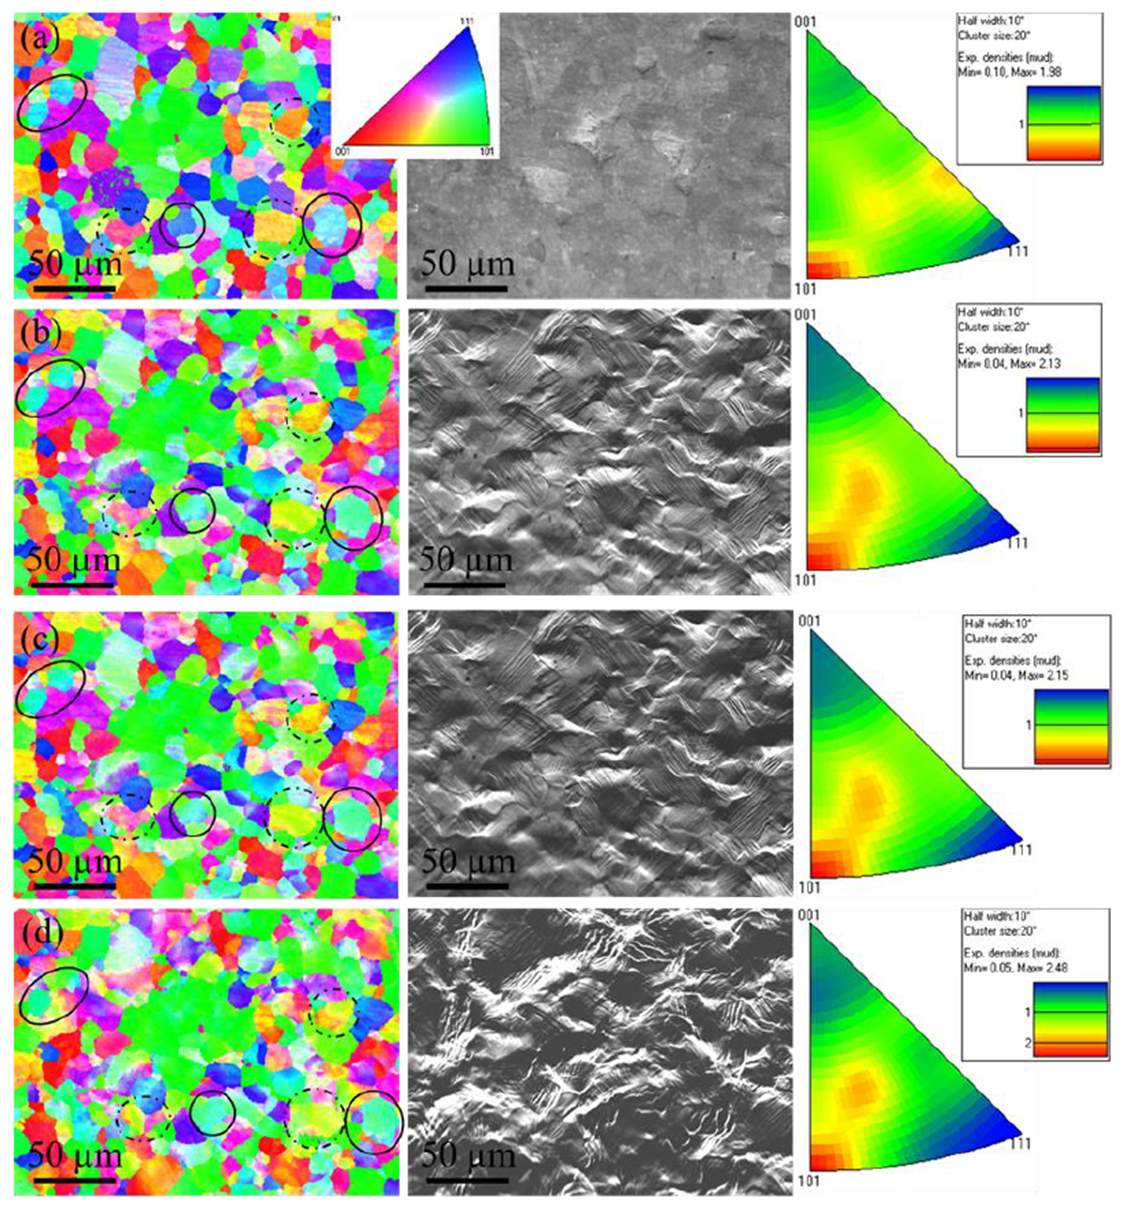
Fig. 9: On the left: EBSD X mappings, in the middle: SEM images and on the right: inverse pole figure (IPF) X of the centre of the specimen at: (a) uniaxial start, (b) uniaxial end, (c) biaxial start and (d) biaxial end during continuous strain path change
The grain rotation was further studied with the help of pole figures as shown in Fig. 10. There was a difference in colour contour in the pole figures in {100} and {111} plane. The MUD value increased (4 to 6) in uniaxial strain path and it decreased (6 to 5) in biaxial strain path in {100} plane. In contrary, the MUD value increased (5.62 to 7.53) and concentrated in a particular location in {111} plane after the strain path change. This indicates grain rotation was prominent in {100} and {111} planes.
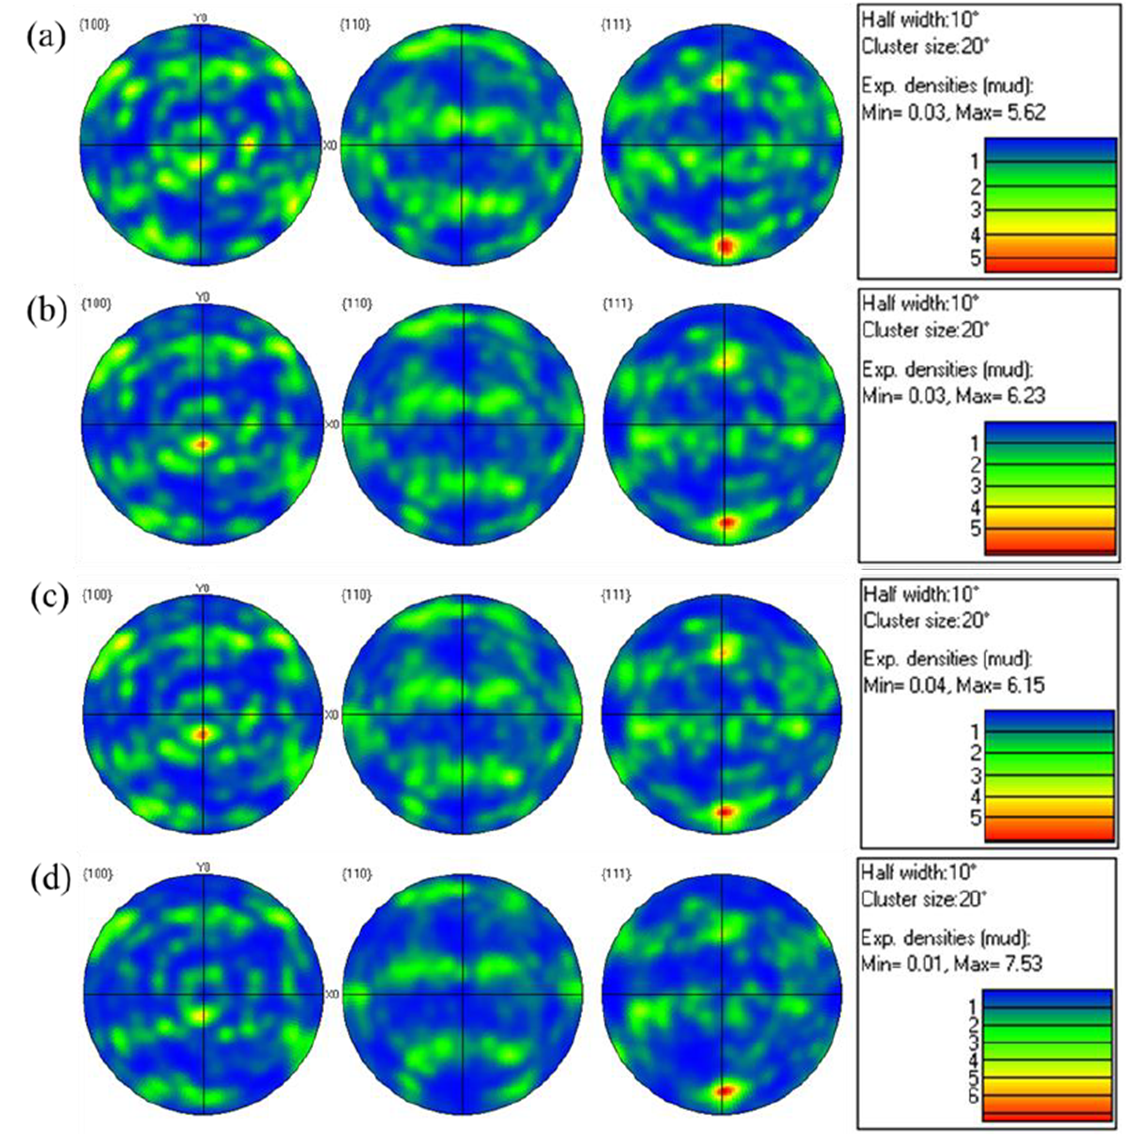 Fig. 10: Pole figures of the grains at the centre of the specimen at: (a) uniaxial start, (b) uniaxial end, (c) biaxial start and (d) biaxial end during continuous strain path change
5 Conclusions
An experimental technique was developed to perform continuous strain path change without withdrawal of the applied load from the specimen. The developed FE model of the rig and the suitable sample geometry was capable enough to mimic the strain path transition as of the experiment. The macro-strain evolution captured at the centre of the specimen by using the DIC analysis confirmed that the DX54 steel specimen underwent uniaxial to biaxial continuous strain path transition. The microstructural analysis was performed by placing the overall set-up inside an SEM chamber. The micro-strain distribution analysed by micro DIC analysis revealed the heterogeneous strain banding on the sample surface and the angle of the bands were rotated during the strain path transition and subsequent deformation. The EBSD and pole figure results confirmed the evidence of grain rotation during strain path change. Thus, DX54 steel is susceptible to grain rotation during strain path transition.
