1 Introduction
Fatigue resistance has become a decisive material property for many engineering products. Especially, for transportation applications where the structural integrity of High Strength Steel (HSS) components often depend on the design against fatigue. Several studies integrated fatigue criteria in non-linear finite element analysis (FEA) of complex parts with specific deformation histories to obtain more reliable lifetime predictions [1,2,3]. For example, cold-formed HSS sections can exhibit large residual stresses, forming prestrains and internal damage accumulation that affect structural performance as well as post-processing in FEA. To this end, recent studies [4,5,6] on the fatigue of cold-formed HSS, provided a validated workflow for modelling and testing this behaviour. However, this workflow currently ignores the possible effect of kinematic hardening on the stress reversal after forming and yielding upon reloading. Isotropic hardening was assumed, implying a uniform expansion of the yield surface rather than a translation or shift of the yield surface, modelled by kinematic hardening. This shift accounts for the Bauschinger effect that describes a change in tensile or compressive yield strength when the direction of loading is reversed after prior plastic deformation [7]. Therefore, the back stress is taken into account, that represents a long-range stress accumulated during plastic deformation as dislocations pile up against microstructural barriers [8]. This effect can play a fundamental role in the strain hardening and micro-mechanical behaviour of metals. For example, during bending of HSS plates, large compressive and tensile stress is found on the in and outside of the bent area, respectively. Subsequently, a stress reversal occurs during springback and the equilibrium of residual stress through the thickness is restored. As bent sections are often subjected to repeated opening loads, tensile stress at the bending root can induce micro-plastic deformation at stress levels lower than the initial yield point [5]. Therefore, it can be of interest to consider kinematic hardening when modelling fatigue of cold-formed parts.
From literature [9, 10, 11, 12], different models exist and the most accepted one is the Chaboche isotropic kinematic hardening model. Material parameters are calibrated from the first or stabilised cyclic loop of a tension-compression test [10]. A recent study was focussed on simulating low-cycle fatigue of an HSS grade [13]. This combined hardening model was introduced to simulate specific deformation features, such as cyclic hardening, stress saturation and above all the Bauschinger effect. From experimental strain-controlled tests, it could be concluded that the material displayed rapid cyclic strengthening followed by stabilisation and eventually softening. Further, kinematic hardening (KH) parameters obtained from the stabilised loop lead to accurate predictions of the fatigue behaviour.
Although the Bauschinger effect has been confirmed for other families of HSS [13,14], little to no research exists for the current grade. In this regard, a numerical sensitivity analysis is performed before embarking on a full experimental calibration. Initial KH parameters are estimated for the Chaboche model that is reduced to its purely kinematic form. The behaviour of both the kinematic and isotropic hardening model is then verified in a simulation of a tension-compression test. Hereafter, a cold-forming application of air bending is considered, followed by cyclic loading. The fatigue life is then estimated and the sensitivity towards the type of hardening is quantified. To this end, the current study covers the effect of kinematic hardening on the fatigue behaviour of cold-formed HSS.
2 Material
2.1 Grade designation and microstructure
A 5 mm thick, hot-rolled, HSS plate is investigated that is classified as S900MC. This structural grade (‘S’) is in compliance with EN 10025-6, has a minimum yield strength of 900 MPa and is produced through a thermo-mechanically controlled rolling process (TMCP), denoted with (‘M’) [15]. Cooling and tempering make the grade suitable for cold-forming (‘C’). Fig. 1(a) exemplifies the typical microstructure, revealing a fine ferrite matrix with slightly elongated grains and pearlite precipitates near the grain boundaries that contribute towards a superior strength.
2.2 Tensile static and fatigue properties
From tensile testing, an experimental true stress-true strain curve is plotted as the black circles in Fig. 1(b). The average tensile properties along the rolling direction (RD), such as the yield strength R0.2, tensile strength R m and maximum uniform elongation ε max are reported in Table 1. An experimental yield strength of 985.2 MPa is found. The grade then exhibits very limited strain hardening before saturating to a plateau of 1095.5 MPa.
Fatigue properties were obtained through a fatigue characterisation of the base material. From the stress-life relation, the fatigue strength σ′f and exponent b were found. Fatigue ductility coefficient ε′f and exponent c were taken from strain-life data of a similar grade of parallel research [16]. These parameters are listed in Table 1 and are used together with the elastic modulus E of 209 GPa to estimate the fatigue life according to the multi-axial, Smith-Watson-Topper (SWT) parameter [17], that reads as:

The critical plane for crack initiation is assumed to be found at a maximum product of the principal stress σ1 and principal strain plitude ∆ε1/2. These outputs are extracted from the FE model and used together with the fatigue parameters to estimate the amount of cycles Niest of fatigue initiation.
3 Numerical modelling
3.1 Isotropic hardening model
Owing to the strong saturating behaviour, isotropic hardening was modelled using the Voce law that reads as [7]:

Here, σ is the equivalent stress expressed as a function of the equivalent plastic strain εpleq. Further, σ0 is the yield strength, Rsat is the saturation stress and b’ describes the stabilisation rate. Experimentally fitted values are reported in Table 1. The strain hardening curve, plotted as the black dotted line in Fig. 1(b), is used to define isotropic plasticity in the FE model and is henceforth referred to as ‘ISO’.
3.2 Kinematic hardening model
When modelling plastic deformation of metallic materials, the evolution of the yield surface can be considered by a translation and an expansion or dilation in 3D stress-space [12]. For cold-formed parts, the accumulated plastic strain potentially influences the stress levels at subsequent cyclic loading [1]. In that sense, a combined isotropic-kinematic hardening model can be introduced. In the uniaxial form, the Von Mises yield function f for combined hardening is given by [13]:

Where σ is the equivalent stress, χ is the back stress, k is the yield stress and R is the isotropic hardening function. As mentioned earlier, the Chaboche model is widely accepted for describing cyclic plasticity. Here, the back stress is formulated according to the Armstrong-Frederick relation [13]:

Where C and γ are material parameters that represent the plastic hardening modulus and the stabilisation rate, respectively. Higher values for γ are associated with a saturation of kinematic hardening rate and a lower terminal back stress C/γ [13]. These KH parameters are estimated based on tension-compression tests. However, before embarking on a full calibration, a numerical exercise is performed to evaluate the sensitivity to a hypothetical yet realistic hardening behaviour.
A sensitivity analysis is performed in Abaqus v6.19 FE software. Here, kinematic hardening can be modelled by entering KH parameters. As there was limited experimental data available, initial parameters were estimated using tensile test data only. The resulting values are stated in Table 2 and correspond with the ‘KIN’ model. The evolution of the corresponding back stress is plotted as the red dotted curve in Fig. 1(b).
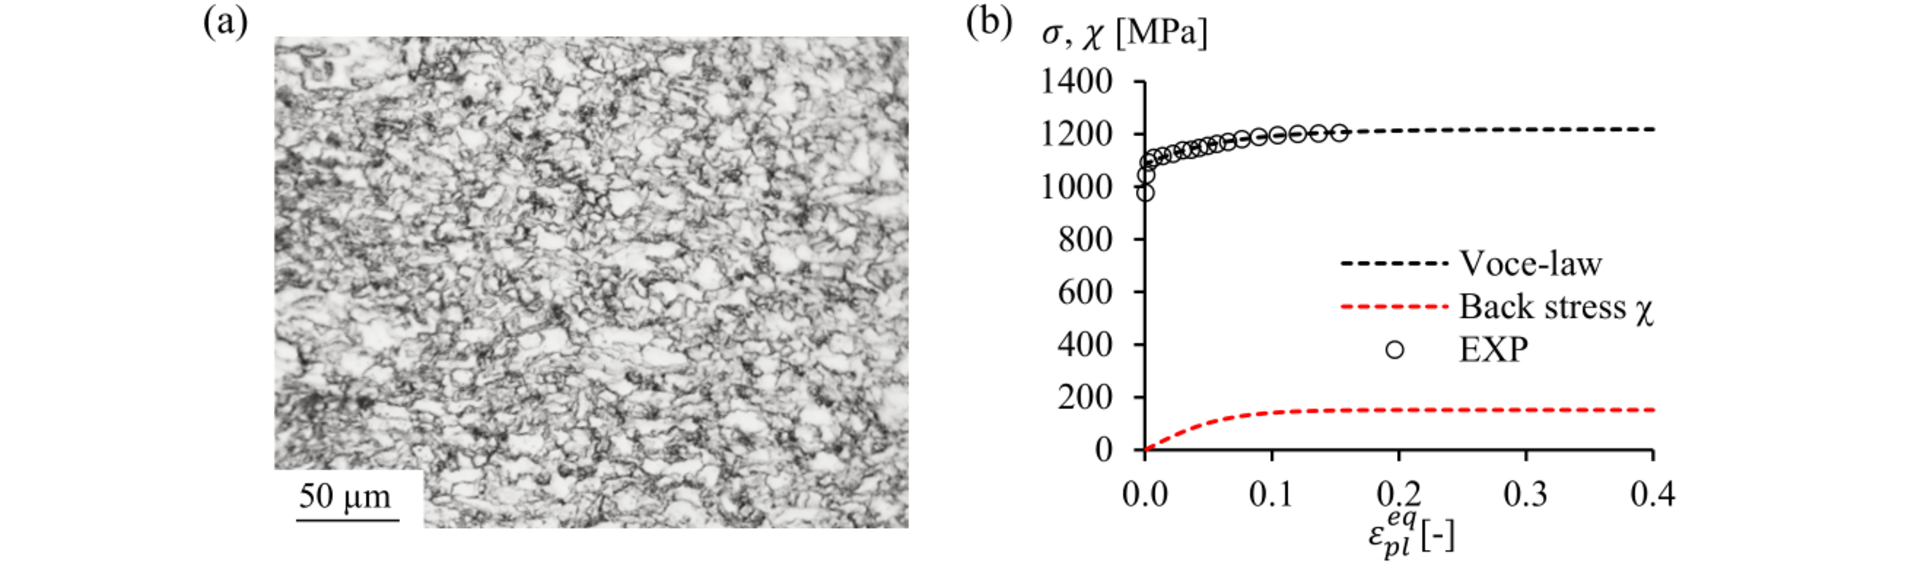
Fig. 1. (a) Microstructure of S900MC. (b) True stress-true strain curve.
Table 1. Isotropic hardening and fatigue parameters.

Table 2. Kinematic hardening parameters and estimated terminal back stress.

3.3 Tension-compression model
First, the introduced hardening models are assessed in a virtual tension-compression test. Fig. 2(a) shows a solid part corresponding to a quarter of the dogbone specimen that was used for tensile testing. Both x- and y-symmetry boundary conditions were applied and a displacement of 1.5 mm was imposed according to a fully reversed sine wave. Y-components of stress S22 and logarithmic strain LE22 were extracted from the central region to construct the initial hysteresis loop, shown in Fig. 2(b). It can be inferred, that the tensile stress-strain evolution is accurately reproduced by both material models ‘ISO’ and ‘KIN’.
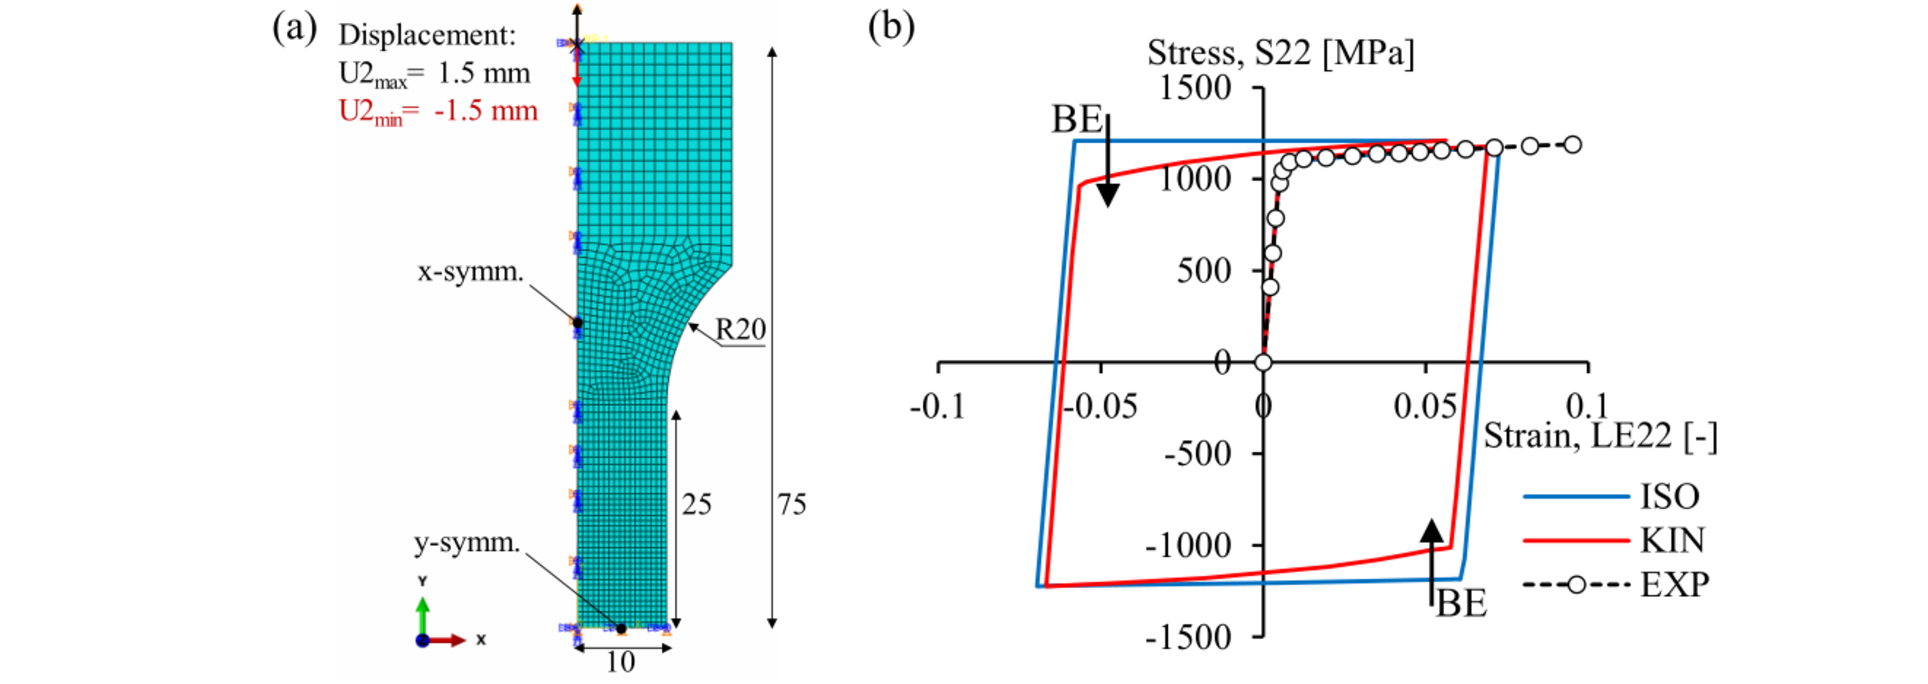
Fig. 2. Tension-compression model. (a) Modelling details. (b) Characteristic, cyclic stress-strain curve obtained using different hardening models.
Further, the Bauschinger effect, indicated by BE, is noticed by the transient behaviour in compression and subsequent tension, and corresponding earlier yield points. Conversely, isotropic hardening culminates into a strong stress plateau. Note that only the tensile part is compared and the obtained back stress still requires experimental verification. Nevertheless, the estimated KH parameters predict a realistic response to cyclic loading.
3.4 Cold-bending and fatigue model
From previous research [4, 6], an ‘S’-shaped specimen is adopted. It has a minimum width of 68 mm, a bending ratio of 2 and die-width ratio of 10. The last two ratios were adopted from an industrial guideline [18] and describe the ratio of the punch radius and die-width to the plate thickness, respectively. More details on the specimen design and fatigue testing can be found in [4].
The FEA procedure, shown in Fig. 3(a), starts with an air-bending operation followed by springback and tensile fatigue loading. An elastic modulus E of 209 GPa, Poisson’s ratio ν of 0.3 and density ρ of 7800 kg/m3 were defined as basic material properties. Only half the specimen is modelled as a solid part by sectioning along the xy-plane and applying a z-symmetry boundary condition. For bending, three rigid instances model the cylindrical punch and two die rollers. Surface-to-surface contact is used with a frictional coefficient μ of 0.05 [19]. The mesh has a minimum element size of 0.5 mm and a total of 50322 linear brick (C3D8R) elements. Two implicit steps simulate the last bending operation in obtaining the final shape of the specimen: a static step for bending, followed by a dynamic step for springback [20]. For bending, a straight-angle punch stroke of -18.7 mm is imposed [4]. This value corresponds with a 90 ° angle after springback and is determined through several iterations. For springback, the punch is retracted while fixing the bending axis of the part in x-direction (U1=0) allowing for the elastic recovery.
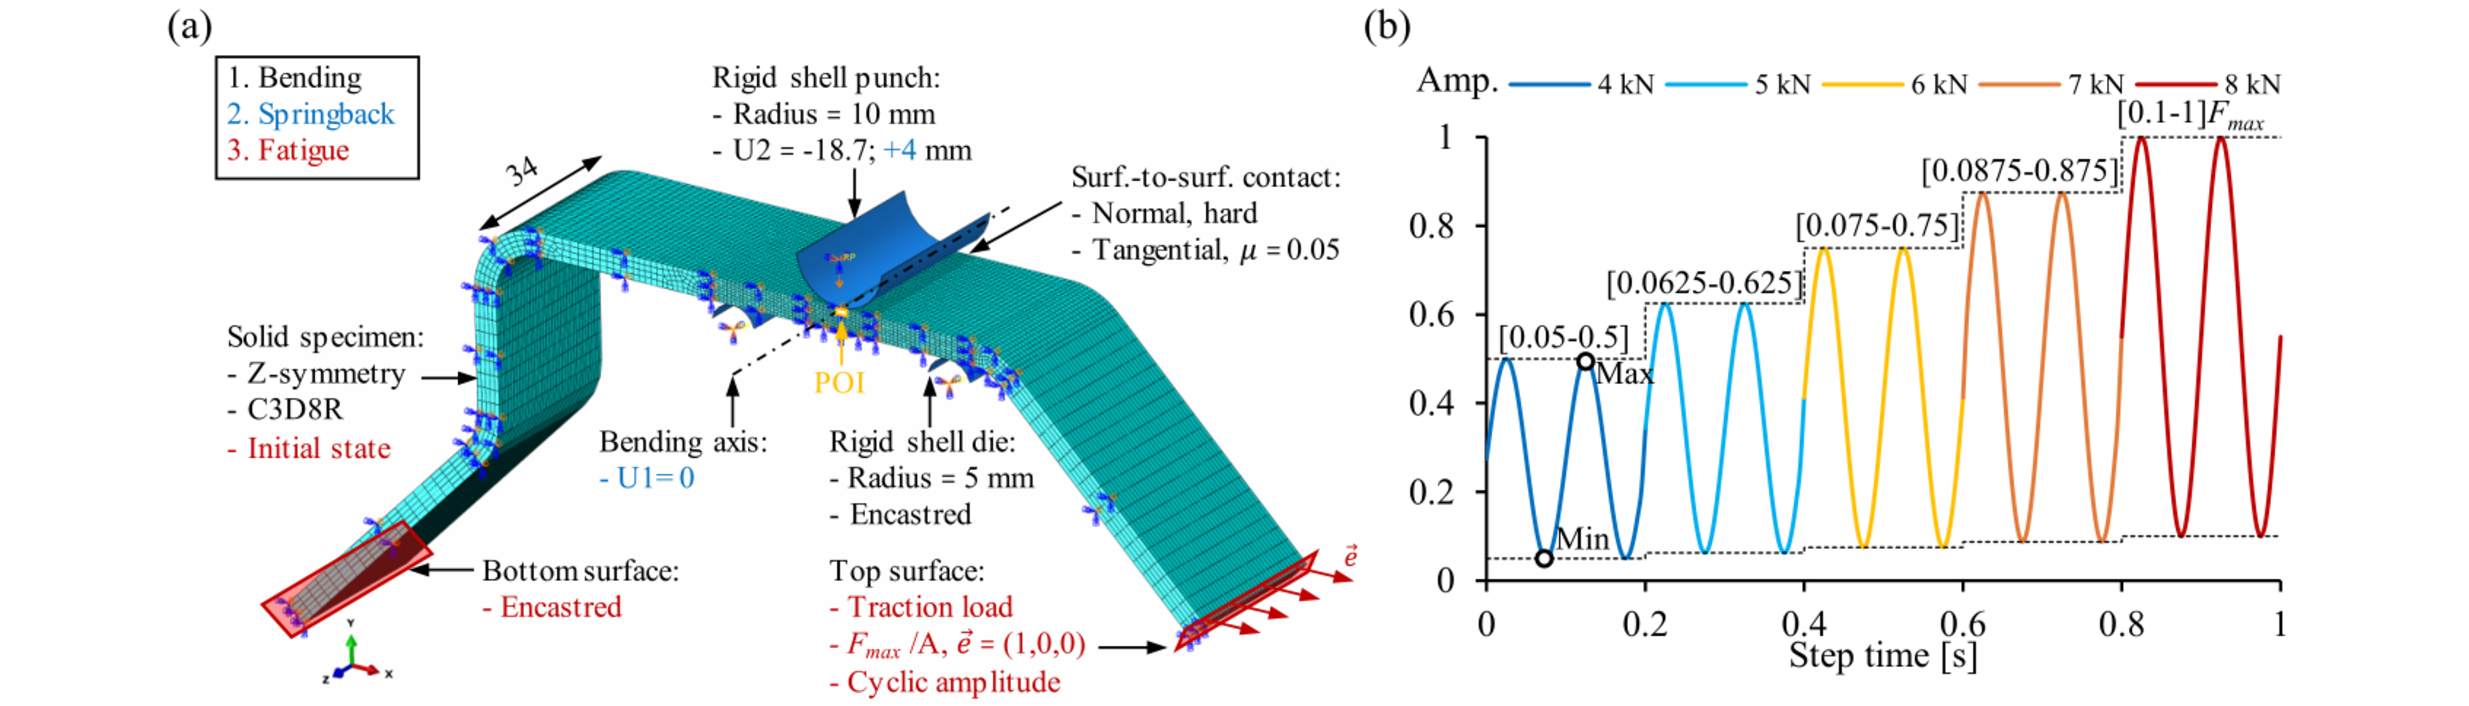
Fig. 3. FEA procedure. (a) FE model assembly with mesh, boundary conditions, loads and contact properties. (b) Cyclic loading amplitude for tensile fatigue load.
Restart files are requested to compute an initial condition in the separate fatigue model. This recalls the stress-strain results of the last step of bending. During loading, the bottom surface of the specimen is fixed by an encastred boundary condition, ensuring a stable analysis. Surface traction is imposed on the top surface, with a magnitude of Fmax of 8 kN divided by the area A of 68x5 mm2. The normal unit vector e̅ > is aligned with the x-axis, considering the final horizontal position of the top surface, after bending. A cyclic amplitude is defined as an increasing sine wave, displayed in Fig. 3(b). Five different load levels, with maxima ranging from 4 to 8 kN, are modelled with a tensile load ratio of 0.1. Two cycles are implemented at every load, between distinct intervals that are a fraction of Fmax. This allows for the results to be separated into five independent fatigue tests. Additionally, stress relaxation caused by plastic strain increments of every first peak of loading is integrated. Fixed time increments of 0.005 s are specified for both the amplitude and step to synchronise the output with the loading sequence. The damage parameter of Eq. (1), is then calculated between the minimum and maximum of a reversal, indicated in Fig. 3(b). By means of Python scripting, element values for stress and strain are extracted from a surface set on the inside of the bent area, where crack initiation occurs. The script then creates two new field-outputs based on the computed damage parameter and numerical life estimation Niest. in cycles.
4 Results
4.1 Stress-strain response
Since the maximum principal stresses in the FE model are oriented along the tensile direction, x-axis in Fig. 3(a), the corresponding stress S11 and logarithmic strain LE11 components are considered here. Fig. 4(a) shows the local response of a single element on the bending axis that serves as the point of interest ‘POI’. The evolution of stress versus strain is shown for bending, from A to B, followed by springback, from B to C and fatigue loading, from C to D. During bending, similar stress levels are found yet kinematic hardening leads to a forming strain of -0.35 that is 8 % larger relative to isotropic hardening. At subsequent fatigue loading, a significantly lower maximum stress is found for the kinematic model, point D.
This reasoning is confirmed in Fig. 4(b), where the stress-strain evolution during cyclic loading is plotted. Corresponding load levels F are mentioned in the graph and a minimum load at 0.8 kN is indicated by D’. For the ‘ISO’ model, yielding occurs as from 5 kN, whereas the ‘KIN’ model considers an instantaneous re-plastification at stress levels that are approximately 21 % lower than for ‘ISO’. As this stress directly enters the fatigue life calculation, a lower damage parameter and longer life can be expected.
Furthermore, when yielding reoccurs, for example in D, the following minimum stress in D’ is notably lower than the residual stress, in C. On that account, the plastic strain increment of fatigue loading results in a geometrical modification of the element and stress relaxation. Thus, a cyclic amplitude is essential for reproducing the correct stress and strain levels used for post-processing in terms of fatigue assessment.
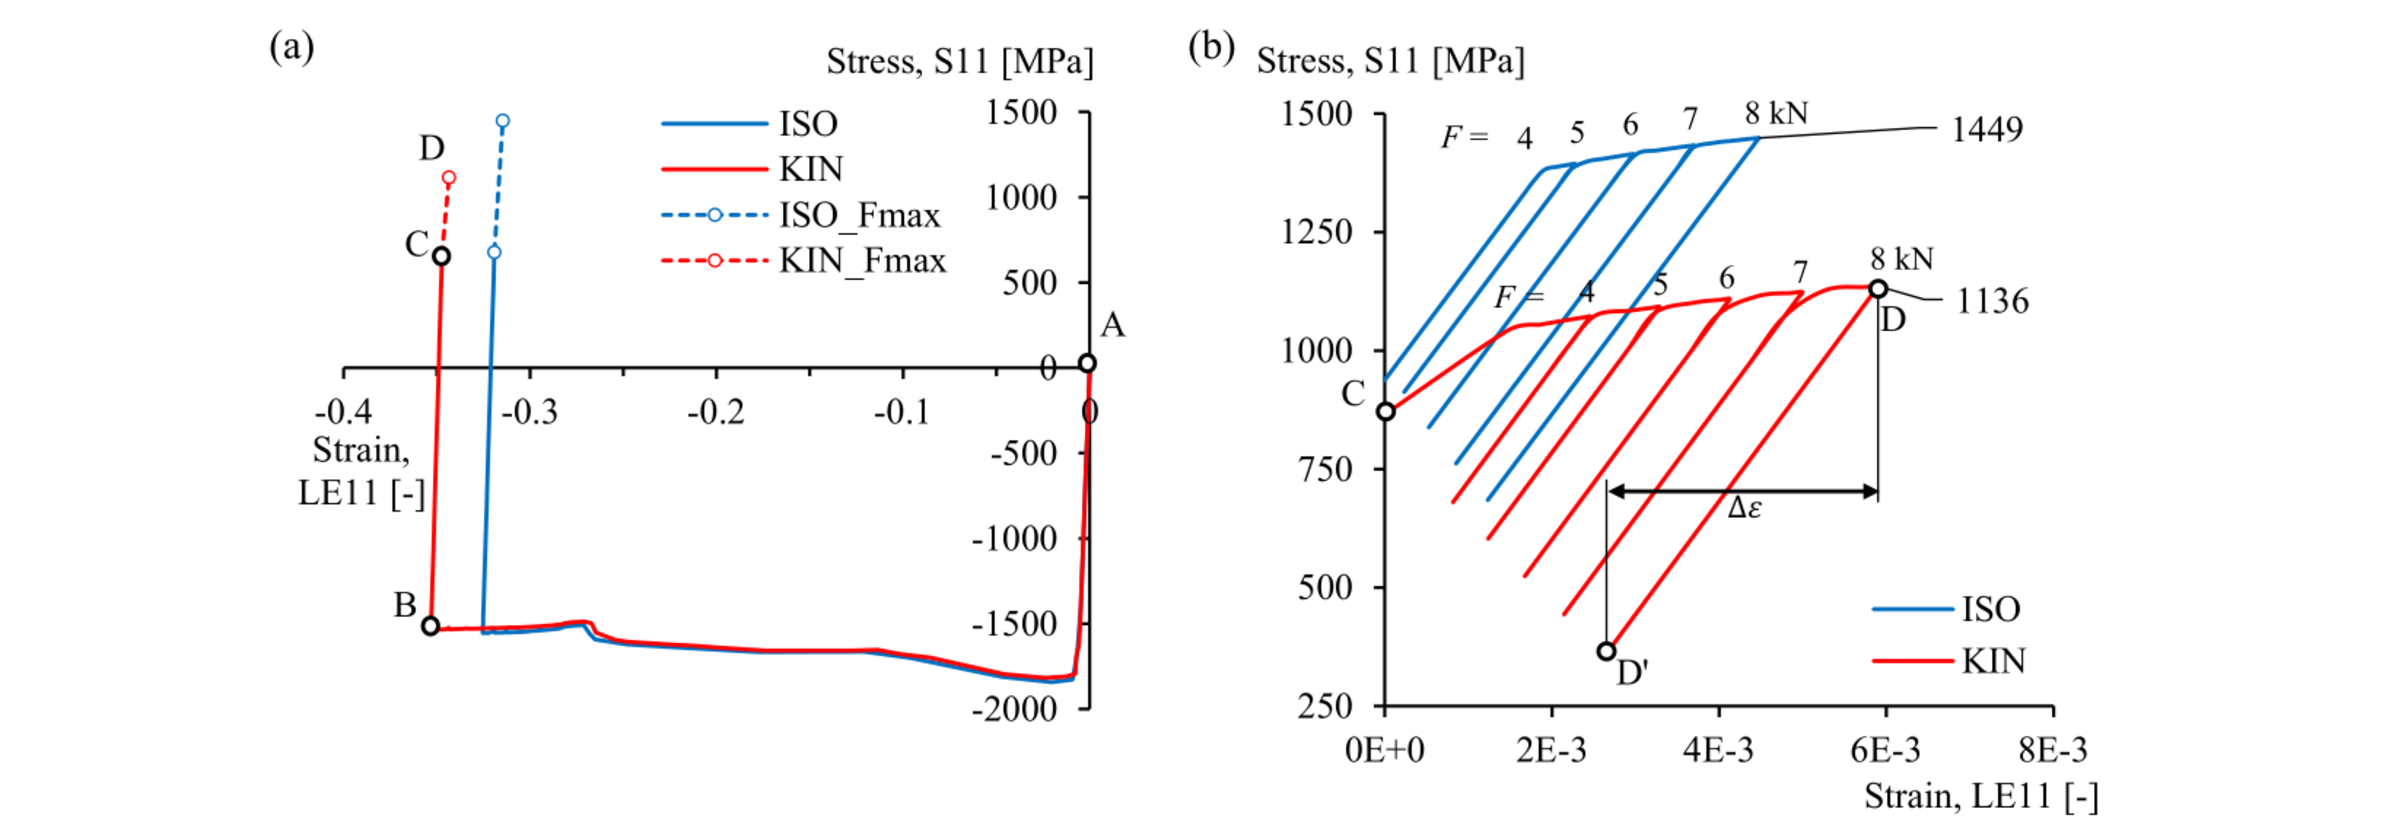
Fig. 4. Stress-strain response. (a) Bending, springback and the maximum fatigue load of 8 kN. (b) Fatigue loading at all five load levels.
4.2 Fatigue life estimation
In Fig. 5(a), the generated field output is shown in the bent area that reflects the distribution of fatigue life obtained for kinematic hardening at the maximum load level of 0.8-8 kN. The numerical life is based on the damage parameter computed between specific frames of the second cycle of the load of interest. From the data shown in Fig. 4(b), both hardening models produced similar strain ranges Δε at every load level. At the same time, a strong decrease in stress leads to the longer life estimation for the ‘KIN’ model shown in Fig. 5(b). Here, the maximum nominal stress σn is plotted against the fatigue life. This stress is found by dividing the load F by the minimum area A (68x5 mm2). Compared to the isotropic model, an average increase in fatigue life estimation of 65 % is noticed. In that sense, the assumed kinematic hardening improves the predictive capability of the FE model. Considering, that the estimated life only covers the initiation period, the underestimation of the experimental life up till fracture Nf is typical [6].
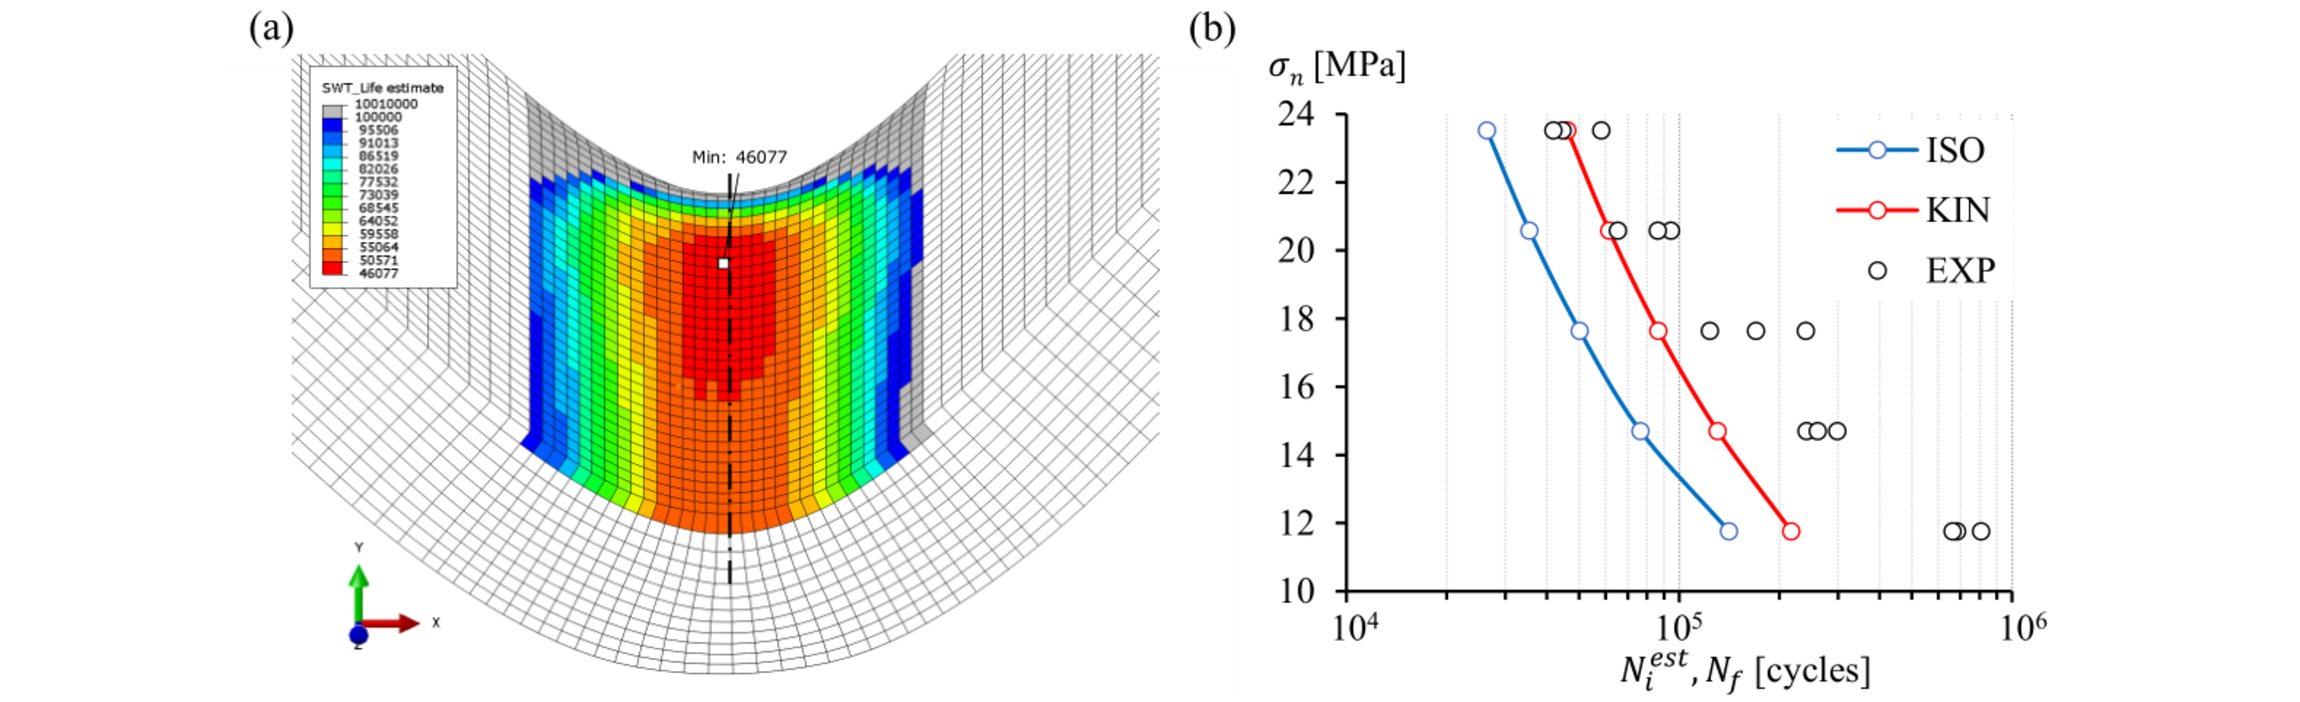
Fig. 5. Fatigue life estimation results. (a) Field output in the bent area of the FE model. (b) Stress-life graph for comparison of FEA with experiments.
5 Conclusions
A 5 mm S900MC HSS plate was considered in a specific forming application of cold-bending followed by fatigue loading. Since the Bauschinger effect has been confirmed for similar HSS grades, the influence of kinematic hardening on a bending and fatigue simulation was studied here. Initial parameters were estimated for the kinematic hardening model that was compared to a conventional isotropic hardening model. A simulation of a tension-compression test assured the proper behaviour in tension and revealed the Bauschinger effect in subsequent compression.
By including kinematic hardening in the bending simulation, the forming strain was 8 % larger and the residual stress was slightly lower compared to isotropic hardening. For subsequent cyclic loading, the updated yield stress was approximately 25 % lower for the kinematic model. In other words, the bending process induced a significant shift in the yield surface that affected the material’s response to fatigue loading. Additionally, stress relaxation was simulated by adopting at least two cycles for every load in a cyclic amplitude. This approach integrated slight increments of plastic strain in the obtained stress and strain ranges of fatigue loading.
Further, an average decrease in maximum fatigue stress of 21 % was noticed for the kinematic model relative to the isotropic model. In turn, this drop led to an increase of 65 % in estimated fatigue life.
The analysis proved an unambiguous sensitivity towards kinematic hardening when it comes to the fatigue life estimation of cold-formed components. Nevertheless, experimental verification of the assumed KH parameters is deemed necessary. Hence, future work will consider a calibration of the cyclic properties as well as a validation of the strain fields caused by bending and fatigue loading.
Acknowledgements
The authors are grateful to OCAS (Research Centre for the Application of Steel) for supplying the steel plate.
