1 Introduction
The progress in the metal forming technology has been driven by with growth of automotive, aerospace, shipbuilding, and manufacturing infrastructure. Different types of complex products using metal forming are widely used to the subframe, product skin, product component, and so on. Once a formed product is used as a component of an assembly, its dimensional accuracy based on assembly tolerances affects product assembly of components and quality control [1]. Springback is an inevitable phenomenon under certain metal forming conditions. It is an important factor which decreases geometrical accuracy and reduces product quality if not controlled properly. While many theoretical approaches have been developed to predict springback, these are not fully capable to represent the actual forming process due to the process complexity and parameter uncertainty [2]. Several factors of forming processes—i.e., material and machine condition, manufacturing environment, etc.—can cause geometrical variability due to springback.
Geometric measurement after metal forming is usually the first step to understand the geometric accuracy by springback. Many researchers have studied springback measurement methods, such as non-contact measurement. A laser beam as a non-contact method was proposed to measure springback in rotary draw bending by Ha et al. [3]. They used a laser assembly fitted at the tip of a circular profile making a reference for the longitudinal direction of a profile during bending. The location change of a laser beam by a springback phenomenon was shown on the target board. By reading the change of laser beam locations between loading and unloading, the springback angle was obtained with the trigonometric calculation. Ghiotti et al. [4] proposed a springback measurement technique in roll bending using an inertia measurement unit (IMU) attached to a mandrel. The angular velocity and acceleration data were acquired by the IMU, and the bend radii and springback factor were calculated. Hamedon et al. [5] introduced a deformation measurement technique by adopting a borescope attached to a stamping die. A 90° folding mirror was added to overcome a space constraint and acquire image frames of a workpiece. The geometrical status, i.e. deformation, wrinkling, and springback of a workpiece in stamping, can be monitored in real time. However, an additional piece of equipment for protecting a sensor from e.g., high temperature or lubrication of a die is necessary under certain circumstances. Ferreira et al. [6] integrated an image processing into a press controller to calculate springback angle during forming operations. The original image was converted and filtered to obtain a binary image of an aluminum alloy sheet. The binary image was divided into two frames of left and right edges, and then the springback angle was calculated by detecting two extreme points of the edge to make a reference line of the sheet metal.
The aforementioned measurement methods do not need physical contact to measure geometry in real time. Nevertheless, those methods require a location to install a sensor to a forming system, or an extra component to protect a sensor [3–5]; simple image background can be necessary to easily detect the edge of sheet metal [6].
To overcome some of the limitations associated with image processing in metal forming, this paper presents a springback measurement technique by computer vision used under complex and heavy-noise image background. Three points on the side of a profile were marked on prescribed locations, and a simple cell phone camera was used for image acquisition. The image processing was based on the stretch bending process of a large profile in real time. Local point tracking was applied to follow the deformation of the profile instead of a global search of the image.
The remainder of this paper is organized as follows: An overview of the stretch bending machine for experiments is presented in the Section 2. Springback measurement for a large profile is introduced in Section 3. The measurement validation of the computer vision and conclusions are addressed in Sections 4 and 5, respectively.
2 Three-dimensional (3D) stretch bending
A rectangular hollow profile of length 1,900 mm is used in the three-dimensional stretch bending machine, shown in Fig. 1. Unlike transverse die forces applied to the profile [7,8], rotating dies are used for stretch bending in this machine. The bending machine has two sets of a two-axes gimbal system, and the rotating pivots of each gimbal are orthogonal. It has five degrees of freedom (DOFs) for stretching and bending. 1 DOF serves to stretch the profile in the horizontal direction, other 2 DOFs enable bending in the horizontal direction, and the other 2 DOFs enable bending in the vertical direction. Each arm is symmetrically set. The arms can be independently controlled in 5 DOFs, providing product flexibility. The bending die is three-dimensional; thus, the profile can be bent in vertical and horizontal directions. Moreover, several sensors, i.e., position and torque, are used to monitor the process and provide feedback to the control system.
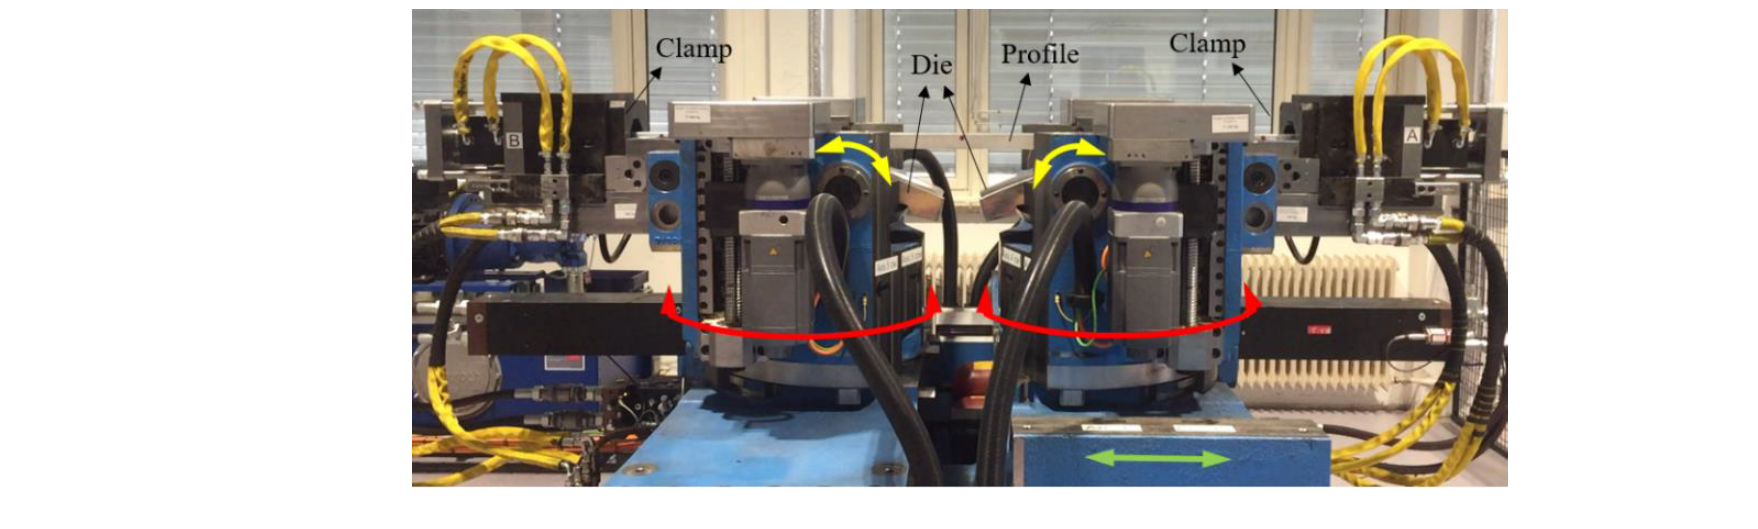
Fig. 1. 3D stretch bending machine
The machine operations in translation (green arrow) and horizontal bending (red arrows) are controlled by hydraulic forces. The yellow lines of the machine in Fig. 1 are the hydraulic hoses. On the other hand, machine operations in vertical bending (yellow arrows) are controlled by servomotors and ball screws. A profile installed into the die is clamped at the ends. Thus, the hydraulic clamping system with an insert constrains the profile. The right arm base is translated to prestretch the profile until the prescribed time and position are reached. Next, the profile is bent in the vertical direction. For 3D bending, as shown in Fig. 2, the profile is subsequently bent in the horizontal direction. The rotating speeds of all pivots for bending are also controllable. The clamped profile is released after bending, and then the profile is free to spring back.
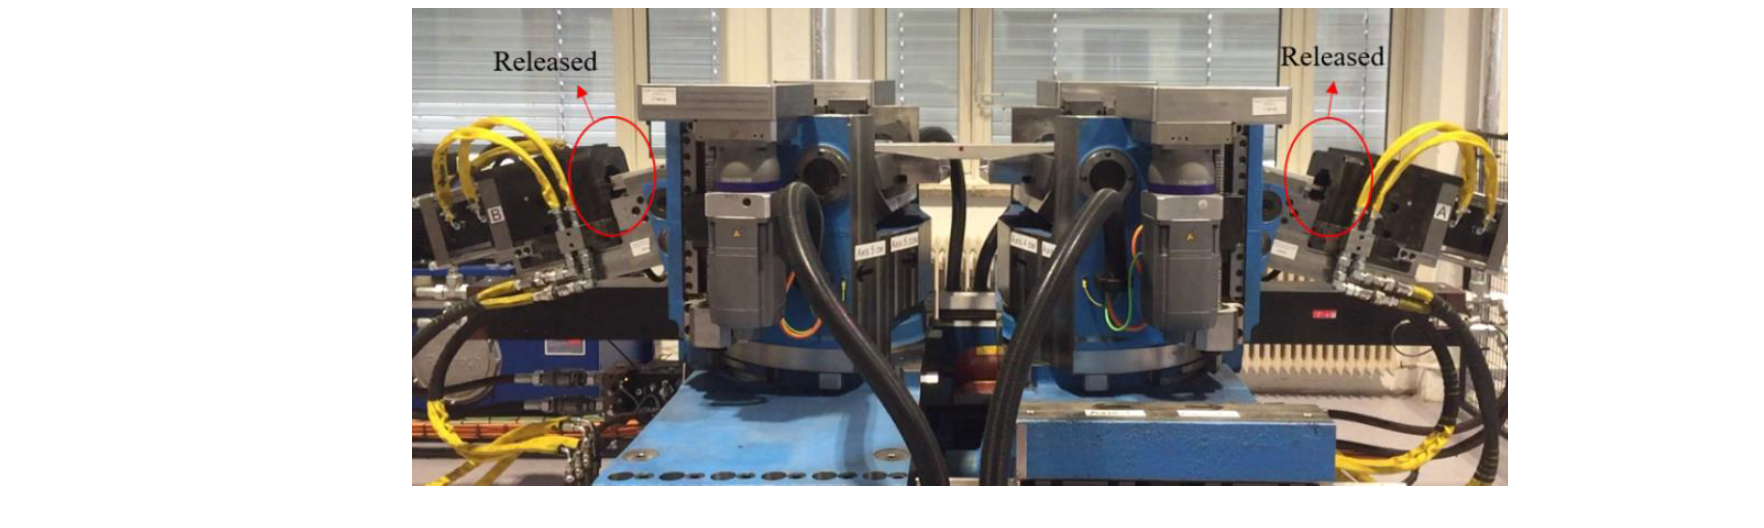
Fig. 2. 3d profile bending
3 Springback measurement procedures
3.1 Experimental set-up
AA6062 T-4 hollow profiles were symmetrically bent in the vertical directions (yellow arrows in Fig. 1). The specific material dimensions and properties are shown in Table 1. Since the profile length was 1,900 mm, it is challenging to measure geometry with a coordinate measurement machine (CMM) or a vernier caliper due to the measuring range. While a laser tracker or a 3D scanner is an option to measure such a large-sized object, cost efficiency, measuring accuracy, or measuring resolution can be a problem. To achieve an affordable and feasible measurement, a cell phone camera (iPhone 6) and a laptop computer (i5-7200 CPU 2.5GHz / 8GB RAM) were used for image data acquisition and processing. The acquired color images were 1920 pixels wide and 1080 pixels high. The iPhone 6 camera with a 73° field of view was set up perpendicularly to the machine to avoid skewed images. Fig. 3 shows the side view of a profile, which has three points. Since point marking is robust to vibration or any other external noise, two points were marked at a prescribed location of 150 mm from each extreme edge and 30 mm from the bottom, while the third point was marked at the center of a profile.
Table 1. Material dimensions and properties

 Fig. 3. Three reference points on the side of a profile
Springback is an elastic recovery phenomenon occurring right after unloading. During the bending process, three image frames are acquired to calculate springback at t0, t1, and t2 in Fig. 4. t0 show the moment that a profile is fully clamped and ready to bend; t1 show the moment that a profile is bent to the target angle and ready to be released; t2 shows the moment that a profile is fully bent and released. Each image frame is segmentized and filtered to extract the three reference points. The first image enable transforming the real distance to the distance between the pixels of points 1 and 3 on the image frame. It allows the distance per pixel to be calculated. From the second and third image frames at t1 and t2, the deformation status of the bent profile is identified. Springback as shown in Fig. 4 is obtained with the three points marked on the profile.
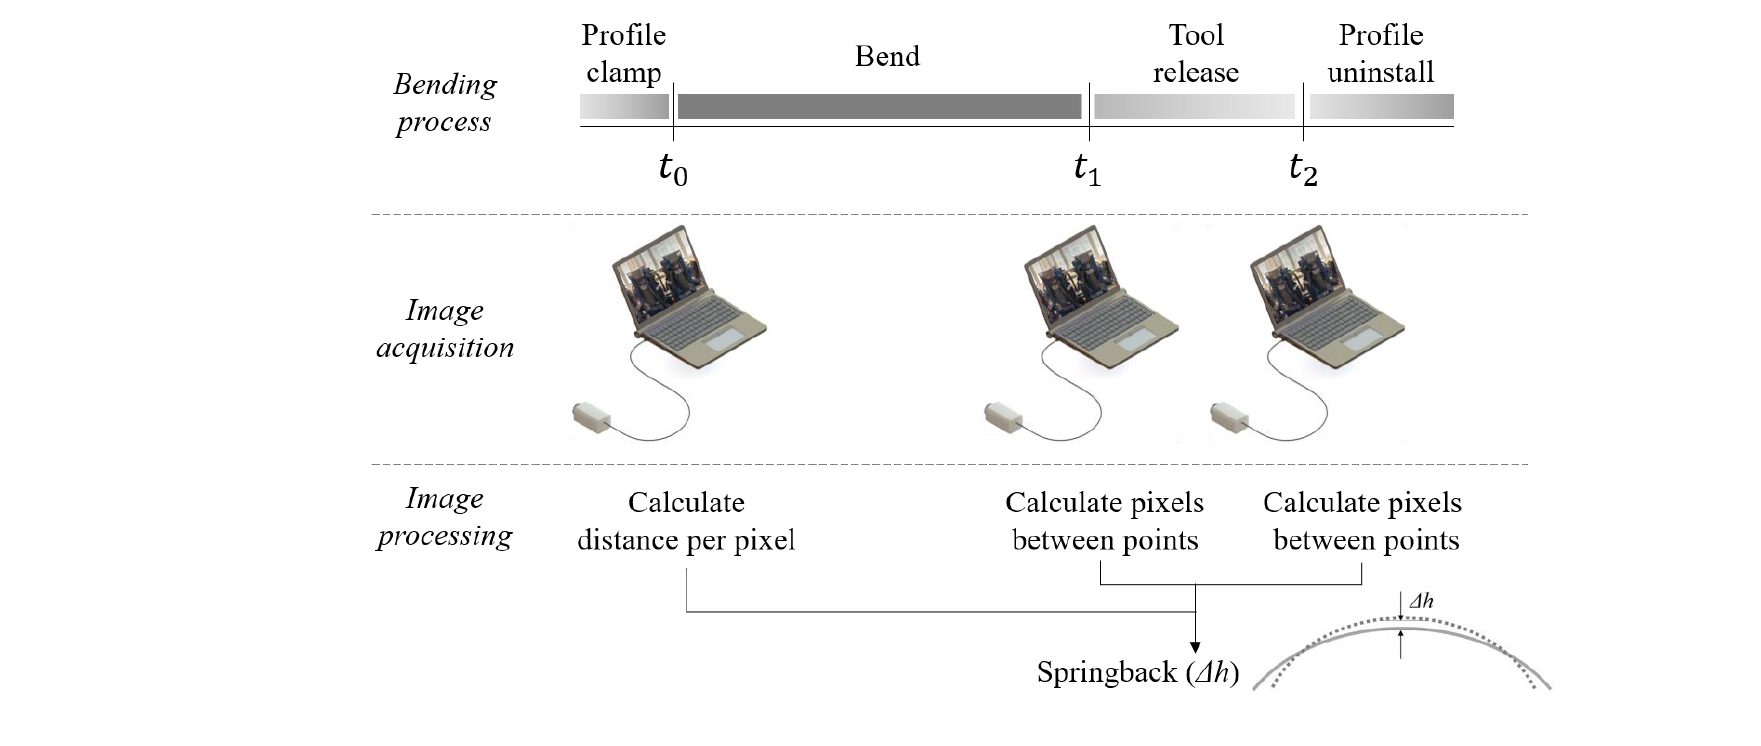
Fig. 4. In-situ springback monitoring procedures
3.2 Image processing for springback measurement
Computer vision technology as a means of sensing has been widely applied to detect, discriminate, recognize, and track an object with high accuracy from food quality evaluation [9] to traffic analysis [10], autonomous driving [11], or exploring space [12]. For the geometrical measurement with computer vision, displacement history of long-span bridges was measured with LED targets and a high-resolution camera [13]; seismic responses of a bridge under the different weight and speed of vehicles were monitored with a vision-based system [14]; digital image correlation (DIC) was also used for deformation measurement of an object surface [15]. Based on such computer vision techniques, springback in metal forming was measured without contacting the workpiece or necessitating removing it from the machine.
The three image frames from the camera were processed within MATLAB environment. Generally, image pre-processing is required to separate a target object from the image background. An image of the manufacturing environment does not possibly provide clear image background, and the obtained images may also have a complex and noised background, as shown in the image histogram of Fig. 5. The intensity of image pixels is broadly distributed, and all image pixels, except for the target object, act as noise for image processing. An advanced algorithm is necessary to detect and extract the points for global object search, but it can require a high-performance hardware and much of computation time.
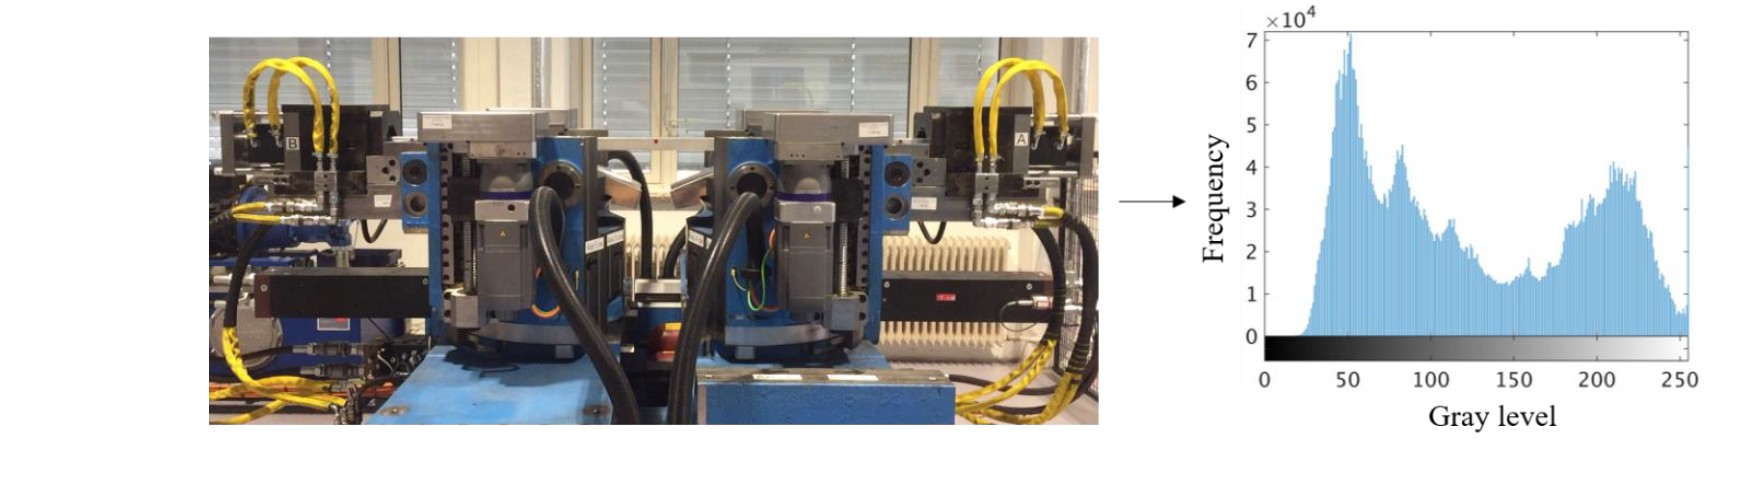
Fig. 5. Gray-level histogram of the image
To avoid background noise, a local search instead of a global one was used by segmenting a region of interest (ROI). The converted gray-scaled image is expressed as
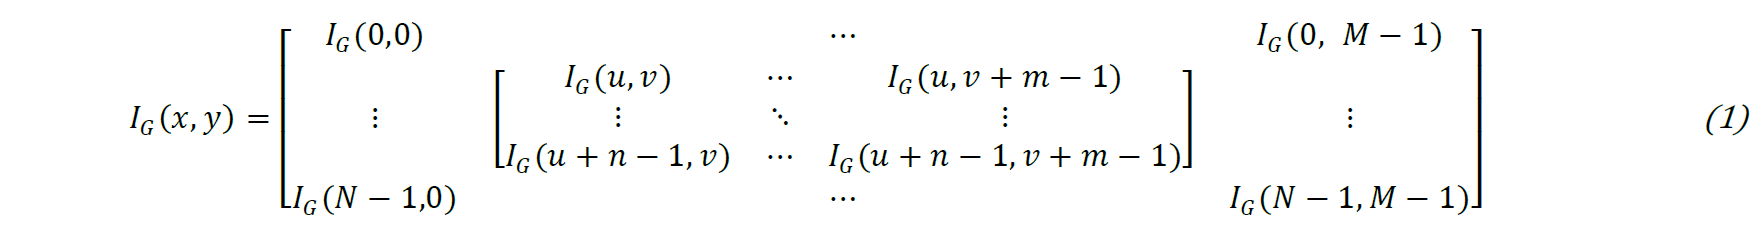
where 𝐼𝐺 (𝑥, 𝑦) is the image intensity, M and N are image resolution in an image. A matrix in 𝐼𝐿 (𝑥, 𝑦) represents the intensity of a segmented image for local search of a target object, and it can be expressed as

where m and n are image resolution of the segmented image. A local search strategy reduces computation time. Each element of the local matrix is also transformed into the global coordinate 𝐺(𝑥, 𝑦), given by

The circle Hough transform (CHT) [16,17] was used to find the point center of a profile in the segmented image. The general equation of a circle centered at (a, 𝑏) with radius 𝑟 is given by

The locus of the center can be expressed in polar coordinates as

The image space is transformed into the parameter space with Eq. (5). Fig. 6 illustrates the CHT concept to search a circle center; black dots are edge pixels, and a triangle is the peak in the parameter space. The parameters, the locus of center and radius, generate many circles in the parameter space along the edge of the image space. The parameter space contains a peak, an overlapped point, which can be represented as the center of the circle.
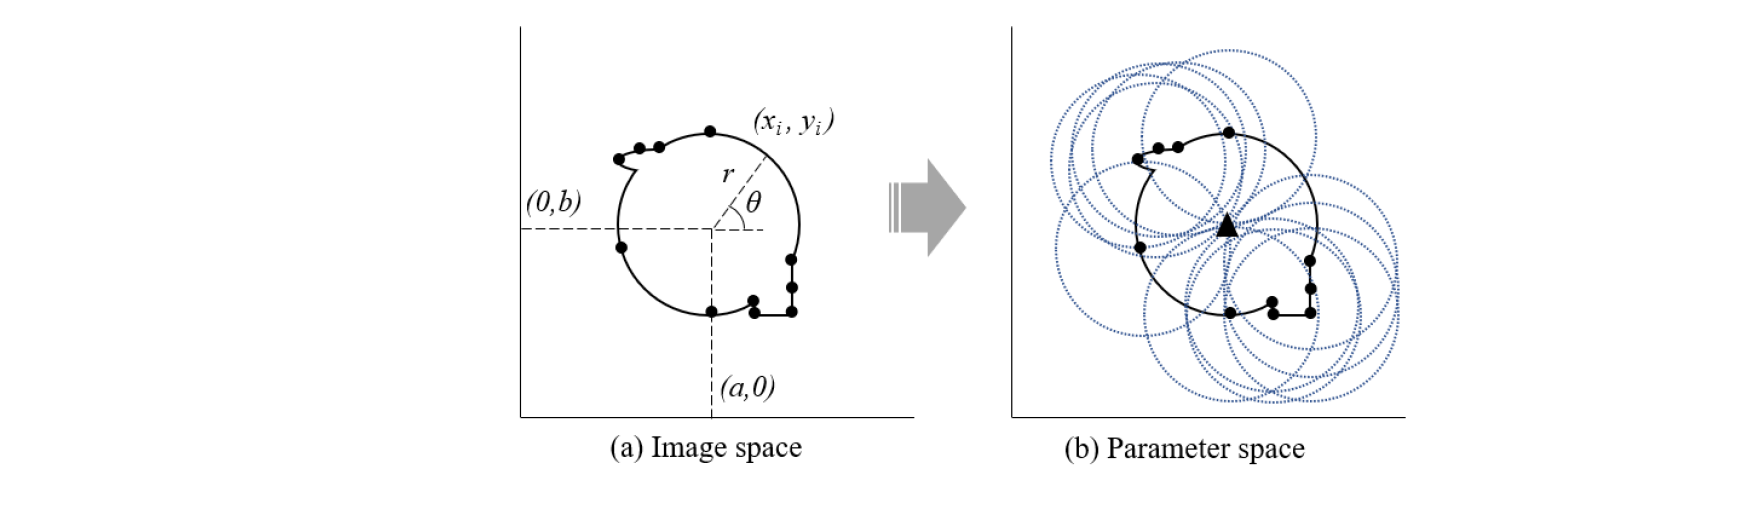
Fig. 6. Concept of the circular Hough Transform
Fig. 7 shows an original image after loading and unloading. As mentioned in Section 3.1, the locations of points are predetermined. Three local regions containing a reference point at time t0, t1, and t2 are segmented based on the input bending angle. Red cross-hairs represent locations of reference points by circle detection. In Fig. 8, the procedure to search a circle on the image is introduced. The first image of points 1, 2, and 3 is the segmentation from the original image; the second image is a gray-scale image; the third image is a binary image by thresholding; the last image shows the circle detection. The local coordinate of the circle searched by the CHT in the fourth image of Fig. 8 is transformed into the global coordinate given by Eq. (3).
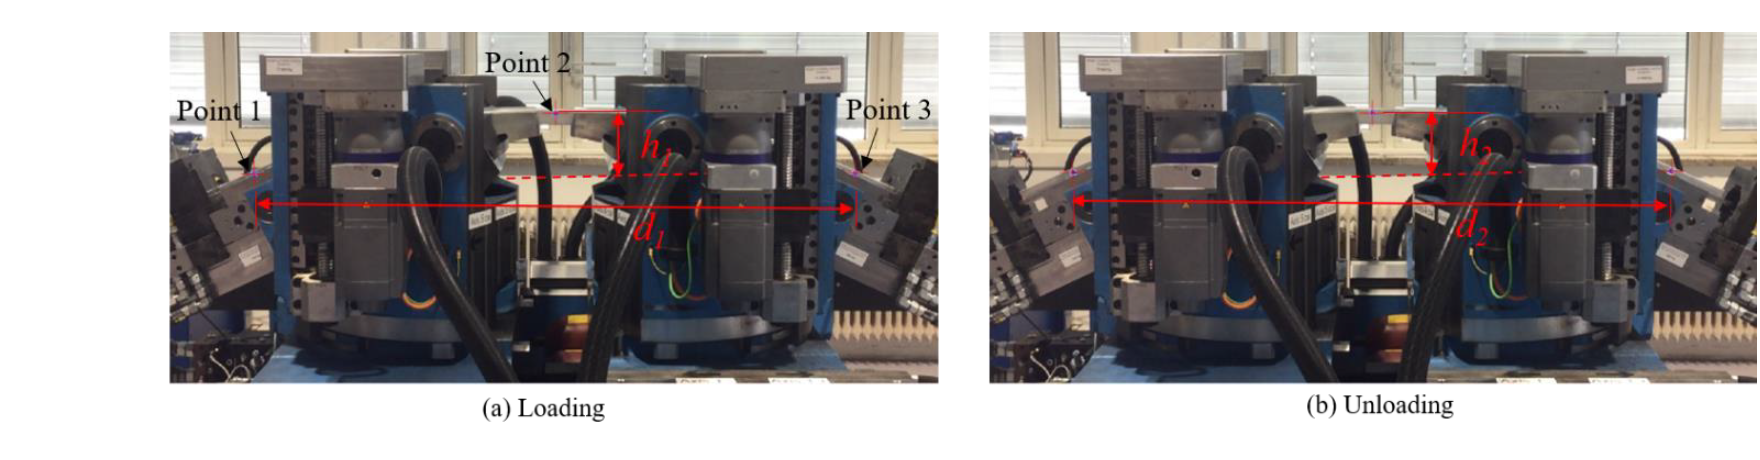
Fig. 7. Original images of 50° bending
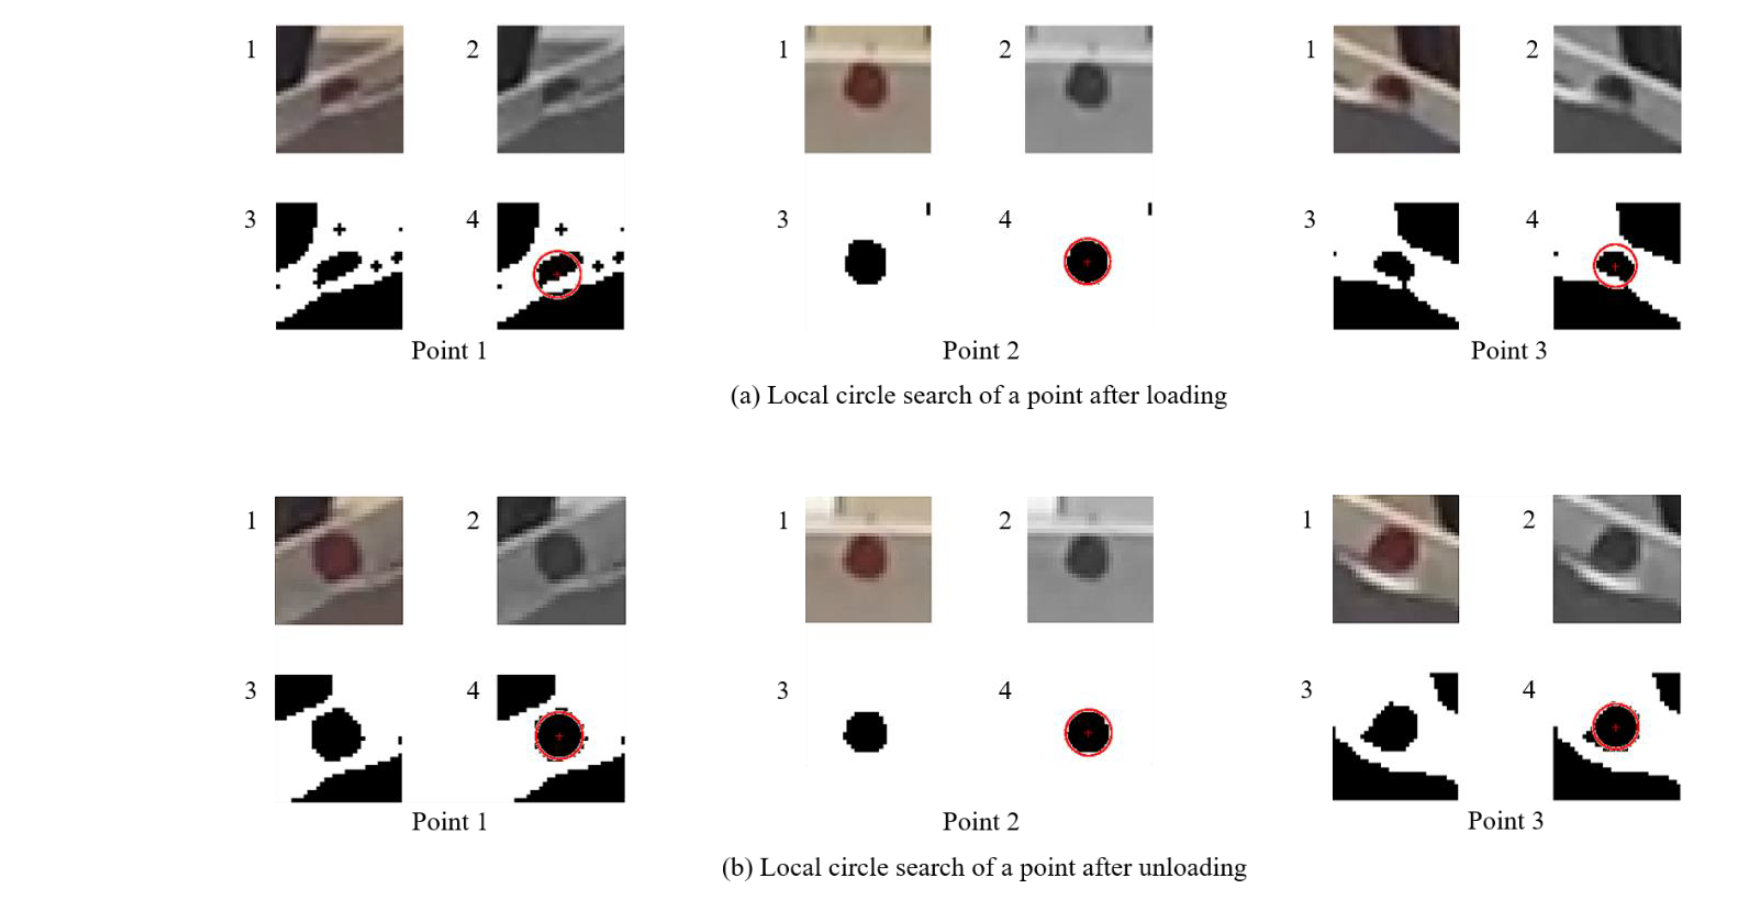
Fig. 8. Image filtering and target detecting of 50° bending
The height between point 2 and a line passing through points 1 and 3 is changed after unloading, as shown in Fig. 7. The height h is computed in the global coordinates given by

where x and y represent the coordinate of the point’s center, and the subscript indicates the number of points. The springback Δh in Fig. 9 is the change of a sagitta and computed with two different sagittas from the loading and unloading status, which is expressed as

where h1 is the chord height of a profile prior to unloading, and h2 is the chord height after unloading.
4 Measurement validation
Two profiles were bent at 30° and 50° angles. To validate the proposed computer vision technique, measurement results by computer vision were compared with manually measured two profiles. Measurement by computer vision was validated with the measured data after unloading, since manual measurement was conducted with the profiles after springback. Fig. 9 illustrates a scheme manual measurement for springback. A profile was supported at two datum points by a fixture, and a Vernier caliper was used to measure the height h2 from the reference distance L. Intrados of the profile was measured, representing the surface of die contact. Since the radius of the bend die, approx. 1,807 mm, is relatively larger than the center of the reference points from the bottom in Fig. 3, the reference points were used for springback measurement. As shown in Fig. 9, springback was evaluated by the difference between the height, h1 and h2.

Fig. 9. Scheme of springback measurement
The two profile samples of 30° and 50° bending are shown in Fig. 10. Measured data after unloading by the computer vision and manual are listed in Tables 2 and 3, respectively. In brief, the height in Tables 2 and 3 increases as the bending angle increases, and the height becomes larger when the reference line increases. The reference points on a profile were predefined for image processing, and their location were changed during the bending cycle. Since the distance between points 1 and 3 was not the same as the fixture distance, L=1764mm in Tables 3, measured data by the computer vision were converted to compare springback. Table 2 included raw data by the computer vision, and the converted data based on the fixture distance of manually measured profiles is listed in Table 4.
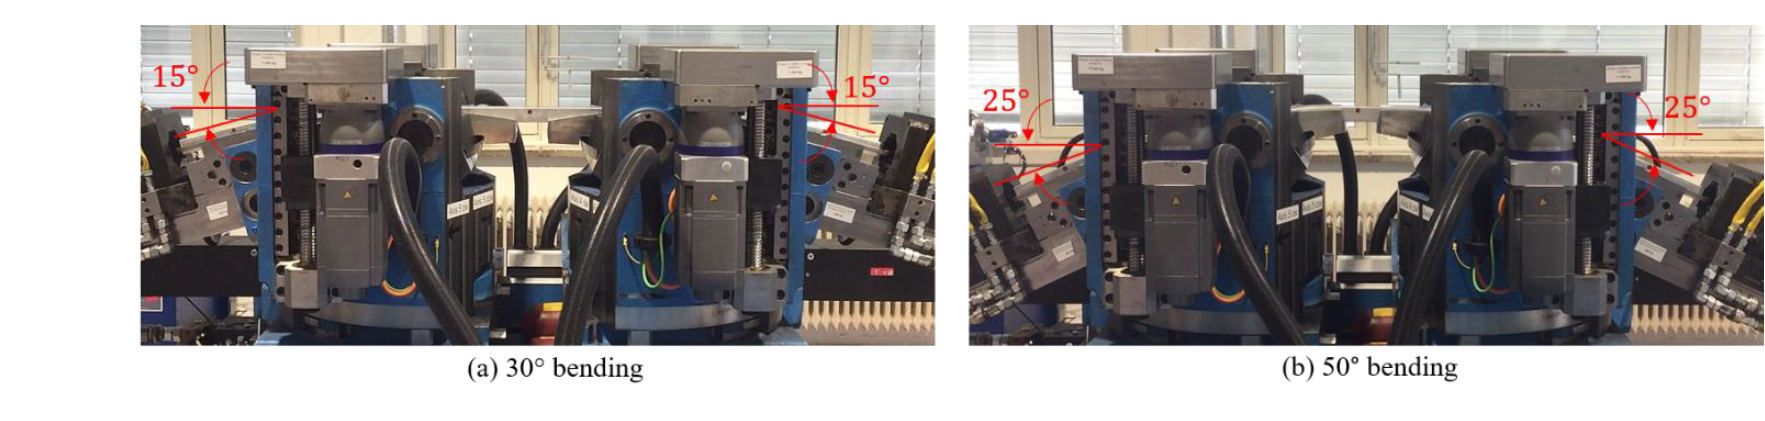
Fig. 10. Bent profiles
Table 2. Measured data after unloading by the computer vision

Table 3. Measured data by manual

Manual springback measurements and the ones by computer vision are compared in Table 4. The reference distances between points 1 and 2, 1604.98 mm for 30° bending and 1582.60 mm for 50° bending, were converted to 1764 mm. The cord heights of 30° bending by the computer vision and manual were 72.70 mm and 74.90 mm, respectively. While the relative difference was 2.77 %, the absolute difference of springback was 2.20 mm. For 50° bending, each chord height obtained by computer vision and manual was 197.98 mm and 196.50 mm, respectively, meaning that the relative difference was 0.71 %. The absolute difference of springback was 1.48 mm, which was less than the difference of 30° bending. According to a dimensional tolerance, the dimensional quality of the difference values, 2.20mm and 1.48mm, is determined. While two samples are hardly justifiable to validate the measurement method, it shows potential of computer vision-based measuring for springback of large profiles.
Table 4. Results of the computer vision and manual measurement

5 Conclusions
In this paper, a computer vision technique was adopted to monitor springback and to overcome the challenge of range of a measuring device for a large profile. Two different bending cases with 30° and 50° angles, were experimentally analysed using AA6062 T-4 hollow profiles of 1,900 mm length. Using a laptop computer and a cell phone camera, springback was monitored during bending process without extra sensors or electronic components attached to the machine. Images obtained by a cell phone were processed by MATLAB, and the acquired images were segmented and filtered. The circular Hough transform (CHT) algorithm was used to search reference points on the profile. With the detected points, springback was evaluated by calculating the Euclidean distance of the sagitta.
The measurement results were validated with the manually measured data. For the 30° and 50° bending, released profile chord heights were 51.78 mm and 156.05 mm. The distance between points 1 and 3 of an image was converted to 1,764 mm of the fixture distance for comparison. The relative springback difference by the computer vision was 2.77 % for 30° bending and 0.71 % for 50° bending compared to the manual measurements. Although the sample size was small, the computer vision technique under operation showed potential to measure springback in large-profile bending.
Sensor-based digital data is one of the essential elements to move forward to Industry 4.0 and digital transformation. The proposed measurement has the advantages of an affordable setup, non-contact sensing, and in-situ monitoring for a large-profile springback. It is expected to increase the performance of the computer vision technique in this study with the several factors, among others, image quality with high resolution, reduction of image distortion, and precise marking of reference points.
Acknowledgements
This work was financially supported by Norwegian University of Science and Technology (NTNU), NTNU Aluminium Product Innovation Center (NAPIC), and the Value project No. 267768 of the Research Council of Norway.
