1 Introduction
In hot rolling of wire rod, bars and other long products in continuous rolling mills, the sectional deviations along a rolled material strand are affected by temperature and size [1]. To ensure a stable rolling process with constant product quality, it is therefore necessary to control the rolling process. It can be observed that there is a coupling between the rolling stand and tools (i.e., the rolls) and the rolled material through the roll force. The roll force is strongly dependent on the deformation in the rolling pass, but in turn affects the roll gap and therefore the height of the rolled material. Different from flat rolling processes, in section rolling the lateral spread plays an important role in the section formation and cannot be neglected. The spread is also influenced by a variation of section height. Therefore, the cross section of the rolled material is distorted in both height and width directions by elastic deformation of the rolling stands and tools. Other important influences are interstand tension stresses which arise in the rolled material between the stand positions. It is well known from rolling theory, that roll force and torque are affected by tension stresses, but there is another direct influence of the interstand tensions on the spreading behavior of the rolling process. Therefore, the whole influence chain described above is affected further by acting interstand tensions.
These effects lead to the circumstance that a control of the rolling process for long products is much more complicated than that of the flat rolling process since the lateral spread must be considered in the analysis. In the joint project PIREF, the metal forming group of University Duisburg-Essen (UDE) collaborated with the measurement technology group of the University of Applied Sciences Ruhr-West (HRW), the control theory group of the University of Siegen (USI) as well as the sensor manufacturing company EMG Automation GmbH (EMG) and the SMS group GmbH. The main task of our work group (UDE) was to provide a process model for the rolling processes to achieve a mathematical description of all important metal forming effects and interdependencies. This process model was later implemented in the control models developed by the USI. To enable process control during rolling, cross-section sensors developed by the HRW were used (so-called QFM sensors) which are suited for an inline use during the rolling process. With help of these sensors, the cross section of the rolled strand could be measured during the rolling process at key positions in the rolling mill layout.
2 Roll gap model including pass geometry
For the process model, it was important to calculate roll force and torque, as well as being able to predict the section shape which is influenced by elastic rolling stand deformation as well as interstand tensions. For the force, torque, and power calculations, we use the rolling model by Lippmann and Mahrenholtz [2]. For the roll force, we can write using the mean section width bm, the contact length ld and the mean flow stress kfm of the considered pass:

The loss factor QF is equal to the reciprocal deformation efficiency and given in the following way with the back tension t0, the related neutral angle βN, the related height reduction εh and the working roll radius R:

It is important that the employed rolling model provides an accurate evaluation of the influence of the back and front tensions t0 and t1 on the roll force and torque. The related neutral angle relative to the bite angle α0 in the rolling process is calculated in the following way:

The total rolling torque for both rolls is given as:

To calculate the spread of a section pass, we make use of Lendl’s equivalent rectangular pass method [3] and the spreading model acc. to Marini as discussed by Mauk and Kopp [4]. The Marini model is also suitable to calculate the internal local spreading contour in each pass. The shapes of the sections and roll grooves are described based on polygonal contours with xy-coordinates of all points. Fig.1 shows a typical pass with a round entry section (blue), a roll contour (black) and the exit section contour (red).
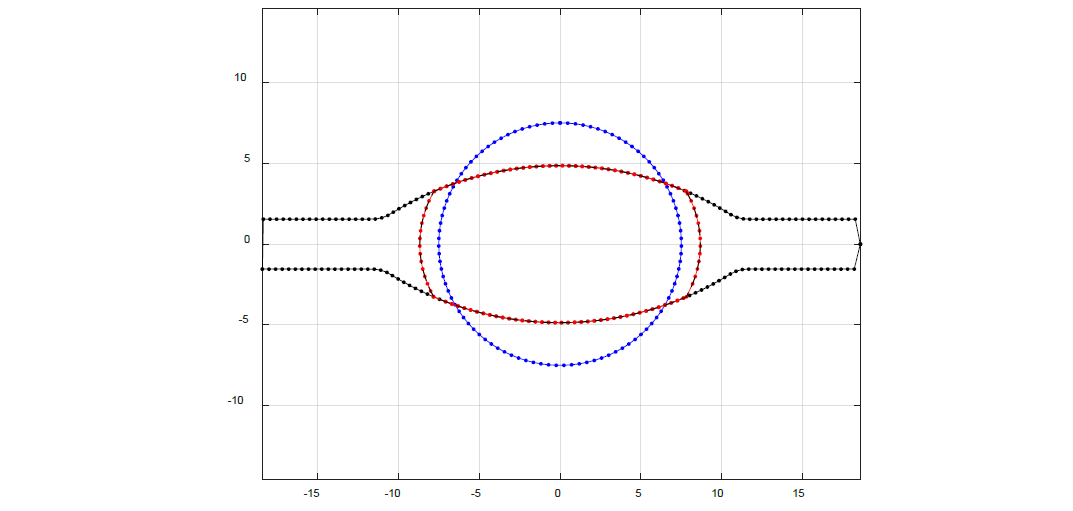
Fig. 1. Exemplified calculation of the pass geometry model for a round-oval pass. Initial diameter: 15 mm. Oval height: 9.8 mm
Here, we can see that a portion of the initial cross section is displaced by the rolls, another portion reappears due to lateral spread, see also [1].
3 Processing of measured cross sections in the model
The QFM cross section sensor as shown in Fig. 2 returns the cross section in mm² at the measurement position. For a precise evaluation, width and height effects must be distinguished from each other, because from an integral cross-sectional variation in mm² we cannot tell if it is due to a height or width fault. These fault types require different methods of counteraction.
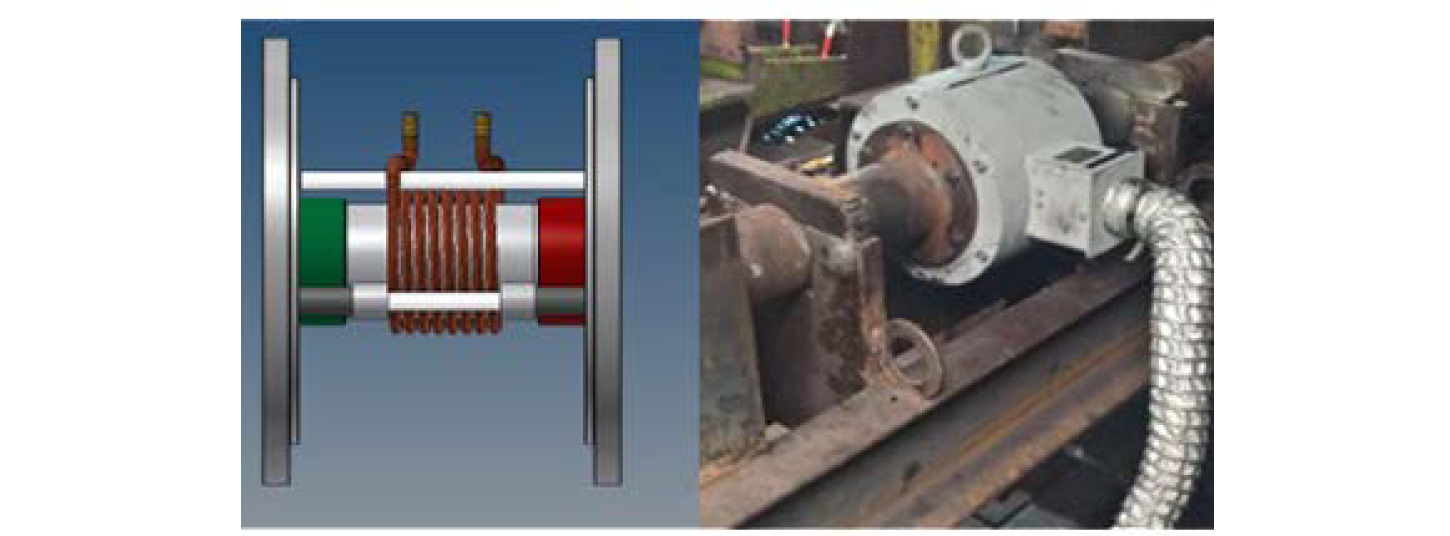
Fig. 2. QFM cross section sensor. Left: schematic drawing, right: in industrial application [5]
We can use the pass geometry model described above to segregate the height effects from the width effects. With help of the model, we can calculate the material cross section for a specific groove geometry as a function of the roll gap screw-down and the section width. A backward analysis of this relationship yields the unknown section width when the cross section and the roll gap were measured. To benefit from this technique, an independent continuous measurement of the roll gap is needed additionally.
The synthetic data generated by the pass geometry model was used to train an artificial neural network which can be used for the backward calculation. Fig. 3 c) shows the interdependency of cross section, roll gap and section width for the oval roll contour shown in Fig. 1, while Figure 3 a) and b) show much different oval section shapes, rolled from the same groove and same entry section, depending on roll gap setting and material and temperature dependent spreading behavior of the rolled material. These section shapes can be concluded from the roll gap and cross section measurements as described above.
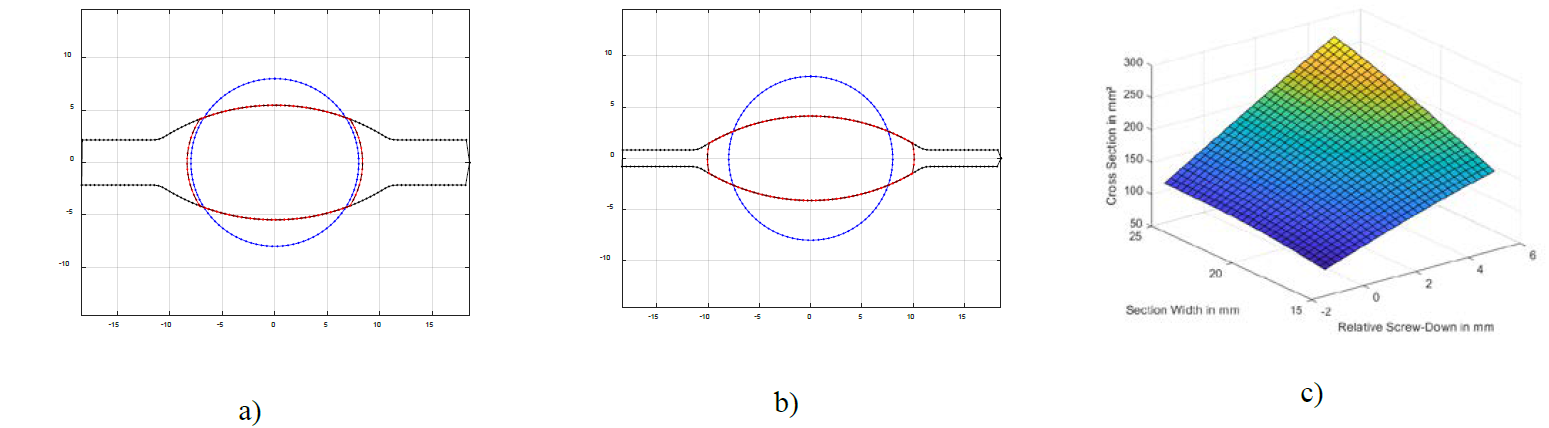
Fig. 3. Different cross sections from the same roll contour. a) wide opened gap, low spread; b) closed gap, higher spread; c) data relationship between roll gap, section width and cross section
The material and temperature dependent spreading behavior of the rolled materials is described with a neural network, based on data of flat rolling trials with different steel materials and a temperature range between 800°C and 1200°C taken from Grosse and Gottwald [6], where the temperature and the chemical composition of the specific steel material were used as input parameters for the neural network.
4 Coupling of roll gaps by interstand tensions
In Fig.4, a three-stand arrangement of a rolling mill is shown exemplarily. The rolls of three subsequent stands rotate at the angular velocities ω1, ω2 and ω3. The backward tension of a stand i will be denoted by t0,i, the front tension of stand i will be denoted by t1,i.
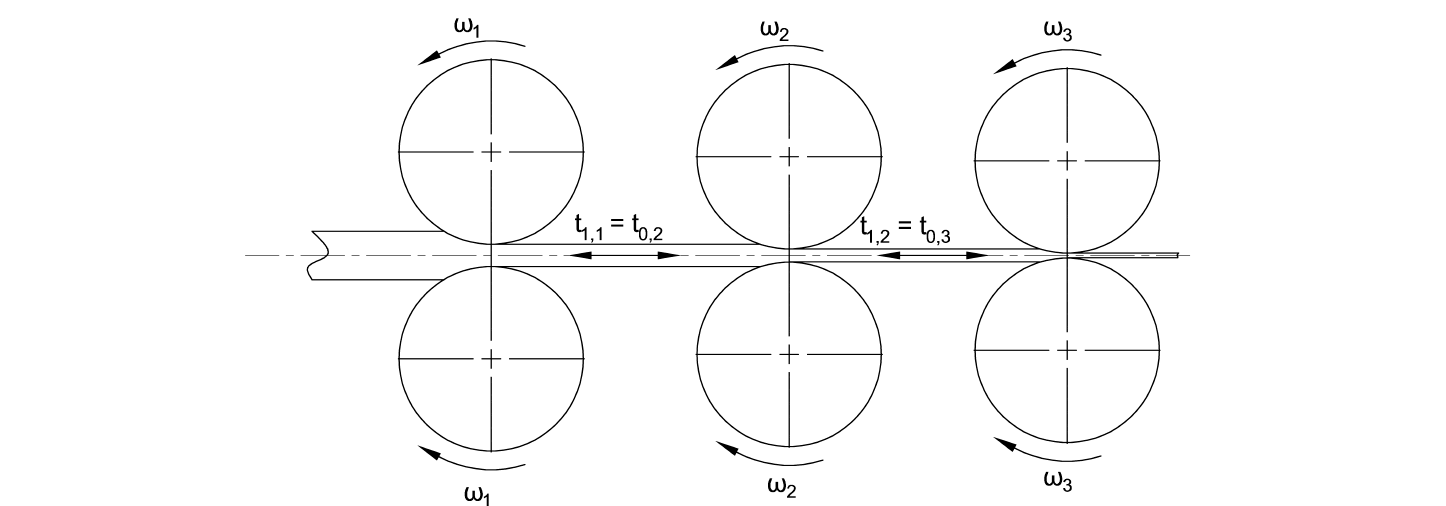
Fig. 4. Schematic representation of three subsequent roll gaps in a continuous rolling mill with angular roll velocities and interstand tensions
Generally, the front tension of stand i is equal to the back tension of stand i+1:

As stated above, the tension influences on roll torque and force can be calculated easily using the rolling model. For the direct tension influence on spread, an additional empirical model must be employed. Mauk provided a framework for the tension influenced additional deformation in 1996 [7], given in Eq. (4.2).

Here, φ0 is the calculated true strain of the pass without tensions. The tension influence term Δφσ is a function of the front and back tension and the geometric properties of the rolling pass. Note that the influence of the back tension is higher than that of the front tension [5].
Being able to assess the interstand tension stresses acting in a rolling process is of great importance for the construction of the underlying metal forming part of the control model, but the tension influences are very nonlinear and influence several stands at the same time. For simpler cases (that is, without a tension-dependent spread), a linearized model for the interstand tension assessment can be constructed with good success, but the linearization breaks down for the highly nonlinear spread influences which are faced in the section rolling case. To enable a backward calculation of the acting interstand tensions from the rolling parameters (i.e., the measured roll and material speeds and section shapes), either a time-consuming iterative procedure must be applied to solve the nonlinear system of multiple coupled roll gaps, or a data driven modeling of the relationship between N roll speeds and (N-1) tensions between the N roll gaps must be carried out. In the present case, the data driven modeling was applied which resulted in a fast model for computation of the present interstand tensions during the rolling process of long products.
Fig. 5 shows a calculated result for this model for a six-stand rolling block in an industrial wire rod mill. On the vertical axes, the interstand tension is shown in relation to the mean flow stress.
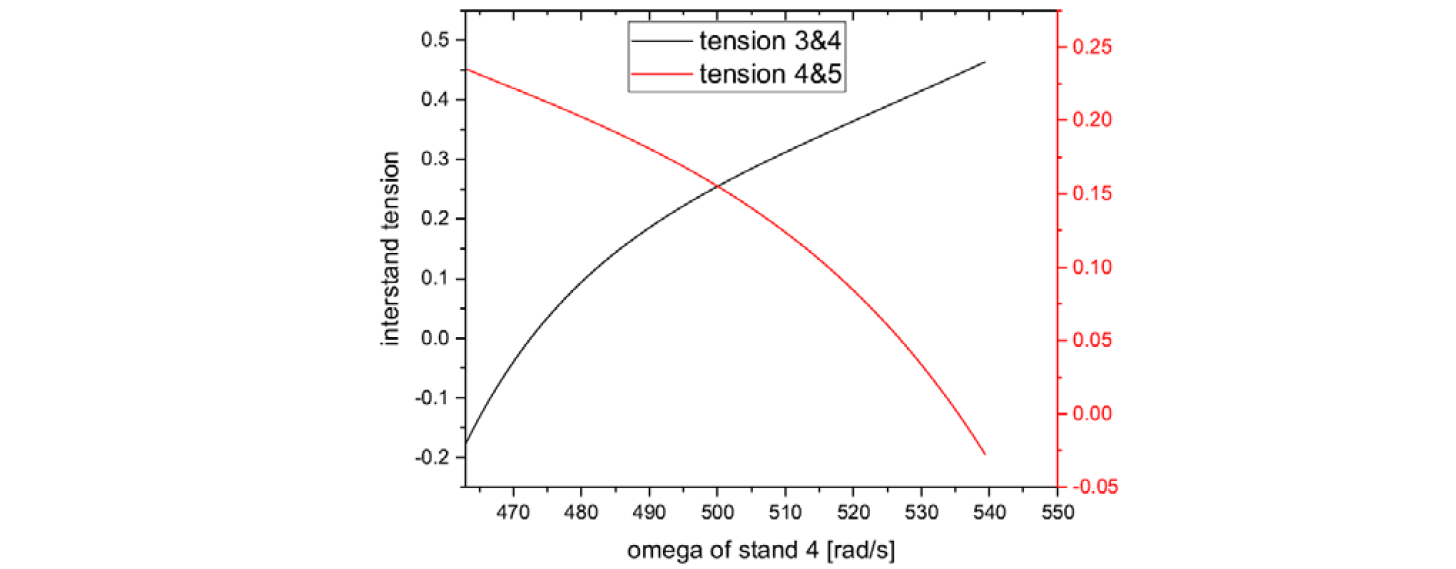
Fig. 5. Reaction of related interstand tensions in a continuous rolling mill to variations of the roll speed of one mill stand [8]
In this computational example, the angular roll velocities of stands 3 and 5 remain constant, where the roll velocity of stand 4 is varied. We see from these results, that the back tension of stand 4 (or tension between stands 3 and 4) increases when the roll speed of stand 4 is increased. At the same time, the front tension of stand 4 (or tension between stands 4 and 5) decreases with increasing roll speed. This data already accounts for the spread-reducing effect of the tensions and the influence of the tensions on the global volume flux of the rolling process.
The indirect measurement of acting interstand tension stresses is one important task of the control model, and this aim can be reached with a combination of analytical and data-driven modeling as described above. Another task is the prediction of variations in the rolling parameters that need to be realized to achieve variations in the interstand tension (to increase or decrease the tension). This is especially important for the present task of controlling the rolling process.
We have seen that lateral spread can be influenced effectively by means of the interstand tension. If too much spread is reported by the QFM sensor, we should increase tension temporarily to decrease the width of the rolled section. Tension can be increased or decreased by influencing the velocity mismatch between two subsequent mill stands. The necessary roll speed variation can be calculated by the present model. Fig. 6 shows two examples with predicted section shapes.
The dashed lines in Fig. 6 correspond to the case without tensions and without elastic rolling stand deformation. In the solid lines, elastic rolling stand deformation is considered along with a uniform interstand tension of 20% of the material’s flow stress between each two subsequent rolling stands. In Fig. 6 a), the oval pass is shown, and Fig. 6 b) the next pass oval to round. The section evolution is interconnected between the two passes, because the varied section height from the oval pass serves as the initial width for the round pass. On the other hand, the exit width of the oval pass is the entry height for the round pass.
The elastic rolling stand deformation does not lead to a huge increase of section height, and we also should keep in mind that the rolling force is reduced by the tension, leading to a lower elastic feedback of the roll gap. In contrast to this, the tension influence on the spread is obvious. In both passes, oval and round, the spread is reduced quite extensively due to the 20% of interstand tensions. Because of this strong influence, interstand tensions can be used effectively to counteract an overspreading of the sections.
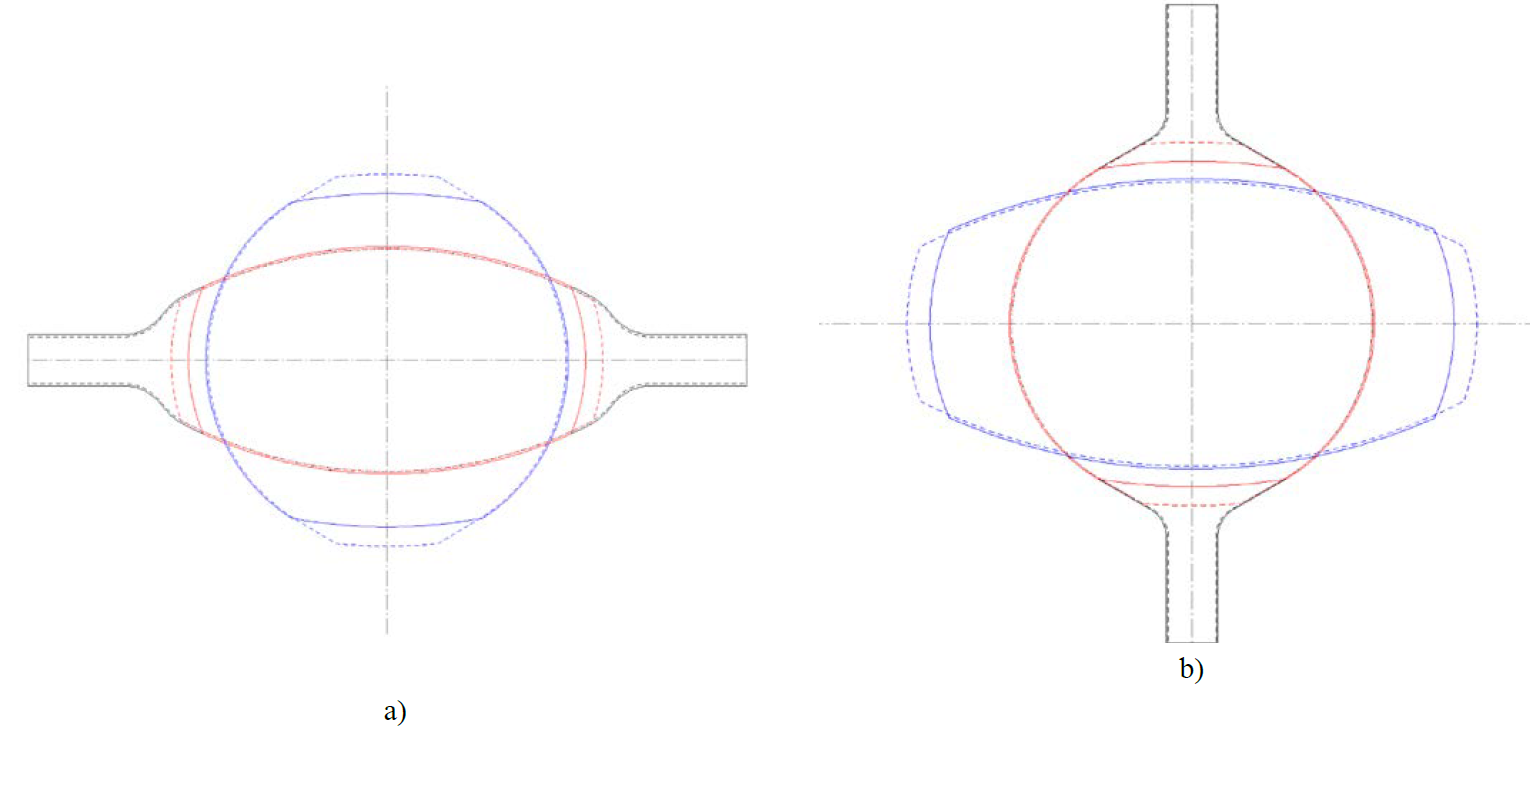
Fig. 6. Influencing method of the section shape by means of interstand tensions. Solid lines: with elastic stand deformation and interstand tensions. Dashed lines: with rigid stands and the tension-free case.
5 Rolling trials, neutral angle and friction assessment
At the metal forming lab at the UDE, rolling trials were conducted to validate the model and to examine the velocity and material flow pattern of the rolling process. For this purpose, a pass design was worked out for an initial round section of 15 mm as shown in Fig. 7.
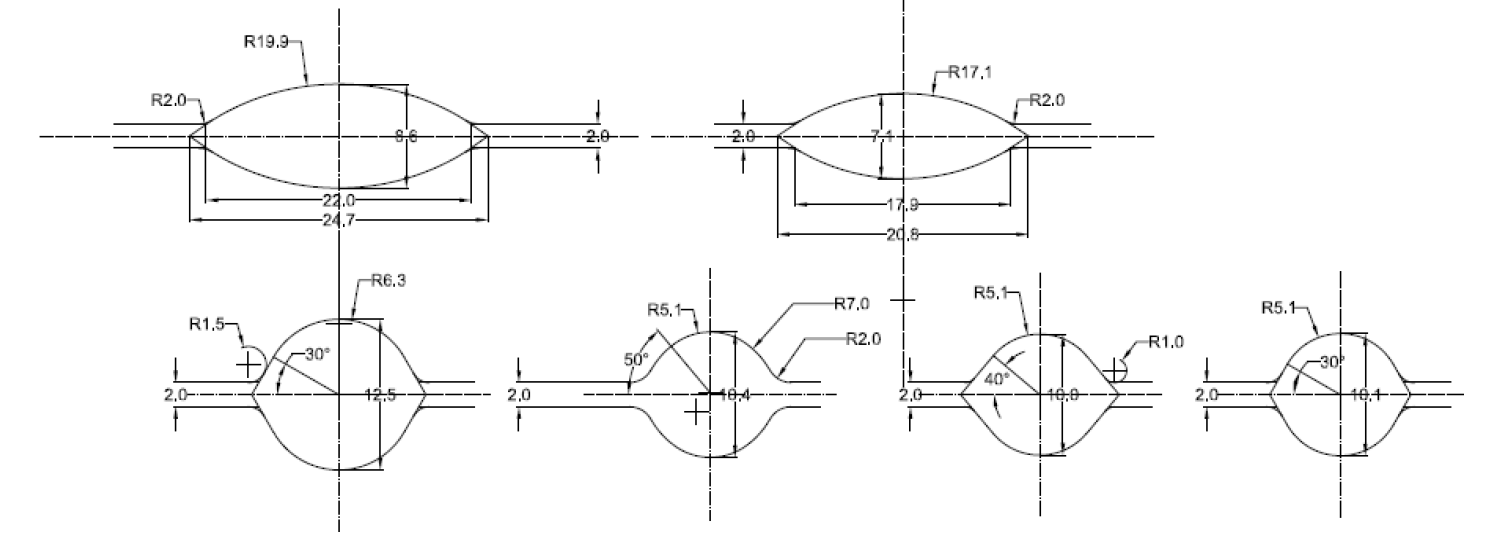
Fig. 7. Roll pass design that was worked out for the laboratory rolling mill
The 15 mm round entry section would be deformed in two passes to an intermediate round section of 12.5 mm, and in two further passes into a finishing round section of 10 mm. Figure 8 a) and b) show the laboratory rolling mill used for the trials. It is equipped with measurement sensors for entry and exit temperature, velocity, angular roll speed, as well as exit section height and width. The rolls with the pass design shown in Figure 7 have a nominal diameter (at the roll gap) of 208 mm.
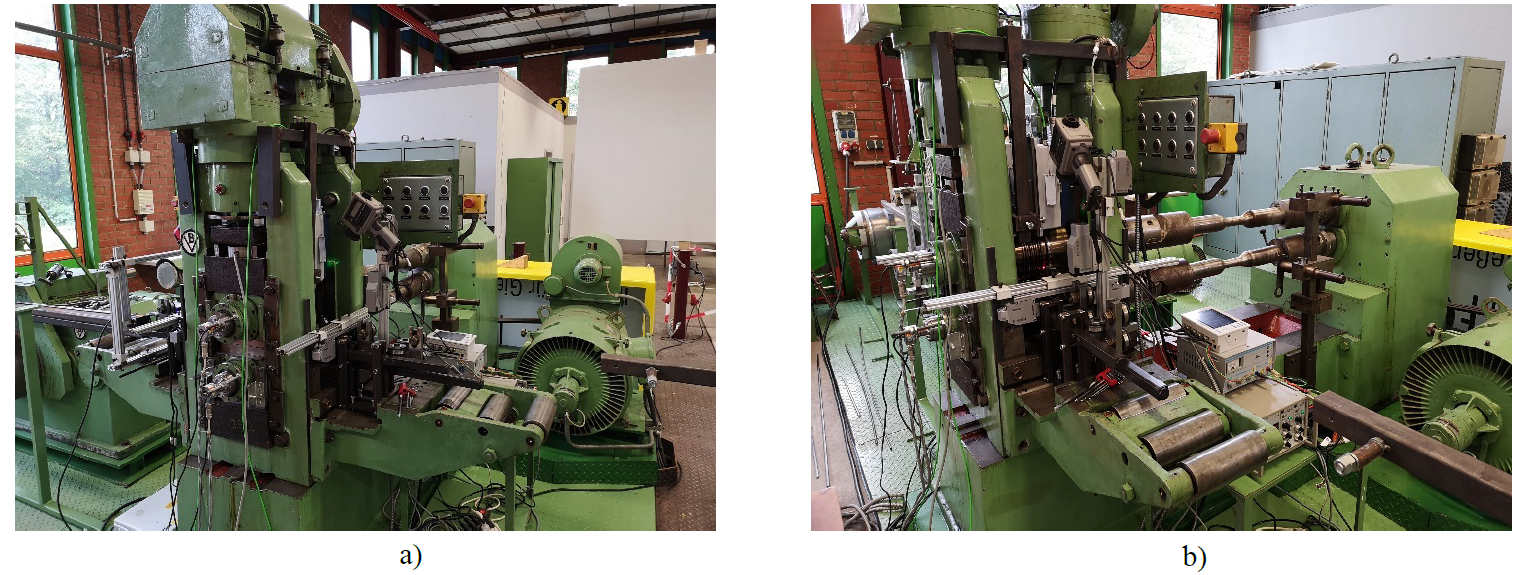
Fig. 8. Laboratory rolling mill at the metal forming lab of the UDE. a) operator side view; b) entry side view
During the passes, roll force, torque as well as the exit and entry velocities of the rolled bar were measured. Comparisons between calculated and measured roll forces were carried out randomly, giving results in close agreement.
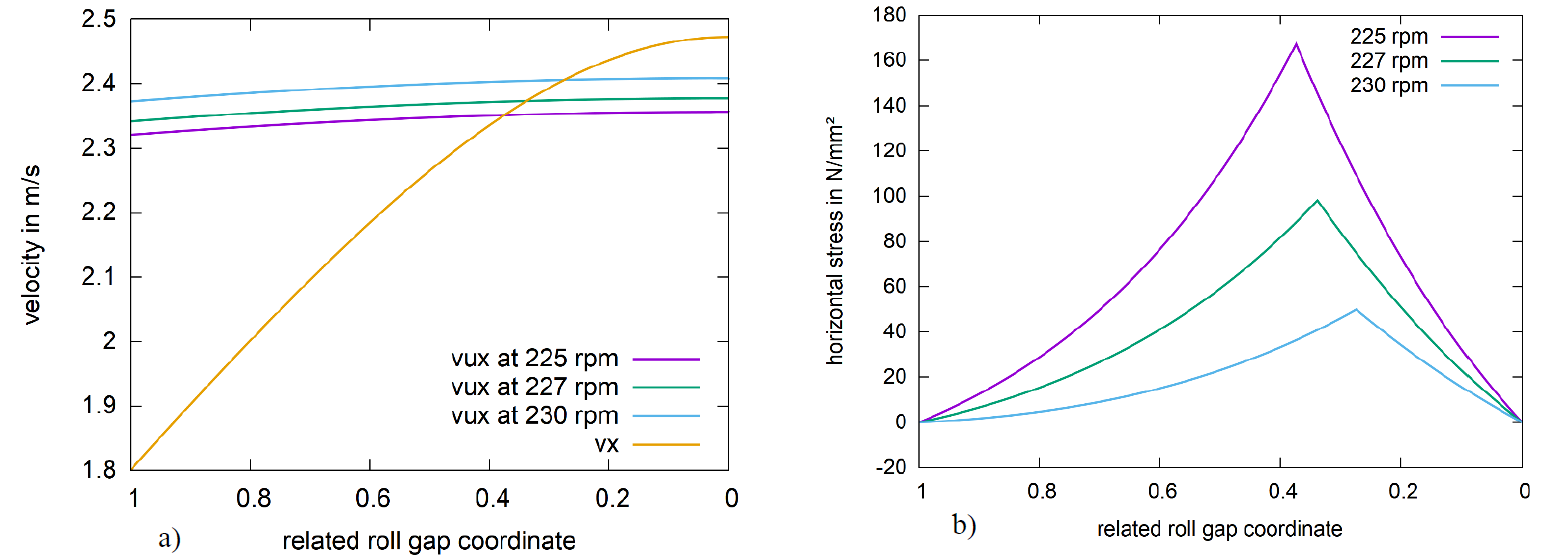
Fig. 9. a) Velocity distribution and b) Stress distribution for different roll velocities at a constant volume flux
Based on model adaption with the assumed local spread calculation, internal distributions of relative velocity were calculated. With this approach, the neutral point position could be found from the measured forward slip of the rolling process. Additionally, by adaption with a numerical rolling model it was possible to determine the coefficient of friction. Figure 9 a) shows the horizontal material velocity distribution vx in the roll gap for an exemplified flat pass (yellow line). The horizontal roll surface velocities vux are shown for three different rotational speeds of the rolls. We can see that the intersection point of these curves with the vx-curve are different for each roll velocity, therefore yielding different neutral angles. A numerical evaluation of the neutral angle based on the graphical method shown in Fig. 9 would be to solve the nonlinear volume flux equation:

For a successful numerical evaluation of αN, the cross-sectional variation throughout the contact arc A(α) must be known.
The circumferential roll velocity vR, as well as the exit section A1 and the exit velocity v1 are measured.
In the present model, the function A(α) is constructed by applying the spread calculation locally in the roll gap.
In Figure 9 b), the associated horizontal stress distributions are represented. As there is a unique relationship between the coefficient of friction and the neutral point, we can identify the coefficient of friction from the forward slip measurement through adaption with the rolling model. Apparently, a more sophisticated rolling model must be used not relying on constant sticking friction throughout the roll gap. The latter simplification is present in all simple analytical hot rolling models [2]. We can use the nonsimplified version of Alexander’s rolling model [9], which accounts for both sticking and slipping friction. The ODE for the normal pressure in the roll gap is given as:


For the definition of the functions f1, f2 and g, refer to Alexander [9].
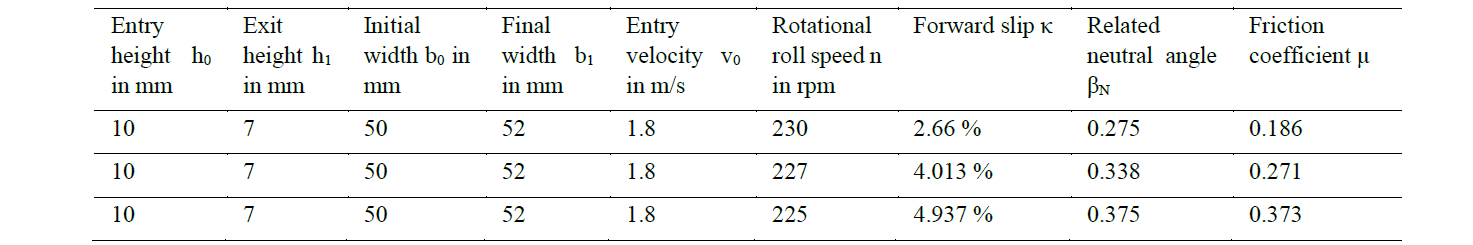
Table 1 shows a summary of the data of the considered roll passes. For these data, the related neutral angles were found numerically according to Eq. (5.1) and attained values between 0.275 and 0.375, which are just typical data for hot rolling. The friction coefficient range between 0.186 and 0.373 for the considered pass data.
Table 1. Evaluation data of the roll passes shown in Fig. 9
While Fig. 9 gives a general example for the process of friction measurement in a flat pass, we now present an example for actual measurements of forward slip and friction at a hot rolling round-oval pass. Fig. 10 shows the actual pass geometry for a rolled oval section, while Table 2 gives an overview about the data that where measured and determined for this pass.
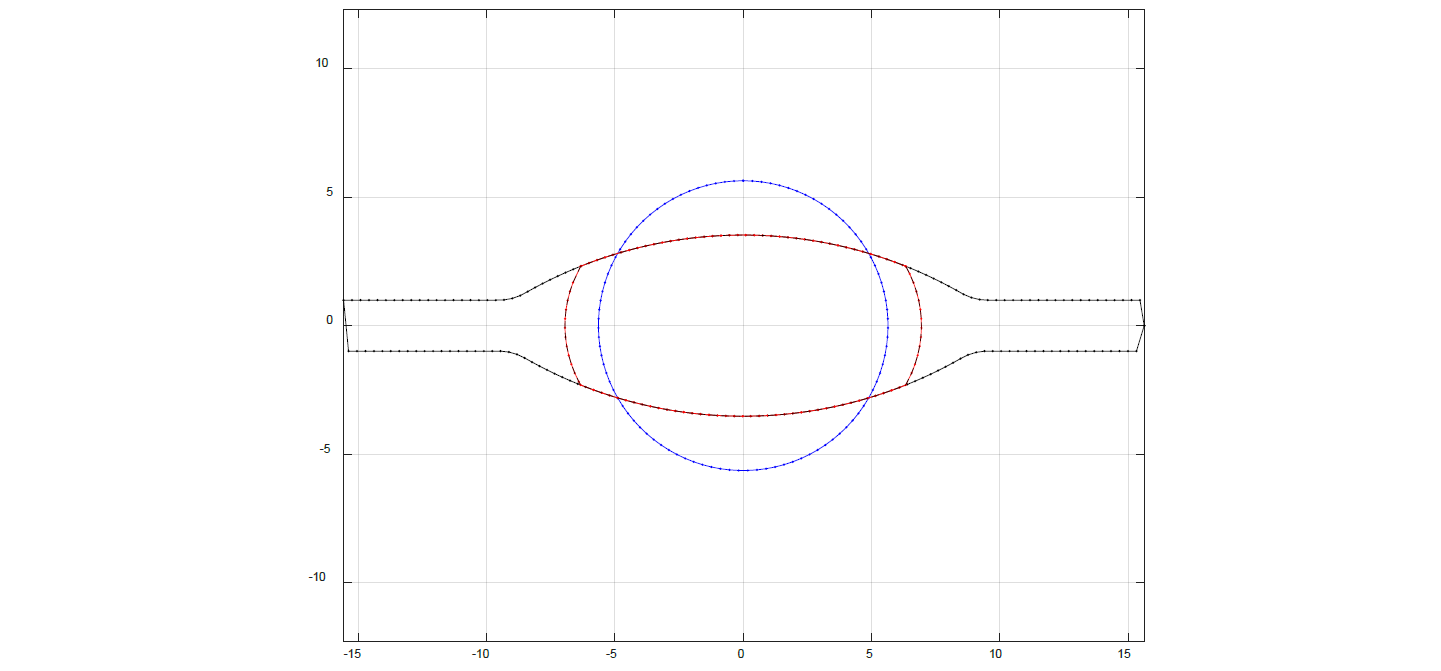
Fig. 10. Actual pass geometry of the section for which the friction evaluation was carried out. Data see Table 1.
Table 2. Exemplarily measured data in a round-oval pass

From the measured entry and exit velocities as well as the roll velocity, a forward slip value of 3.07% was calculated. This provided a related neutral angle of βN = 0.3104. The numerical adaption of Alexander’s rolling model resulted in a forward slip-equivalent friction coefficient of µ = 0.252. This value is relatively low for a hot rolling case, which we attribute to the clean laboratory environment with freshly grinded rolls under which the trial was undertaken.
The friction assessment by means of forward slip measurements was reported before for flat rolling [10], but the present approach seems to be the first successful friction measurement under hot rolling conditions of a non-flat cross section with extra difficulties due the non-negligible lateral spread.
6 Conclusions and Outlook
In the research project PIREF, we were able to develop a model for hot rolling of full sections which can be used in a control model for the rolling process. We presented a method that allows the actual section shape to be deduced from measured cross section and roll gap screw down. This allows the cross-sectional variations to be decomposed in height and width affecting parameters and therefore the initiation of suitable counteracting measures. The theoretical basis was built for an active tension control in rolling of full sections. This is accomplished by an online enforcement of the interstand tensions by continuous measurement of roll and material velocities. As some of the sub models are too sophisticated to be evaluated online in a numerical way, they were cast into data-driven models using machine learning techniques with synthetic data. A method for online-evaluation of the coefficient of friction was presented with a specific application to full section rolling. In the future, the validity range of the model shall be extended. For this purpose, more rolling trials must be carried out to gather data to be fed into the empirical data-driven model for the interstand tension influence on spread, which is a central feature of the current model. In the foreseeable future, the overall control model should be implemented in an industrial rolling mill for a test run.
Acknowledgements
We thank the European Regional Development Fund for providing funding of the research project PIREF under project code EFRE0800805. Special thanks are owed to our project partners representing the University of Siegen, the University of Applied Sciences Ruhr-West, the EMG Automation GmbH and the SMS group GmbH for the fruitful discussions which led to the developments presented in this paper.
Most special thanks are owed to our late Professor Dr.-Ing. Paul Josef Mauk for all metal forming advice and good education he has provided, as well as for the initiation of this research project. He will never be forgotten.
