1 Introduction
Light materials are increasingly used in automotive industry to satisfy the growing demand for higher fuel efficiency and lower environmental impact. Especially, aluminum alloys are widely used in modern lightweight car concepts due to their good strength-to-weight ratio. However, when compared with steels, their formability at room temperature is much lower. Warm forming has been used as a solution to improve the formability.
It is well known that the stress state is one of the most important factors affecting the formability of metals. The stress state is mainly characterized in terms of the stress triaxiality and the Lode parameter. Bao and Wierzbicki [1] evidenced, via a series of tests on 2024-T351 aluminum alloy, the strong influence of the stress triaxiality on the ductility. Gao et al [2] showed the strong stress state effects on the plastic response and the ductile fracture behavior. Zhang et al [3] found that besides stress triaxiality the Lode parameter related to the third invariant of the deviatoric stress tensor has also an influence on the ductile fracture of metallic materials. They claimed that the use of the Lode parameter, with stress triaxiality, gives a complete description of the stress state.
Besides stress state, temperature and strain rate are major factor affecting the formability of metals. Shehata et al [4] investigated the formability of aluminum/magnesium alloys at temperatures from 20 to 300°C, for several strain rates, in both uniaxial and biaxial tension. They showed that, in the biaxial tension deformation mode, the material is less sensitive to temperature and strain rate than in uniaxial tension. Li and Ghosh [5] investigated the formability of three automotive aluminum sheet alloys (AA5757, AA5182 and AA6111-T4) in the temperature range 200-350°C using biaxial warm forming test. It was found that all tested alloys exhibit a significant improvement of their formability. Moreover, the strain hardened alloys AA5757 and AA5182 show considerably greater improvement than the precipitation hardened alloy AA6111-T4. Mahabunphachai and Koç [6] investigated the formability of AA5052 and AA6061 sheets at different temperatures and strain rates through tensile and bulge tests. It was found that the formability increases with temperature and decreases with strain rate. Similar observations are made by Chu et al [7] for AA5086 using a Marciniak test setup.
However, the above-mentioned studies mostly refer to a stress state range between uniaxial and biaxial tension, whereas the extension to a wider stress state range including shear is scarcely reported. Recently, Wang et al [8] investigated the ductile fracture of AZ31 magnesium alloy sheets as a function of the temperature from shear to biaxial tension. Similarly, the objective of the current research paper is to determine the fracture locus of AA6061-T6 alloy at an elevated temperature and for a wide stress state range (i.e triaxiality in the range [0 - 0.6] and Lode parameter in the range [-1 - 0]). To this regard, an experimental campaign is carried out including uniaxial tensile tests on dog-bone shaped specimen, notched specimens with different radius, specimens with a central hole and shear specimens at 200°C. The hybrid experimental-numerical approach [9] is used to measure the fracture strain and record the stress state evolutions during test. However, this method needs both an accurate modeling of the material behavior until fracture and a reliable numerical analysis. To this end, the positive strain rate sensitivity of the flow stress at elevated temperature is taken into account in the modeling and attention is paid to accurately constrain the FE model by using the real experimental boundary conditions.
2 Method
2.1 Material and specimen types
AA6061-T6 aluminum alloy which is widely used for structural components in the automotive industry is selected for this study. Dog-bone specimen are designed according to ISO 6892-1 standard to conduct monotonic tensile test. Four types of specimens illustrated in Fig.1 are also designed to obtain different stress states. All specimens are cut from the same 1 mm aluminum sheet using CNC waterjet cutting machine. To investigate the anisotropy in tensile test, dog-bone specimens are prepared in the rolling direction (RD) as well as in 45°/RD and 90°/RD. Ductile fracture specimens are only extracted along RD. Three samples are prepared for each specimen type and direction.
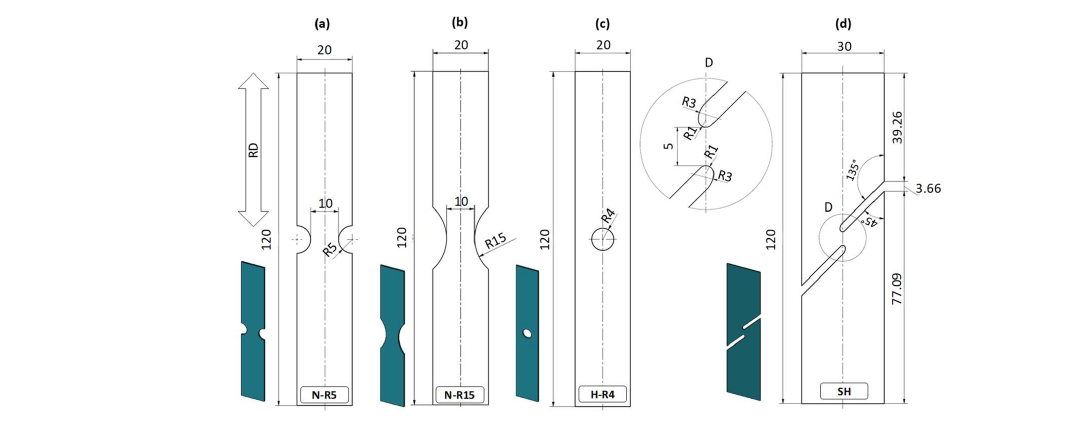
Fig. 1. Geometry and dimensions (in mm) of ductile fracture specimens: (a) notched specimen with R = 5 mm (b) notched specimen with R = 15 mm (c) specimen with a central hole (d) shear specimen.
2.2 Tensile and fracture tests at elevated temperature
The tensile and fracture tests are carried out on an INSTRON 5969 universal testing machine. The load is measured by a load cell of 50 kN capacity. Tensile tests are conducted under extensometer-based strain control at a constant strain rate of 10-3 s-1. To this end, an extensometer with a 25 mm gauge length is used. Fracture tests are also conducted in such a way to obtain the same strain rate employed for the tensile test. Since the deformation is no longer homogenous, the tests are carried out under displacement control at a constant crosshead velocity, which is set to obtain an average strain rate of 10-3 s-1. Speckles are spray-painted on the surface of the specimen. Two high speed cameras equipped with 50 mm lenses are used to monitor the specimen deformation during the test and the 3D Digital Image Correlation (DIC) Aramis system measures the strain field evolution. To record the local displacement u in fracture tests, five virtual extensometers with a gauge length of 15 mm are defined at different positions of the gauge area of specimen as shown in Fig.2. The local displacement u corresponds to the average of the displacements recorded by the five virtual extensometers.
A classical furnace (Matair) is used to heat up the specimen to the testing temperature of 200°C. The temperature is controlled by two thermocouples attached at the center of the specimen and the grip of the tensile machine respectively. To insure a homogenous temperature on the specimen during test, the tensile load is applied when the temperature recorded by both thermocouples reaches the testing temperature within ±2°C. Two tests among three are selected for each specimen geometry for post-processing.
2.3 FE models
3D FE models are built for each ductile fracture test using Abaqus/Standard. A full model of the specimen is defined to account for all possible displacements of specimen during the test. Specimen is meshed using 3D solid hexahedral elements with reduced integration (C3D8R). A fine mesh size is applied in the central zone while a larger one is used away from this zone. A mesh size of 0.1 mm is applied to the fine mesh area on the basis of a mesh sensitivity study showing that the effect of mesh size becomes insignificant when it is smaller that this value. All the models have 8 elements through the thickness. Non-zero displacement (Ux, Uy and Uz) are imposed on the lower and upper sides of specimen as shown in Fig.2. The imposed displacement values are obtained from the displacement field recorded by Aramis on the specimen surface. Such a procedure leads to a more realistic model reproducing as much as possible the experimental conditions [10].
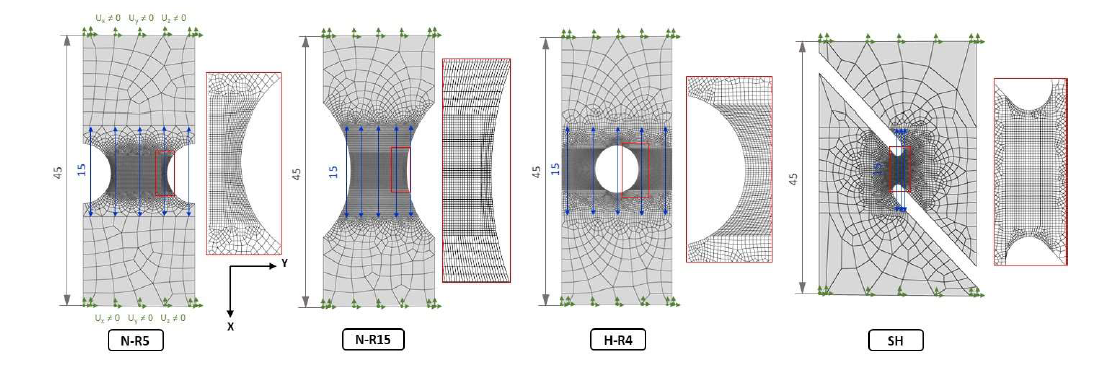
Fig. 2. Meshes and boundary conditions used for the four ductile fracture tests. The blue dimension lines highlight the position of the virtual extensometers with gauge length of 15 mm used for local displacement measurement.
Isotropic hardening coupled with Hill48 yield criterion is chosen to model the mechanical behavior. The Hill 48 quadratic yield function is given by:

where 𝜎̅ is the Hill48 equivalent stress that is defined as follow, from the components of the Cauchy stress tenor:

The Hill’s coefficients (F, G, H, L, M and N) are related to the plastic anisotropy ratios (r0, r45 and r90) which are the ratios of the width to thickness incremental plastic strain during a tensile test at 0, 45 and 90° to the rolling direction, respectively:

Due to the lack of available data regarding the mechanical behavior in the thickness of the sheet, L and M are kept equal to their isotropic value (i.e L = M = 1.5).
σy(𝜀̅𝑃) denotes the isotropic hardening function that is chosen with a saturation form of Hockett-Sherby. At warm temperatures, the strain rate influences the hardening curve. This strain rate dependency is commonly introduced as a power law, e.g. [11,12]. Thus, the yield stress 𝜎Y evolves with strain rate ε̇ as follow:

where 𝜀̅P is the equivalent plastic strain, σ0 the initial yield stress, 𝑄 represents the maximum change in the size of the yield surface, b defines the growth rate of the yield surface, n is the strain hardening coefficient, ε̇0 is a constant strain rate normalization factor and m is the strain rate sensitivity coefficient.
3 Results
3.1 Stress-strain curve and identification of mechanical behavior parameters
Fig.3 shows the Cauchy stress-logarithmic strain curves obtained in uniaxial tension with dog-bone specimen at 200°C. The Cauchy stress is calculated by the ratio of the load over the current section of the sample before necking. The logarithmic strain is measured by the DIC software. There is no significant difference in stress-strain curves along different loading directions indicating isotropic properties with respect to strength and strain hardening.
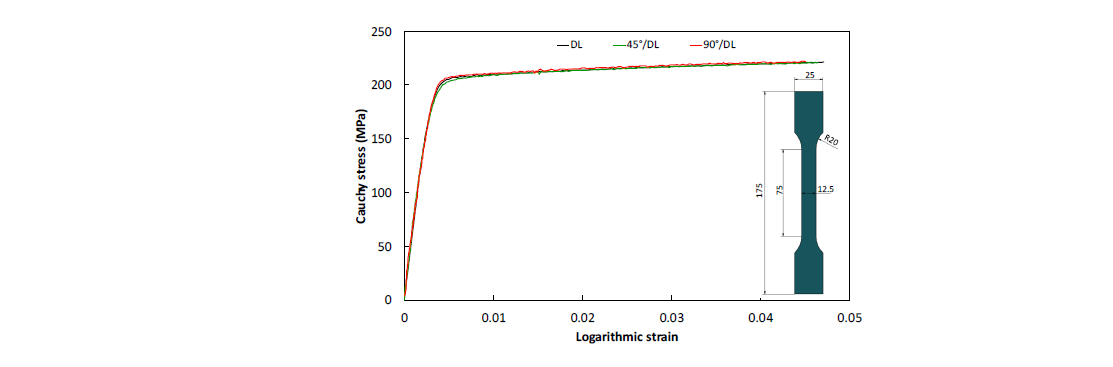
Fig. 3. Cauchy stress-logarithmic strain curves in uniaxial tension at ε̇ = 10-3 s-1 and 200°C obtained with dog-bone specimen up to the point of necking at 0°, 45° and 90° to the RD. Sample dimensions are given in mm.
The mechanical properties of the material at 200°C are given in Tab.1. The plastic anisotropy coefficients are determined by linear interpolation of the evolution of the plastic transverse strain versus the plastic thickness strain. The plastic transverse strain is measured by Aramis and the plastic thickness strain is determined using the incompressibility condition. It is found that the value of the normal anisotropy coefficient is significantly different from 1, which indicates that the metal exhibits moderate anisotropy in plastic flow.
Table 1. Mechanical properties and anisotropy coefficients of AA6061-T6 at 200°C. 𝑟̅ represents the normal anisotropy and Δr the planar anisotropy

Due to the very weak dependence of the stress-strain curve to the loading direction and the low value of Δr, transverse isotropy is assumed and the values of Hill48 coefficients, calculated according to Eq.3 and considering only 𝑟̅, are reported in Tab.2
Table 2. Hill’s coefficients at 200°C

The hardening law parameters (i.e. 𝜎0, 𝑄, 𝑏, 𝑛, 𝜀̇0, 𝑚) are identified by manually adjusting the parameters while visually inspecting the agreement between the experimental and predicted results. Indeed, the hardening parameters are continually adjusted until the numerical and experimental load-displacement curves obtained with all fracture specimens show good agreement. The optimal set of parameters is given in Tab.3. Fig.4 shows the hardening curves obtained at different strain rates using the identified parameters and the hardening curve determined experimentally by the tensile test. It is clearly seen that the calibrated Hockett-Sherby equation can also well fit the true stress-strain curve obtained from uniaxial tension at 𝜀̇ = 10-3 s-1.

Table 3. Hardening law parameters at 200°C
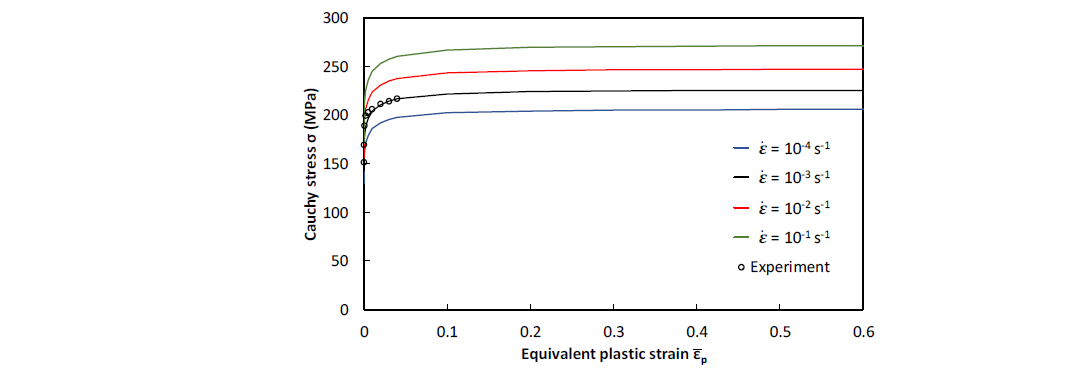
Fig. 4. Stress-strain curves obtained by the modified Hockett-Sherby model for different strain rate. Black circles represent experimental points obtained from uniaxial tension of dog-bone specimen at 𝜀̇ = 10-3 s-1.
Fig. 5 shows the numerical and experimental load-local displacement curves. Only one test per configuration is plotted. Since these curves are used for the calibration, a good agreement is observed between numerical and experimental results. A similar force level is observed for notched specimen N-R5 and N-R15 and the specimen with a central hole H-R4 while a lower force level is observed for the shear specimen. Though the comparison between tension and shear stress levels may depend on the anisotropic yield criterion, it is observed that this choice associated to Hill48 yield criterion with strain rate dependent hardening law gives a good description of the fracture test load level. Fig.5 also shows the numerical and experimental evolution of the average major strain on the surface of the critical zone where the fracture is likely to occur for each specimen. Experimental results are not plotted until fracture because the speckles spray-painted on the surface of the specimen peeled off due to the high temperature and the large deformation prior to fracture, thus making impossible the DIC computation. It can be seen that the numerical results fit well the experimental ones.
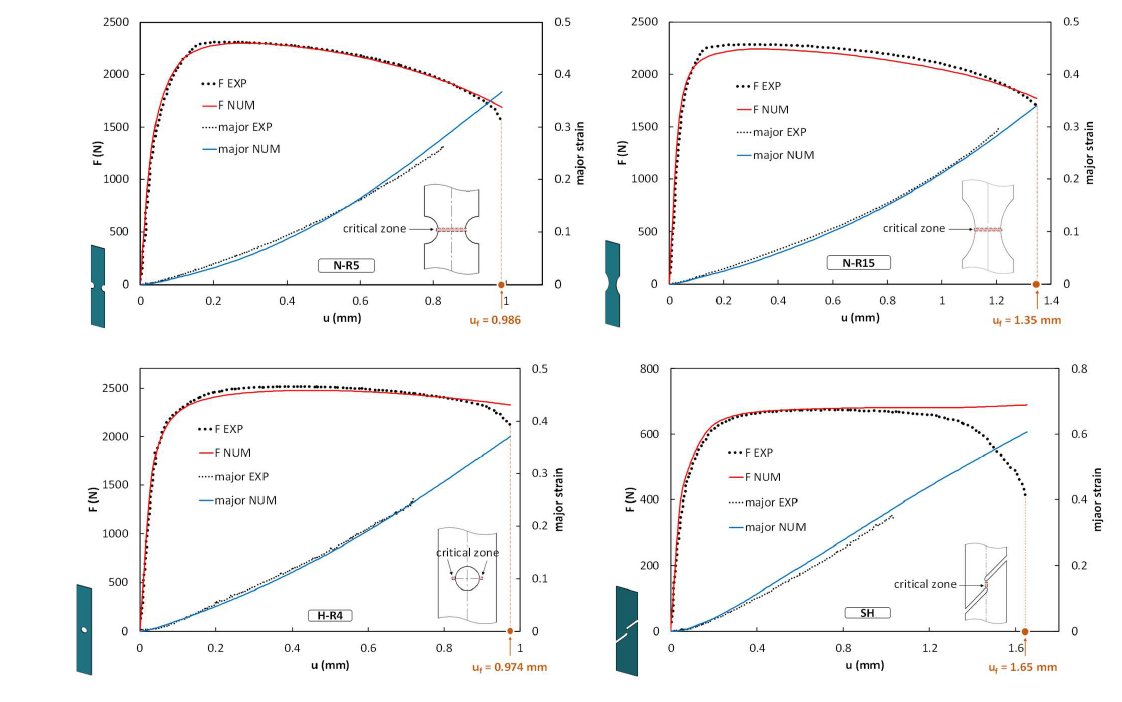
Fig. 5. Load-local displacement curves and the evolution of average major strain at the critical zone where fracture initiates: comparison between numerical and experimental results. Experimental major strain evolution is not plotted until fracture due to the speckle loss at large deformation.
3.2 Fracture strain and stress state parameters
To determine the fracture strain ε̅f, it is assumed that the fracture initiates in the element with the highest equivalent plastic strain at the displacement at fracture uf, which is taken as the fracture strain. The fracture stroke uf is determined at the instant of the sudden drop in the measured load-displacement curve as shown in Fig.5. For shear specimen, since it is difficult to pinpoint the onset of fracture in this way, a novel method that makes use of the load first derivative is adopted [8]. In this case the fracture stroke is identified at the minimum of this curve as shown in Fig.6.
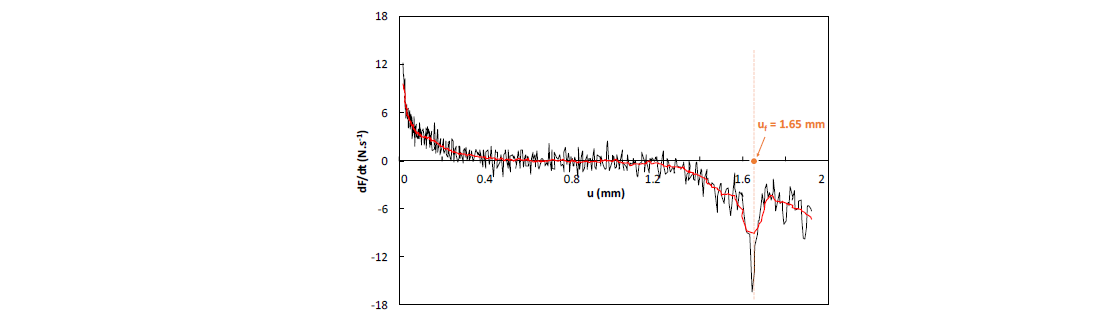
Fig. 6. Original (in black) and smoothed (in red) load first derivative curves of the shear specimen.
Fig.7 shows the location of the element presenting the maximum equivalent plastic strain at uf (critical element). The critical element is located within the thickness for N-R5, N-R15 and H-R4. In the case of shear specimen, due to edge effects, the maximum equivalent plastic strain at uf is found at the edge rather than at the center. Therefore, the equivalent plastic strain at the center of the shear gauge is chosen as the fracture strain, as an underestimation of the rupture strain in shear.
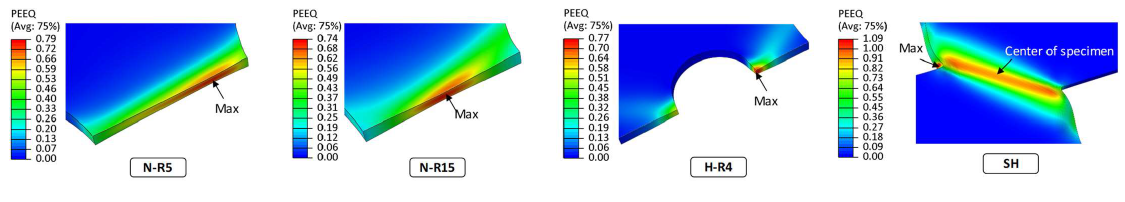
Fig. 7. Contour plot of the equivalent plastic strain at the instant of the onset of fracture in the critical zone for different ductile fracture tests.
Fig.8 shows the evolution of the stress triaxiality η and Lode parameter L extracted at the critical element from the numerical simulations. Although specimens are designed to achieve a constant stress state, it is found that stress triaxiality and Lode parameter evolve from the beginning of the test. This variation is due to the strain localization that occurs quickly for this material. At the point of fracture, η and L deviate rather significantly from the initial values, especially for notched specimens, as the specimens exhibit a large deformation in the necking zone. Therefore, to assign a specific stress state to each fracture test, the average of stress triaxiality and Lode parameter are calculated by the following relations:

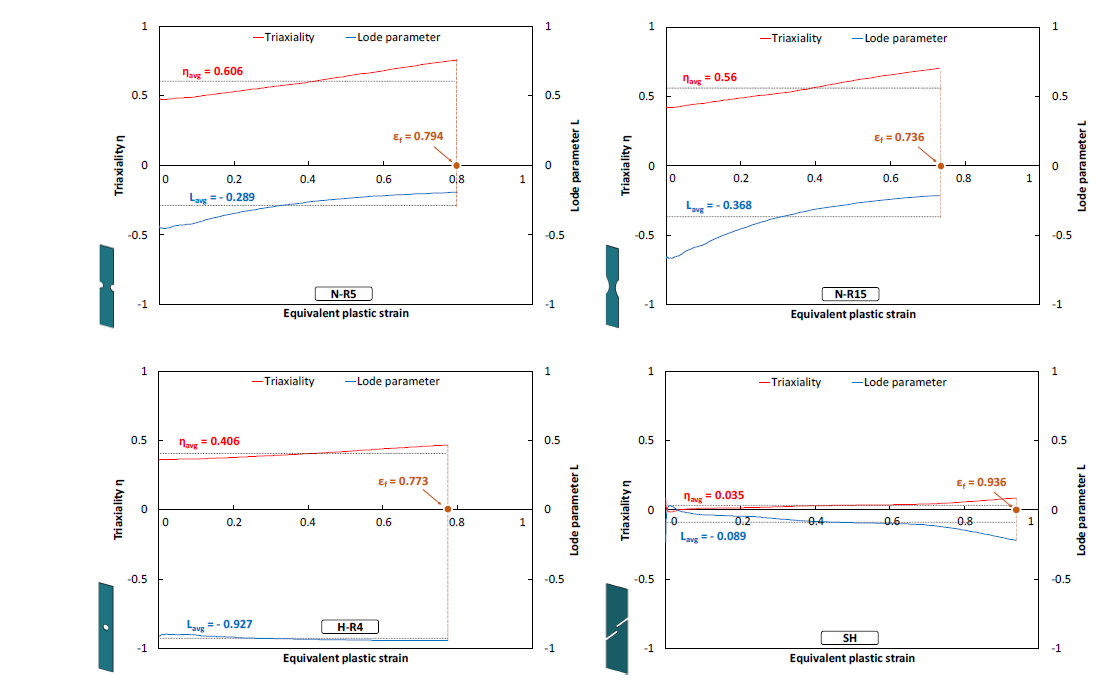
Fig. 8. Evolution of stress triaxiality and Lode parameter at the critical element corresponding to the element presenting the maximum equivalent plastic strain at uf for N-R5, N-R15 and H-R4 specimens and selected at the center of the shear gauge for SH specimen.
The values of ε̅f, ηavg and Lavg obtained from two tests for each specimen are listed in Tab.4. The shear specimen shows the highest fracture strain of about 0.903±0.033 while the notched specimen N-R15 shows the lowest ductility with a fracture strain value of about 0.739±0.003. This result indicates that the fracture strain is highly influenced by the stress state, as the difference between the highest and lowest values is found about 20 %.
Table 4. Fracture strain and the corresponding average stress triaxiality and Lode parameter for two tests for each specimen type.

3.3 Effect of temperature
The effect of the stress triaxiality and Lode parameter on the fracture strain of the same material at room temperature has been recently studied by Kacem et al. [10]. Fig.9 compares the results obtained in the present study at 200°C with the ones reported in [10]. Only the triaxiality is considered in Fig.9 since it was found that this material exhibits a weak Lode parameter dependency. It can be seen that the testing temperature has a high effect on the fracture strain with an increase from room temperature to 200°C between 42% (in the case of SH specimen) and 107% (in the case of N-R5 specimen). It can be seen that the temperature influence on the formability depends on the stress state. Indeed, the effect of temperature is more significant at high stress triaxiality. Furthermore, it can be seen that, in the case of notched specimens, the average stress triaxiality also increases with the raise of temperature since the localization becomes more pronounced.
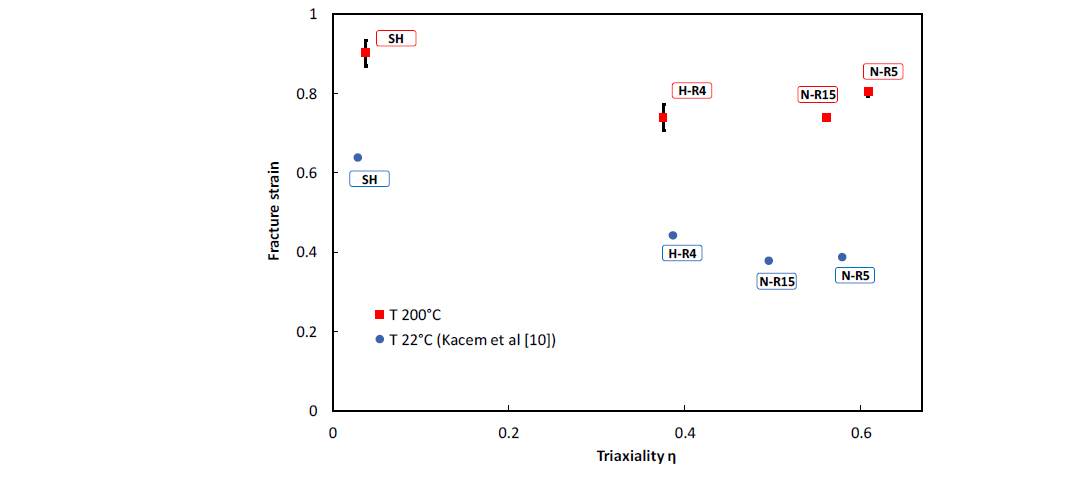
Fig. 9. Comparison between (ηavg, 𝜀̅f) points obtained by the hybrid experimental-numerical approach at 200°C and at room temperature [10] for the different ductile fracture specimens.
4 Conclusions
The stress state dependent facture behavior of AA6061-T6 aluminum alloy is investigated at 200°C. Wide range of stress state is tested by using different specimen geometries. Fracture strain and stress state parameters are determined by a hybrid experimentalnumerical approach. For this purpose, a strain rate dependent anisotropic material model for finite element analysis is used. Attention is paid to accurately constrain the FE model by using the real experimental boundary conditions. The model parameters are identified using the experimental data obtained from ductile fracture tests by comparing load-displacement curves between experiments and simulations. The FE model accuracy is verified by also comparing the numerical and experimental evolution of major strain in critical zone for all fracture specimens. The analysis shows that the stress state has a high influence on the formability of material. In addition, due to the extremely ductile nature of the fracture at elevated temperature, notched specimens show a high variation of stress state during the test. Besides, it is found that the fracture strain is highly influenced by the temperature. The high stress triaxiality states show considerably greater influence on the fracture than the low stress triaxiality state.
Acknowledgements
The authors acknowledge the Région Bretagne financial support with the SAD18037 program.
