1 Introduction
FE forming analysis of fiber reinforced thermoplastics (FRT) should predict the wrinkling of the fabric reinforcement and determine the shear angle distribution of the formed part. Several material tests are necessary to characterize the forming behavior over the melting temperature of the thermoplastic matrices for validation of FE models. They were investigated in prior studies [1-5].
The mechanical behavior of a dry plain weave has been simulated by a meso-scale model by [6]. The authors explain that the tensile properties are much higher than the bending, compression and shear properties. Strength properties decrease but strain values increase with the order of listing here. Other authors explain that shear and bending behavior and the interaction between them have a significant influence on wrinkling and shearing behavior [7]. Their results are based on FE sensitivity analysis of material properties for UD-Tape laminates.
In prior studies [4, 5] an FE sensitivity study of forming of a Double Dome part also showed the interaction between shear and bending behavior as well as compression and bending behavior for the FE model of bidirectional fabrics. The results were assessed qualitatively. In further studies the relationship between compression and bending stiffness has to be analyzed in detail to maybe reduce one of both material tests.
In this study formed Double Dome components will be evaluated with regard to fiber angle and wrinkling for a quantitative comparison of the simulation results in further studies. The investigated material is a glass fiber reinforced polyamide 6 with twill fabric (2/2 twill, 600 g/m²): TEPEX® Dynalite 102-RG600(1)/47 % from Bond Laminates. The melting temperature is about 220 °C. The shear and wrinkling behavior will be investigated with respect to several forming temperatures and fiber orientation of the organic sheets.
In a first step, the mechanism for shear behavior and wrinkling are shown using the literature. Afterwards, the forming results will be discussed.
2 Mechanism and sources of fabric shear and wrinkling
Fabric shear is one of the most important forming mechanism of fabric reinforced thermoplastics. External forces like tensile forces outside the fiber direction lead to a shear load and distort the fabric mesh into a rhombus [8-10]. Several authors investigate the influence of process parameters to the shear force values of picture frame tests and bias extension tests. Shear forces increase with increasing velocity [11, 12], decreasing temperature [13] and increasing normal pressure [10].
Fabric shear stops, when the fibers are in the direction of the load or the shear angle reaches a maximum value, the locking angle [14]. Higher shear deformation would require compression of the fiber bundles. After reaching the locking angle there is a development of planar compressive stresses that lead to wrinkling [11, 15].
Fig. 1 shows the forces for a deep drawing process according to [16]. When forming a hemispherical part, there may be wrinkling in the flange area due to planar stresses at the circumference [14] before reaching the locking angle. Furthermore, there are friction forces in the flange, normal forces due to the blank holder, tensile/ compression forces at the frame and bending forces at the drawing radius (Fig. 1).
Pre-tensioning of the fibers can reduce such planar compressive stresses and thus reduce wrinkling [10]. The locking value can be increased due to blank holders [17] or springs [18].
The influence of tension forces or membrane tension to shear stresses for picture frame tests is described in the literature [11,19,20]. Increasing membrane stresses results in higher shear forces but reduce the wrinkles of the fabric.
Fig. 2 shows the results of picture frame tests of TEPEX® Dynalite 102-RG600(3)/47 % at 260 °C. The frame was developed by [21]. Both specimens have the same test parameters but the specimen on the right side shows wrinkling before reaching the maximum locking angle. The shear frame has toggle levers and a self-adhesive fabric tape is used for the clamping area to prevent the thermoplastic from sticking to the tools and to avoid fiber breakage. The use of clamps with elastic coverings can lead to loose fibers that would need a preloading to avoid wrinkling [10].
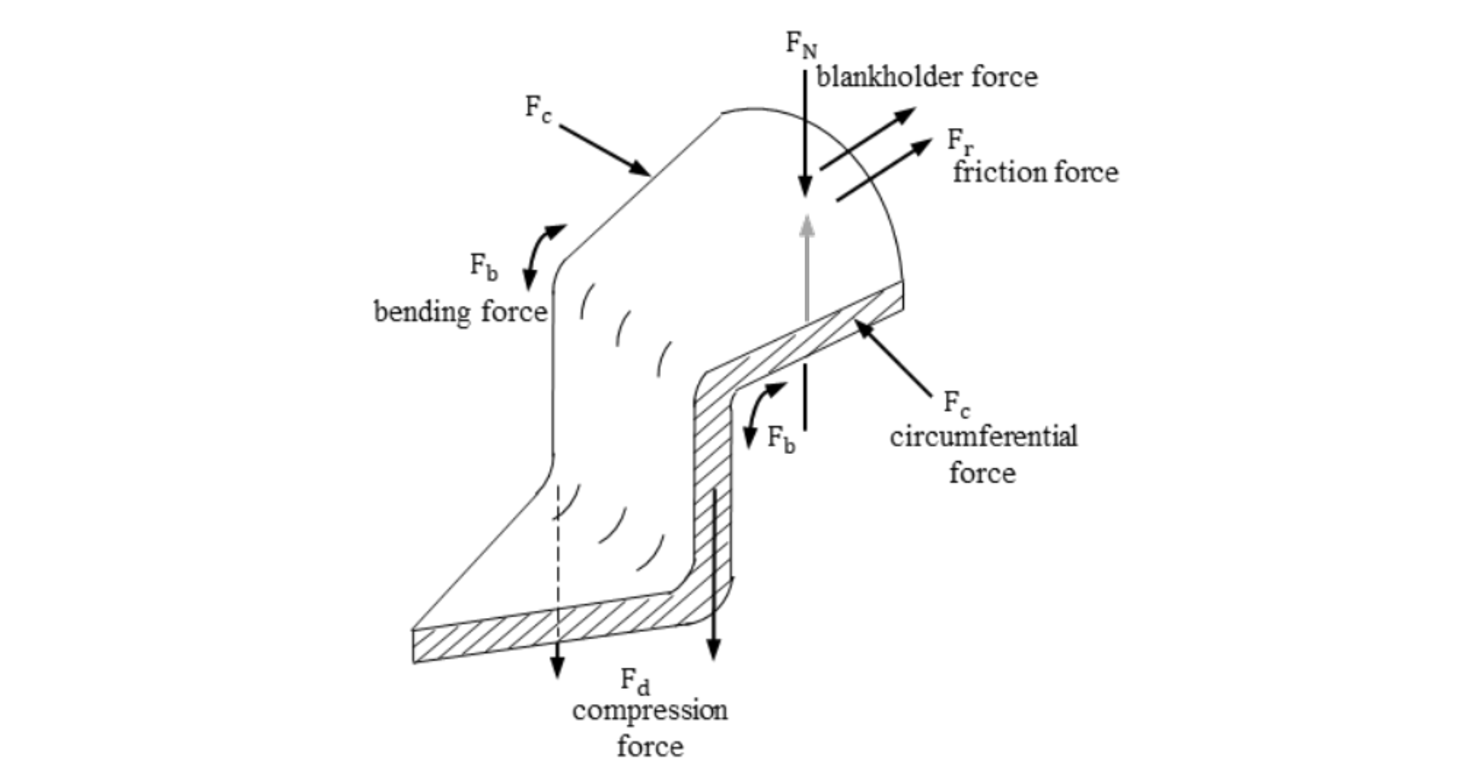
Fig. 1. Force states of a deep drawing process [16] .
![Fig. 1. Force states of a deep drawing process [16] .](docannexe/image/3756/img-2.png)
Fig. 2. Picture-Frame-Test: T=260 °C, ν=50 mm/min. (a) pure shear, (b) wrinkling.
3 Forming of Double Dome Part
This study presents the results of stamp forming tests of a Double Dome part [2] without blank holder to allow wrinkling (Fig.3 (a)). The organic sheets are clamped in a flexible frame connected to a robot that moves them from an infrared heating unit into the press. The temperature of the sheets is measured with two infrared cameras after heating and after transferring into the press before forming. Afterwards, the temperature is measured from below through the open die with three infrared thermometers, one in the middle and one on each outside near the forming radii.
Fig. 3 (b) shows an example of the cooling curves. The outer measure points (left and right) show higher cooling rates than in the middle of the part. The organic sheets cool down below the forming temperature (mark up, Fig.3 (b)) within a few seconds when the tool closes (Δt).
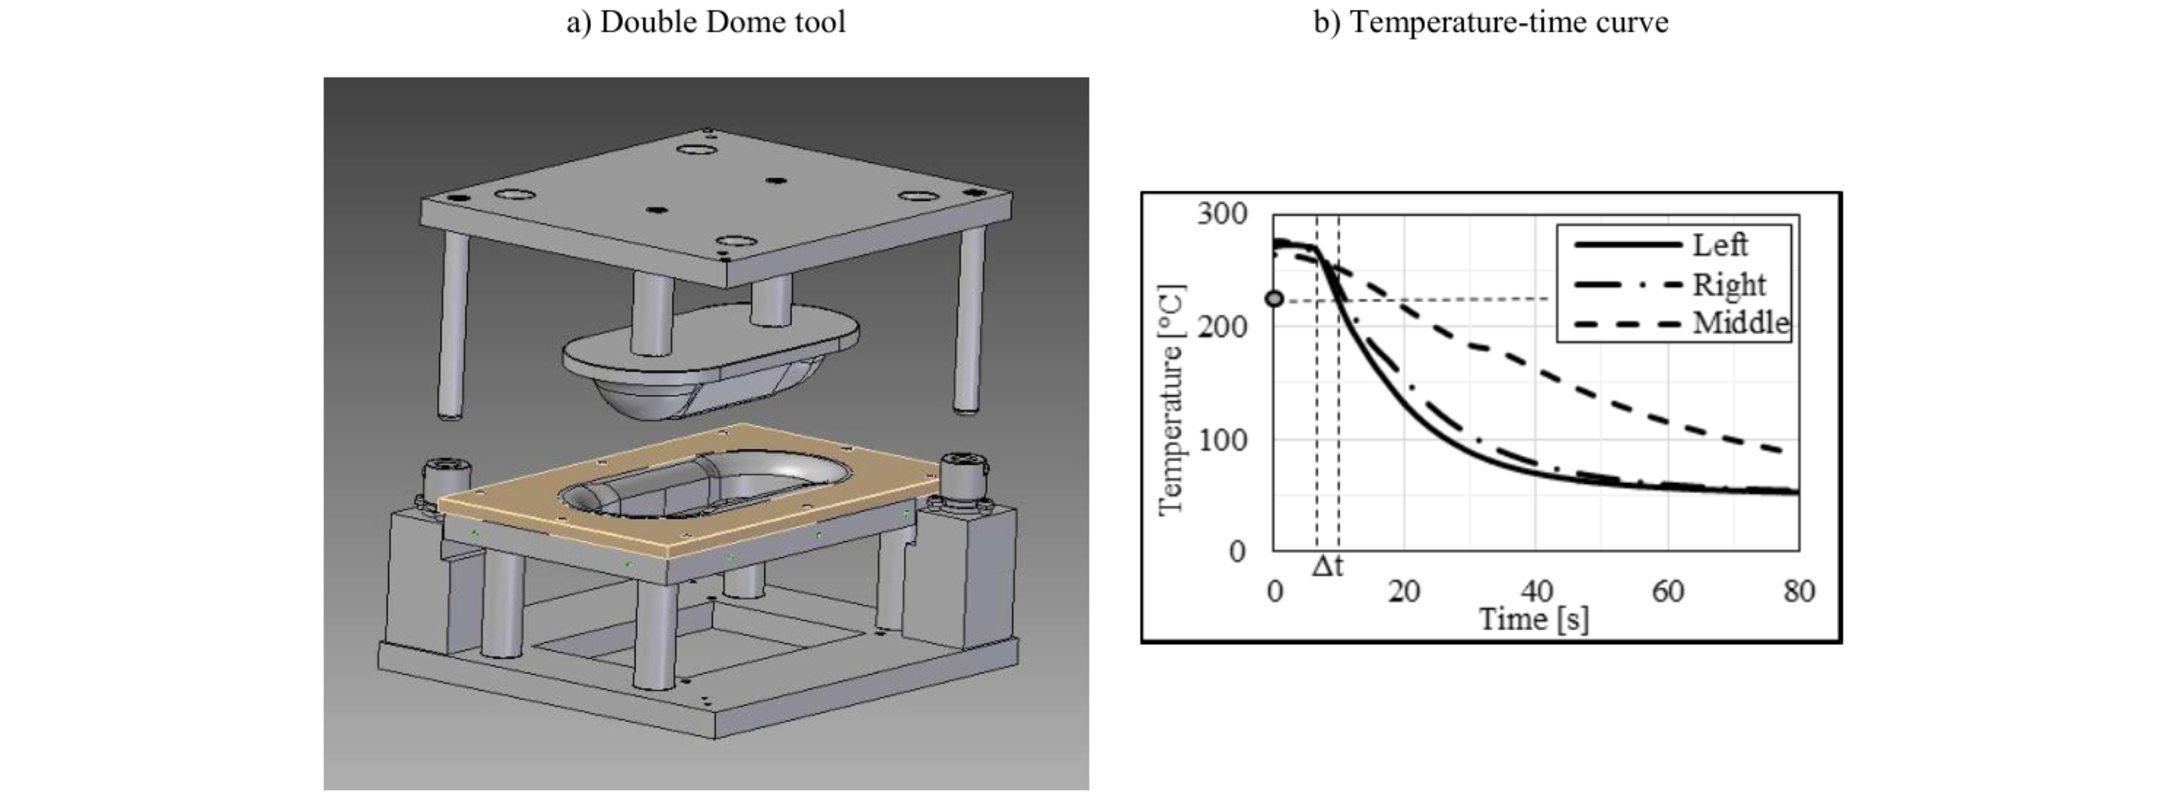
Fig. 3. Double Dome forming process.
The parts were formed at different forming temperatures (250 °C, 270 °C, 290 °C) and fiber directions (0 °/90 ° and ±45 °) with 3 samples for each parameter setting. The fiber direction of 0 °/90 ° means the fiber bundles are in parallel to the tool edges at the beginning of the forming test and the fiber direction of ±45 ° means the bundles are rotated at an angle of 45 ° to the tool edges.
The mean values of the temperature of the organic sheets have an average deviation of up to 6 °C from the nominal temperature. The average deviations of the individual samples within a test series are up to 3 °C. The cooling time with the mold closed is 90 seconds. Afterwards, the fiber angles will be calculated with image analysis in MATLAB, which is described in the next chapter. A reflex camera and a light box with diffuser are used to take high-contrast photos. An image size with 12x5 nodes (Double Dome parts) and 7x7 nodes (bias-extension test) of the fabric was chosen. In order to be able to make reproducible recordings in which the part and camera are always in the same position, an appropriate device is used with central part holders and a camera holder which can be rotated on three axes and variably adjusted in height and radius (Fig. 4 (a)). In Fig. 4 (b), the areas with maximum shear angles are marked and are examined below. Furthermore, the fiber wrinkling in the flange area is measured with a laser scanner and the fold profile along the cutting line (Fig.4 (b) - green) is evaluated.
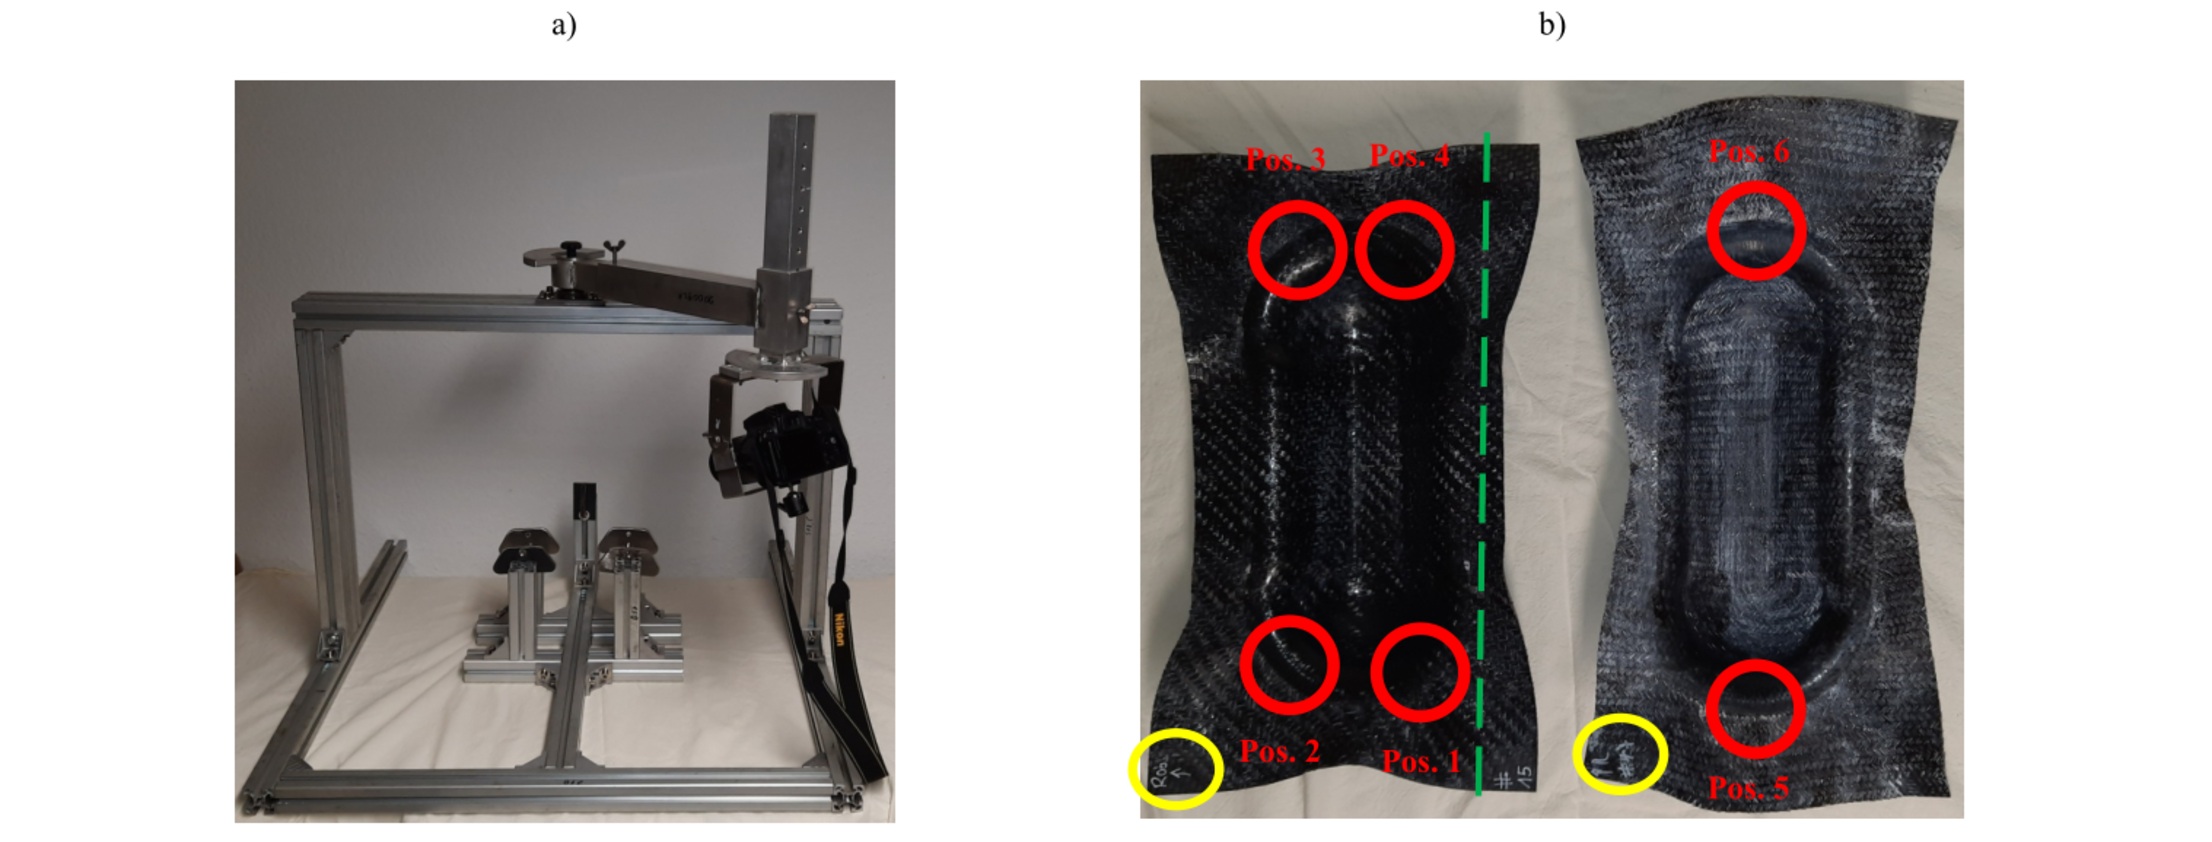
Fig. 4. Device for evaluating the shear angle (a) Sample and camera holder, (b) parts with 0 °/90 ° & 45 °/45 °-orientation and their positions with maximum shear angles (red) and cutting line for evaluation of the wrinkles (green).
3.2 MATLAB tool
This chapter explains the determination of the shear angle with MATLAB using a sample from a bias extension test. The tool requires images with a high contrast between the fibers and the matrix, as well as uniform lighting of the fibers in the warp and weft directions (Fig. 5 (a)). This achieves similar color intensity values and thus a better delimitation from the matrix. In the first step, the preprocessing of the images, a gray-scale image is generated (Fig. 5 (b)), in which the fiber and matrix areas can be distinguished from one another based on the intensity values of the pixels. Afterwards the image can be classified by a defined threshold value in fiber areas (white) and matrix areas (black). A subdivision of the image into blocks enables the use of different threshold values for each block, which, depending on the image quality, improves the delimitation between fibers and matrix. In the second step, the calculation of the image gradient, the image is derived in both directions with differential filters. The total gradient at every point in the image can be determined through geometric relationships. This shows the direction of the greatest possible contrast between white and black and is thus perpendicular to the fibers. By rotating this gradient by 90 °, the course of constant intensity values in the image is determined (Fig. 9 (c)). The results are smoothed with a Gaussian filter. The adapted Euler integration is used to determine the streamlines from the calculated vector data. The lines indicate the course of the fibers (Fig. 5 (d)). The shear angles between the fibers can be calculated from the lines determined.
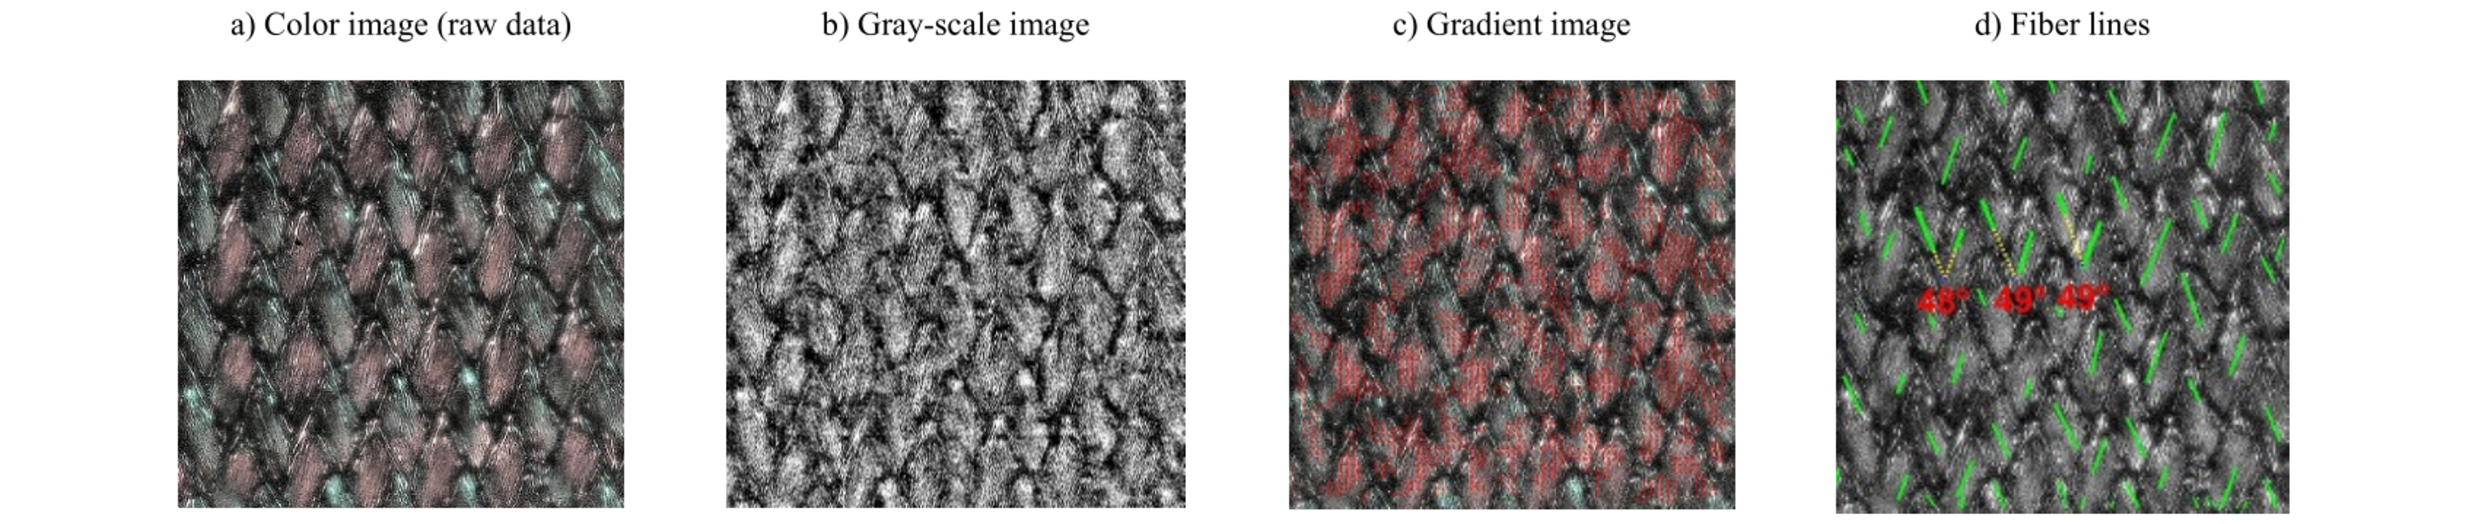
Fig. 5. Determination of the shear angle with MATLAB using a sample from the bias-extension test.
4 Results
4.1 Wrinkling
The samples from the test series which were produced with temperatures of 250 °C (Fig. 6, above) show more pronounced wrinkles than the samples from the series with temperatures of 290 °C (Fig. 6, below). The higher forming temperatures offer the fabric better reorientation and sliding possibilities. Thus, the stresses caused by the deformation can spread over a larger area within the fabric.
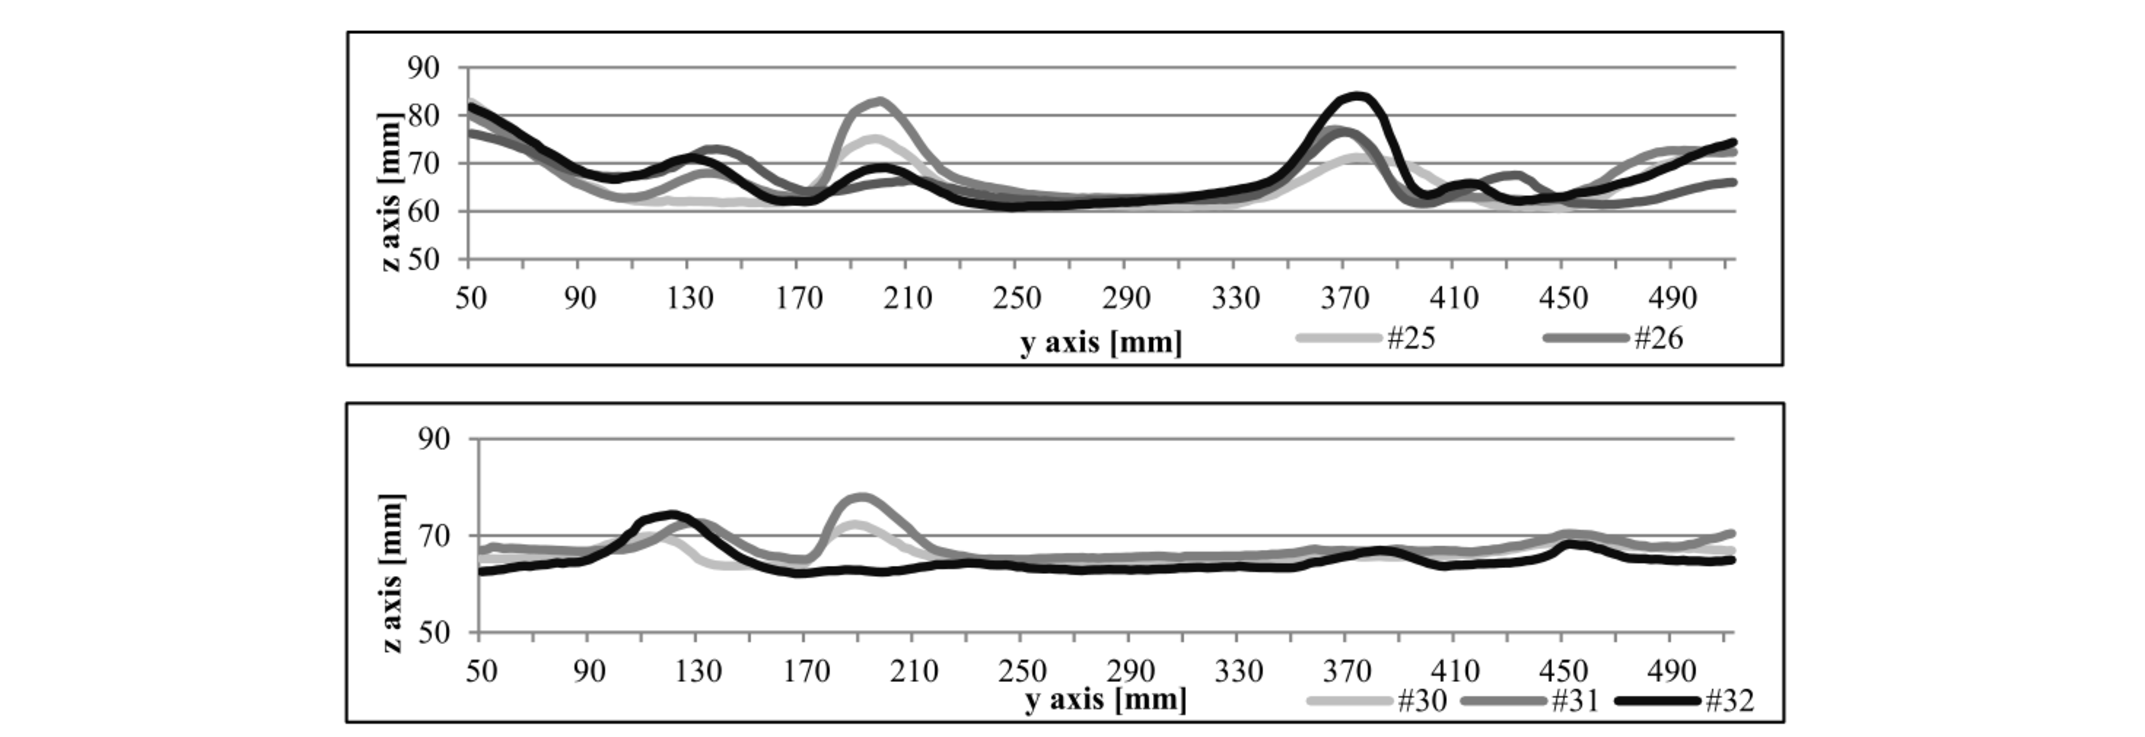
Fig. 6. Section through specimens with a forming temperature of 250 °C (above) and 290 °C (below).
4.2 Investigation of the maximum shear angle with constant fiber direction (0°/90°) and different temperatures
The investigations show an axial symmetry in the sample with regard to the shear angle. The shear angles in positions 1 and 3 are negative while those in positions 2 and 4 are positive. Fig. 7 shows the definition of the fiber angle α and the positive and negative shear angles φ resulting from equation 1. The behavior described has also been shown within a FEM forming analysis of the Double Dome part geometry without blank holders for a plain wave material by [23]. There is no absolute difference between positive and negative shear angles in [23]. In the present study the positive shear angles are always higher compared to the negative shear angles within the same sample. Figure 8 shows the mean values of the highest and second highest shear angles for each position of the test series with temperatures of 250 °C, 270 °C and 290 °C. The average deviation is about 9 ° when comparing positions 1 (-) and 2 (+) and positions 3 (-) and 4 (+). This behavior is examined in more detail using bias extension tests in the following chapter. The results at 250 °C deviate from this value. The difference here is about 14,8 ° and 3,3 °. Another finding is that the shear angles increase at a temperature of 290 °C but there is no clear increase in the shear angles between temperatures of 250 °C and 270 °C.
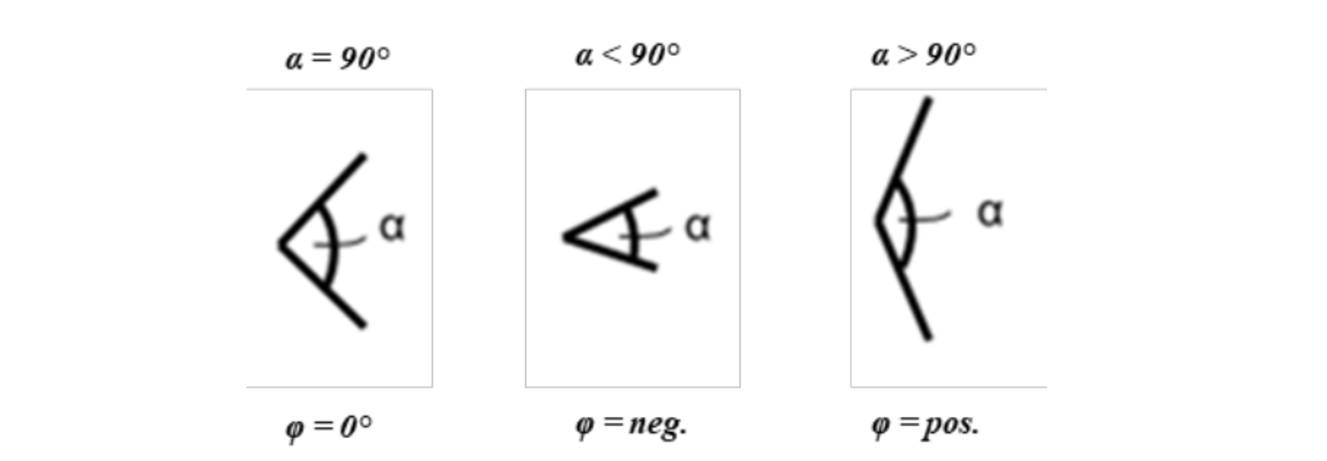
Fig. 7. Definition of fiber angle α and positive and negative shear angle φ.
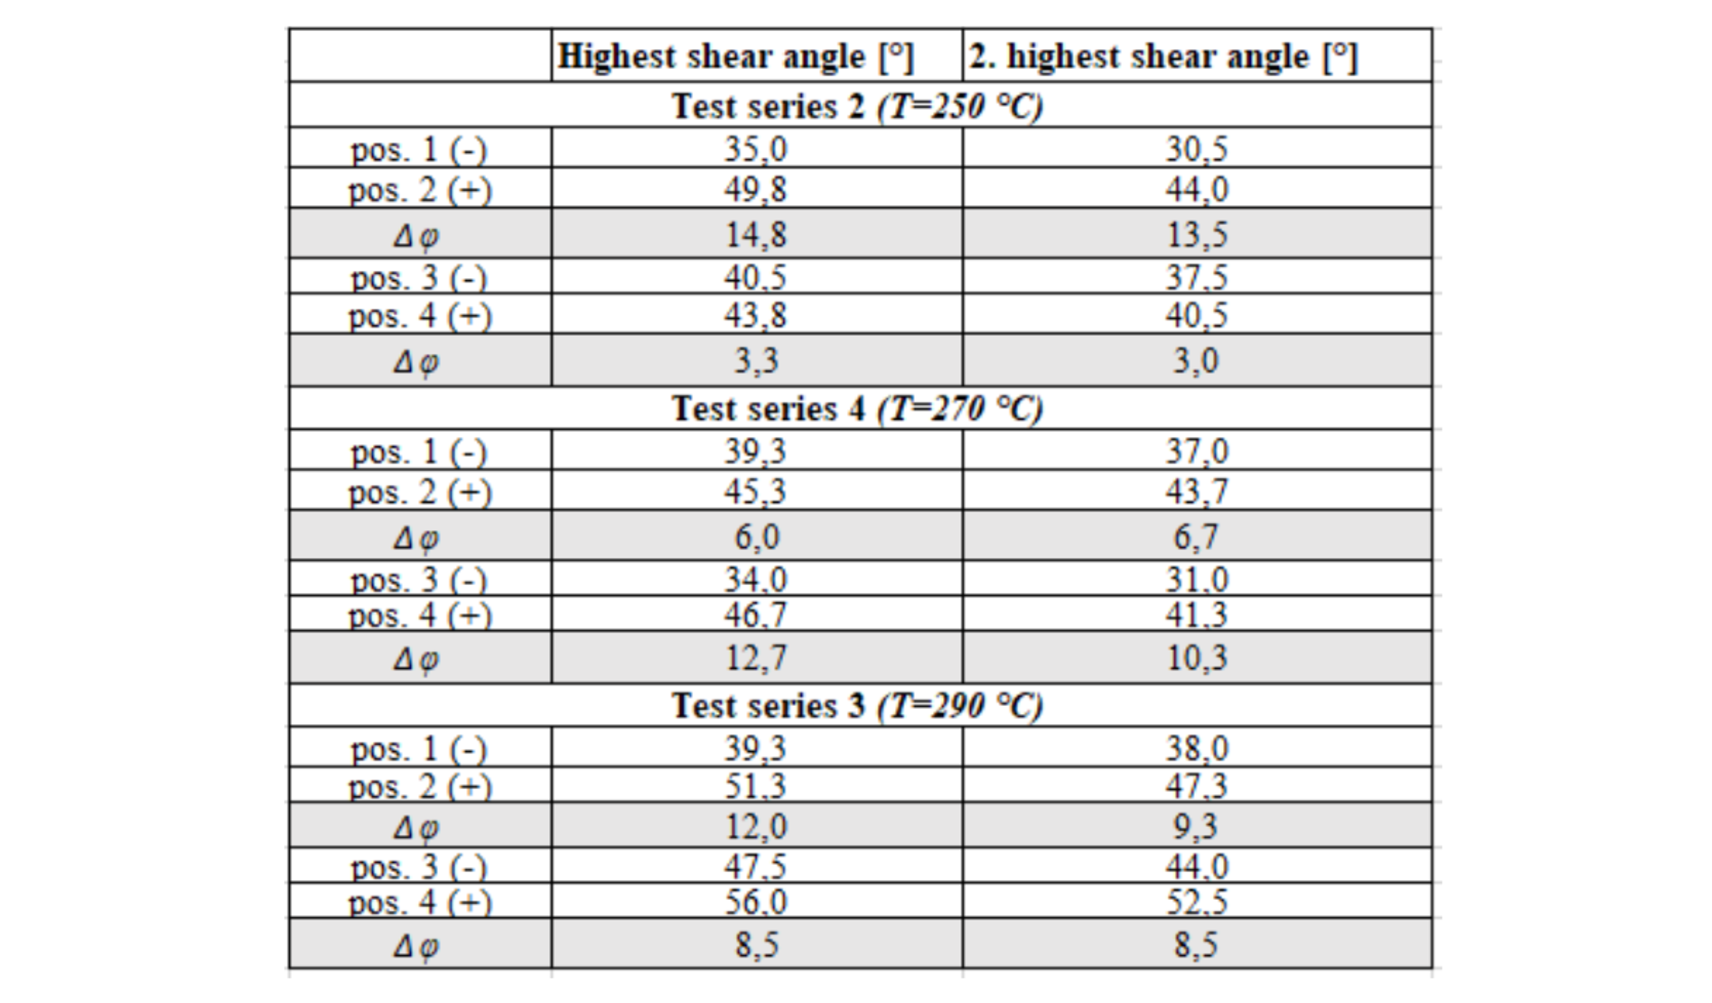
Fig. 8. Highest and second highest shear angle at different positions and temperatures (T=250 °C, 270 °C, 290 °C).
4.2.1 Bias-Extension-Tests
A rectangular test sample is drawn at 45 ° to the fiber direction (Fig. 9). The ratio of Height (H) to width (W) is about 3. Fig. 9 shows the different cutting directions based on the twill fabric resulting in positive and negative shear angles according to Fig. 7.
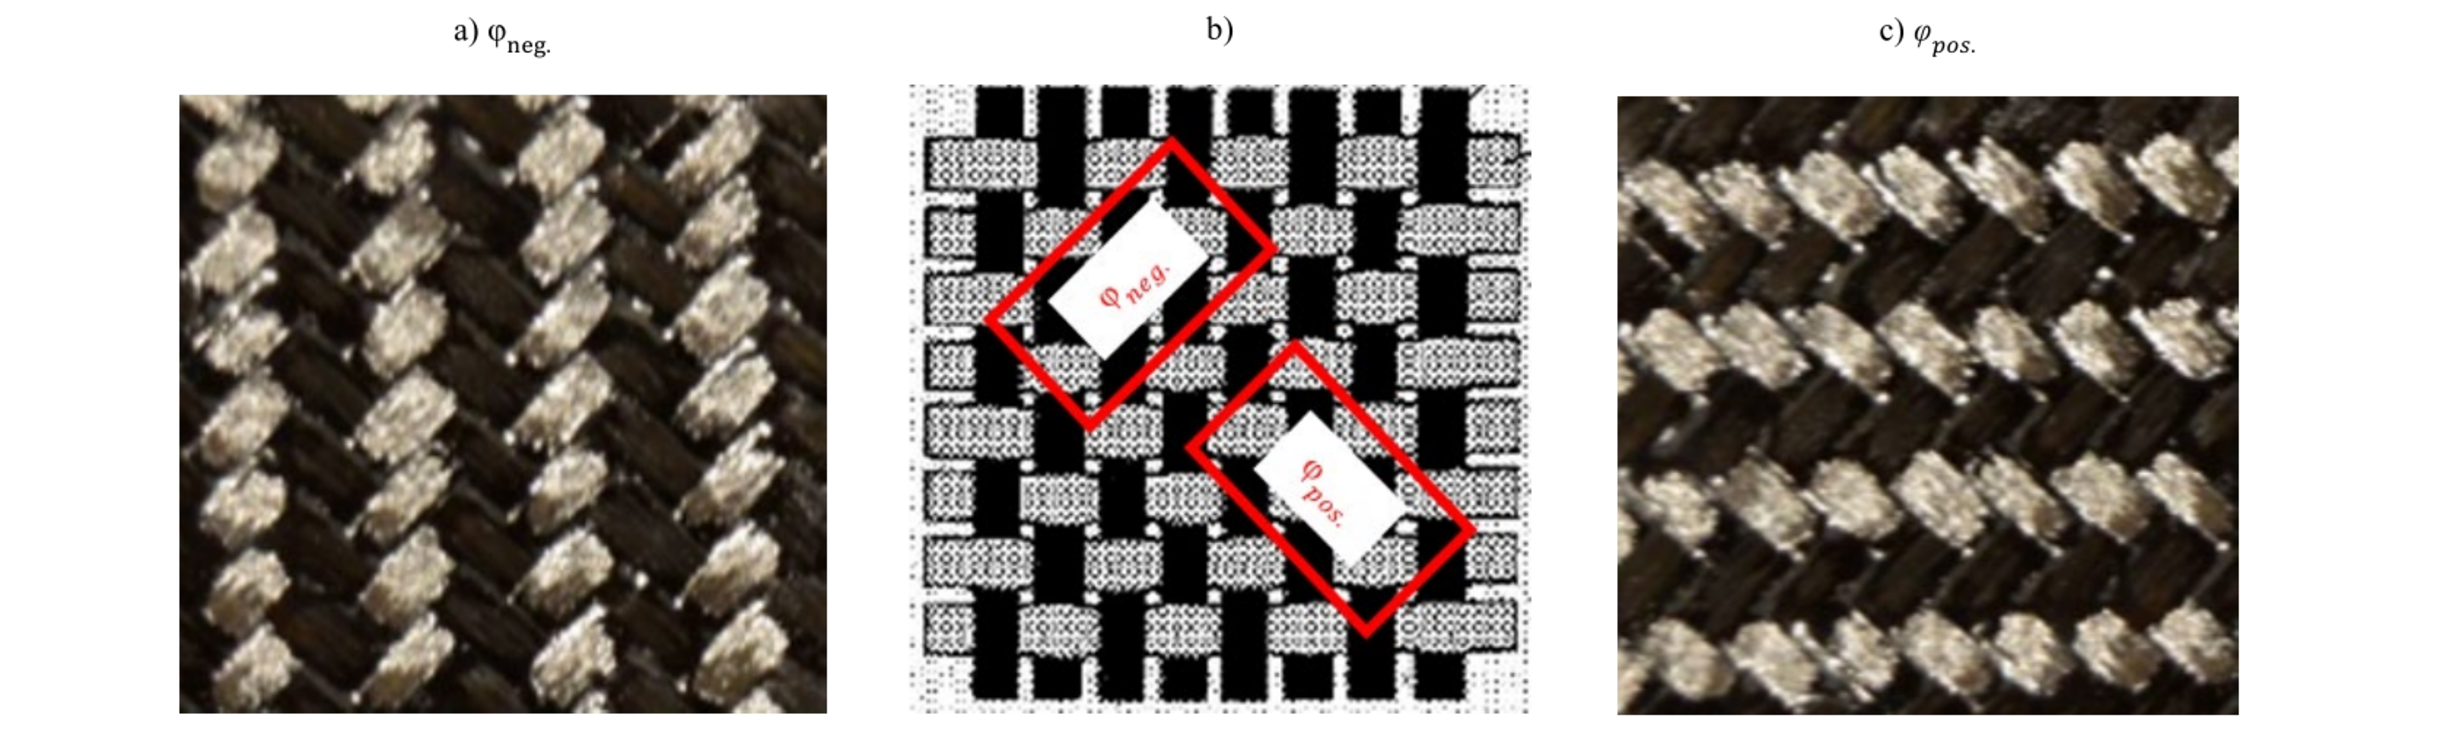
Fig. 9. Sample cutting and load direction of twill fabric (a) Negative shear angles (b) Arrangement of warp and weft yarns [22] (c) Positive shear angles.
Three samples are tested for each direction within a thermal chamber at 260 °C and a velocity of 200 mm/min. The tests are recorded with a video camera and diffuse lights are used from two sides at 45 ° for lighting the fiber bundles. Thus, high-contrast images can be generated at any point in time of the test. The test is divided into 14 steps for shear angle calculation in MATLAB. The shear angles are measured at 5 points in the middle region of each sample to calculate an average value.
Fig. 10 (a) shows the maximum shear angle and force values for each sample and the mean values for each cutting direction. The samples with positive shear angles reach higher shear angle values at lower force values. The shear angles are about 7 ° higher for the selected sample size. The Double Dome part shows differences of about 9 °.
Fig. 10 (b) shows the shear angle vs. displacement curves of two samples which are closest to the mean values. The curves are close to each other up to shear angles of about 32 ° (displacement of about 40 mm). After that, the difference between positive and negative shear angles increases.
Fig. 10 (c) shows the force vs. shear angle curves for the selected samples. At angles of 32 ° the increase in force is much higher. The maximum force value is reached earlier for negative shear angles.
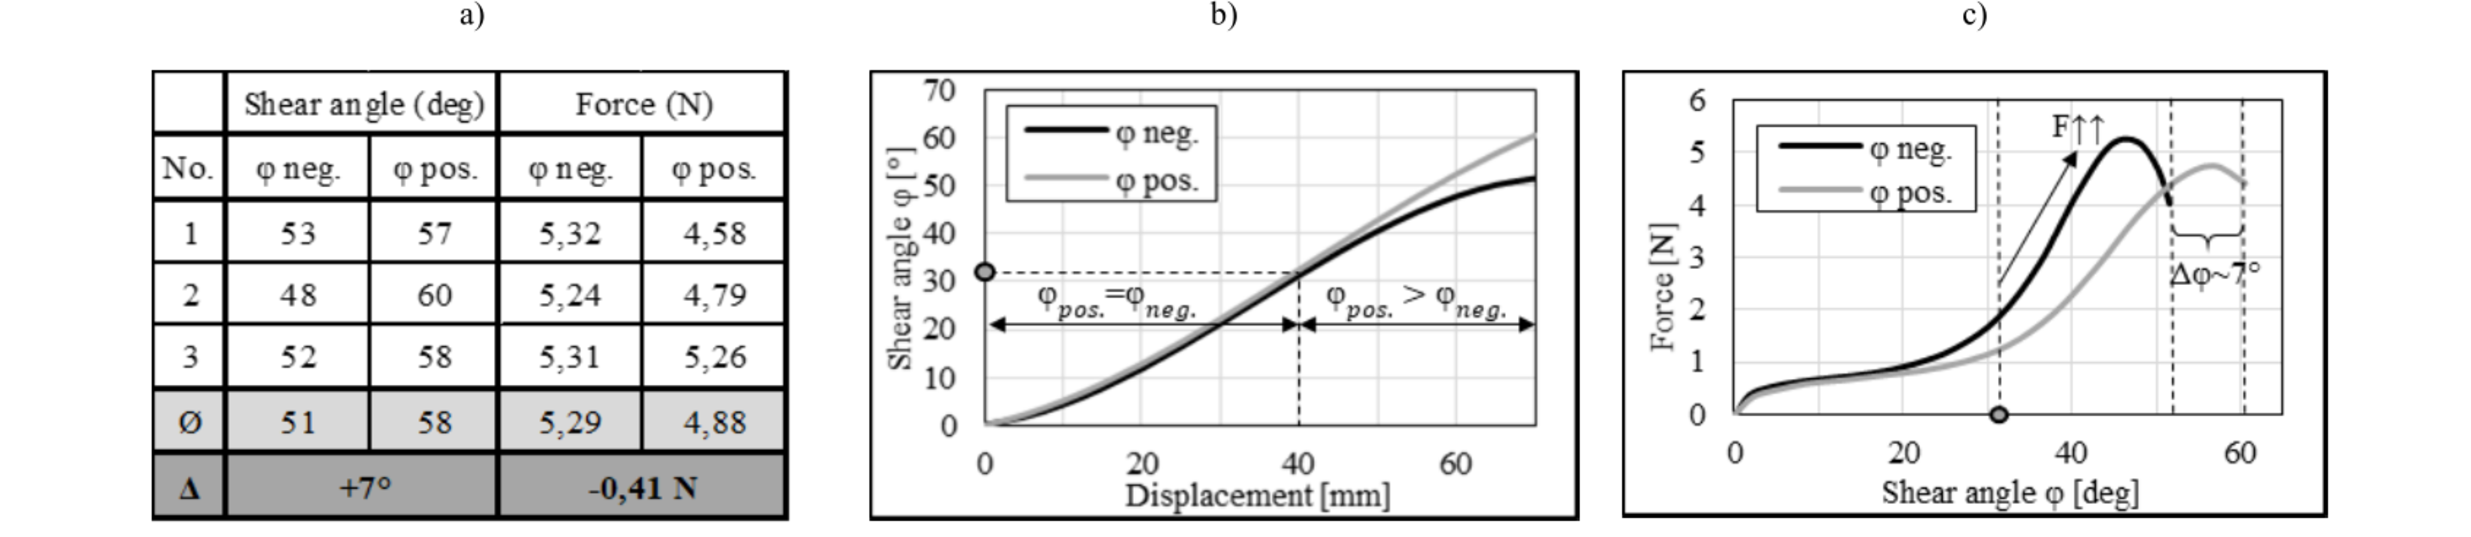
Fig. 10. Results of Bias-Extension-Test (T=260 °C, v=200 mm/min., H/W = 3) (a) Maximum shear angle and force values, (b) Shear angle – displacement curve, (c) Force-Shear angle curve.
4.3 Investigation of the maximum shear angle with different fiber directions (0 °/90 ° & ±45 °) and a temperature of 270 °C
Another finding is the comparison between two test series with different fiber orientations of the raw part of 0/90 ° and ±45 °. These investigations show a shift in the area with maximum shear angles (see positions in Fig. 4 (b)). In addition, there is a difference between the maximum shear angles, which amounts to 15 ° to 20 °. Fig. 11 shows the samples which best reflect the mean values of the respective test series. The areas with maximum shear angles for a fiber orientation of ±45 ° may have a higher load during the forming process resulting in higher shear angles. The FEM results of plain weave presented in the literature determine a difference of about 11 ° [23]. The authors explain that the main deformation mechanism in the woven fabric is an intra-layer shear, which strongly depends on the direction of the fabric. Another study shows similar results on a hemispherical- dome in which the fiber direction of ±45 ° shows higher shear angles of about 5 ° compared to a direction of the raw part of 90 °/0 ° [24].
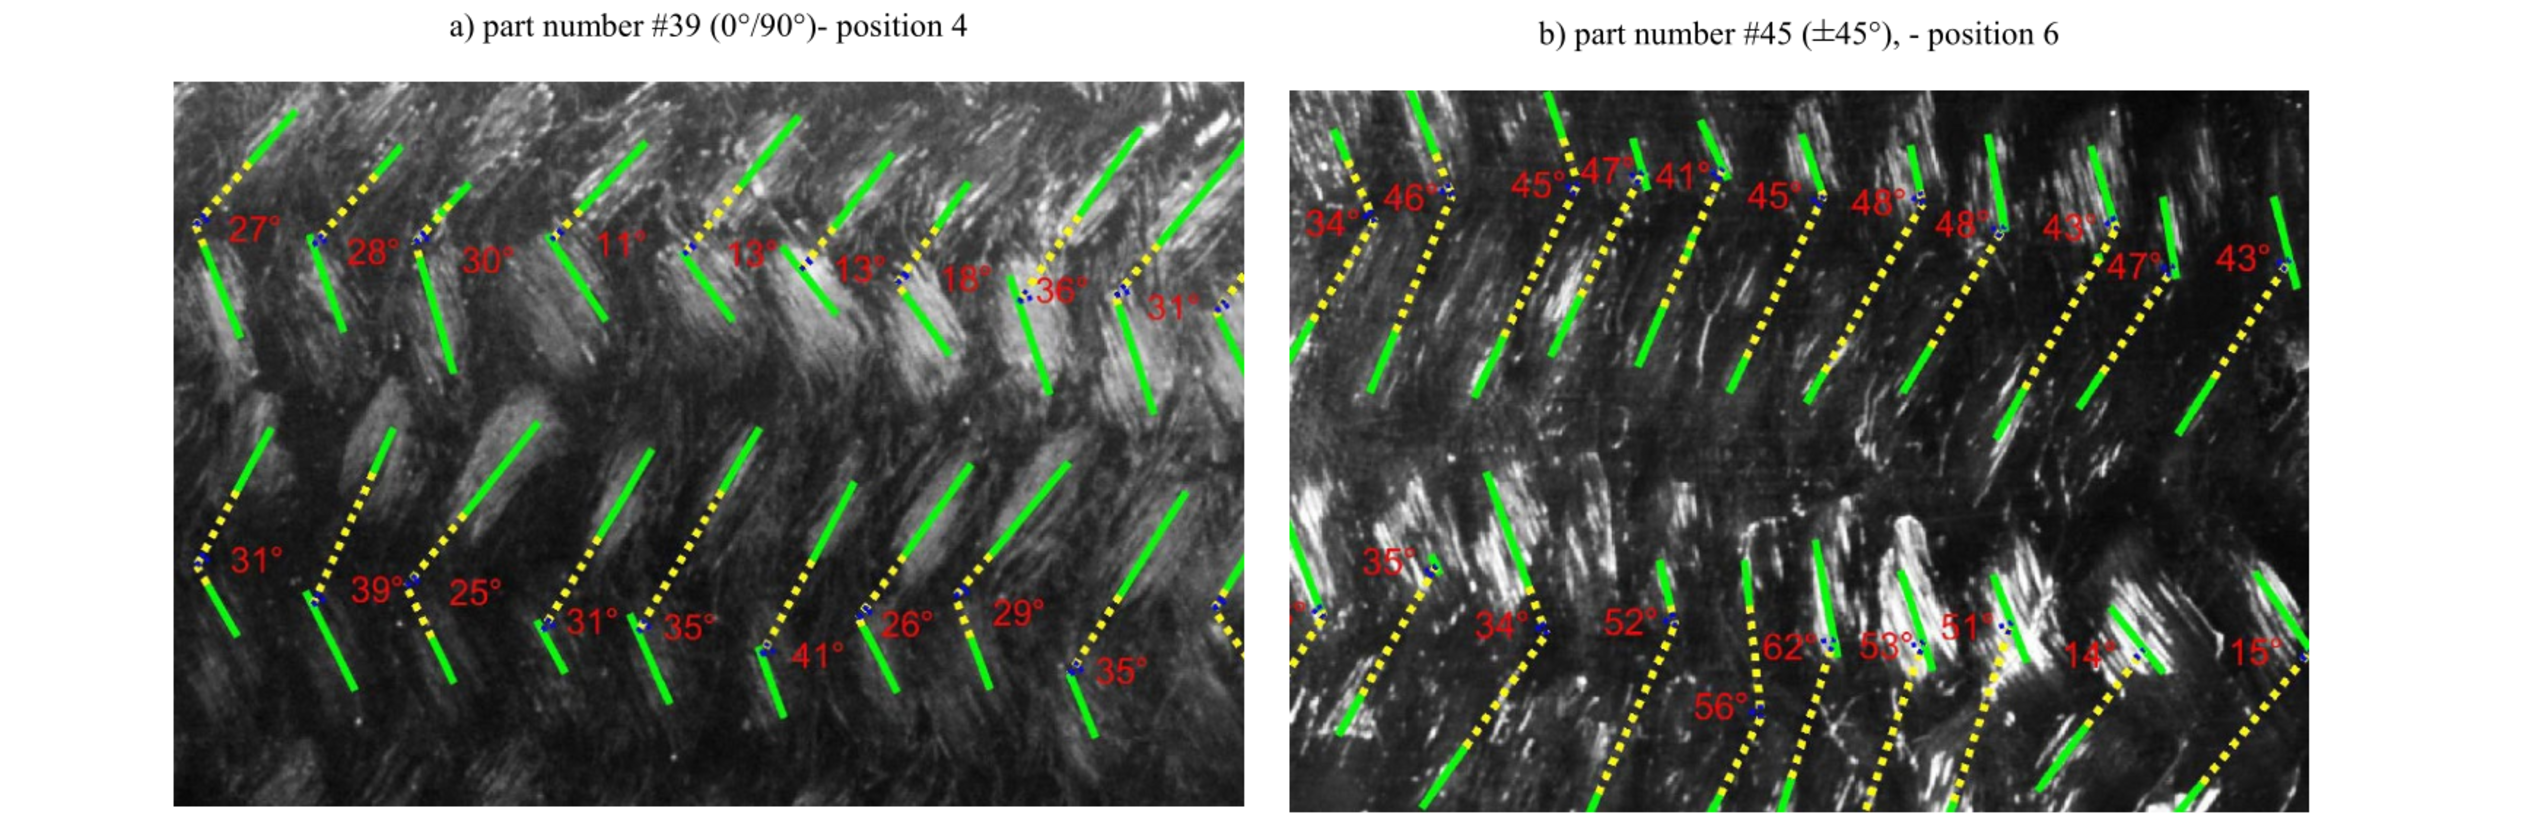
Fig. 11. Shear angles with different raw part-orientation at the same temperature a) part number #39 (0 °/90 °), T=270 °C - position 4, b) part number #43 ( ± 45 °), T=270 °C - position 6.
4.4 Correlation between wrinkling and shear angle
The investigations showed that the formation of wrinkles decreases with increasing deformation temperature while the values of the maximum shear angle increase. Larger shear angles can absorb more stress during the forming process before it is relieved by wrinkling. The investigations of the parts with a fiber direction of 0 °/90 ° result in different maximum values for negative and positive shear angles (section 4.2). The shear angles have also different effects on wrinkling within a part. It was found in samples with the highest forming temperature (290 °C) that there is less wrinkling around the areas with positive shear angles (position 2 & 4, Fig. 12), which are about 9 ° larger than around the areas with negative shear angles (position 1 & 3, Fig. 12).
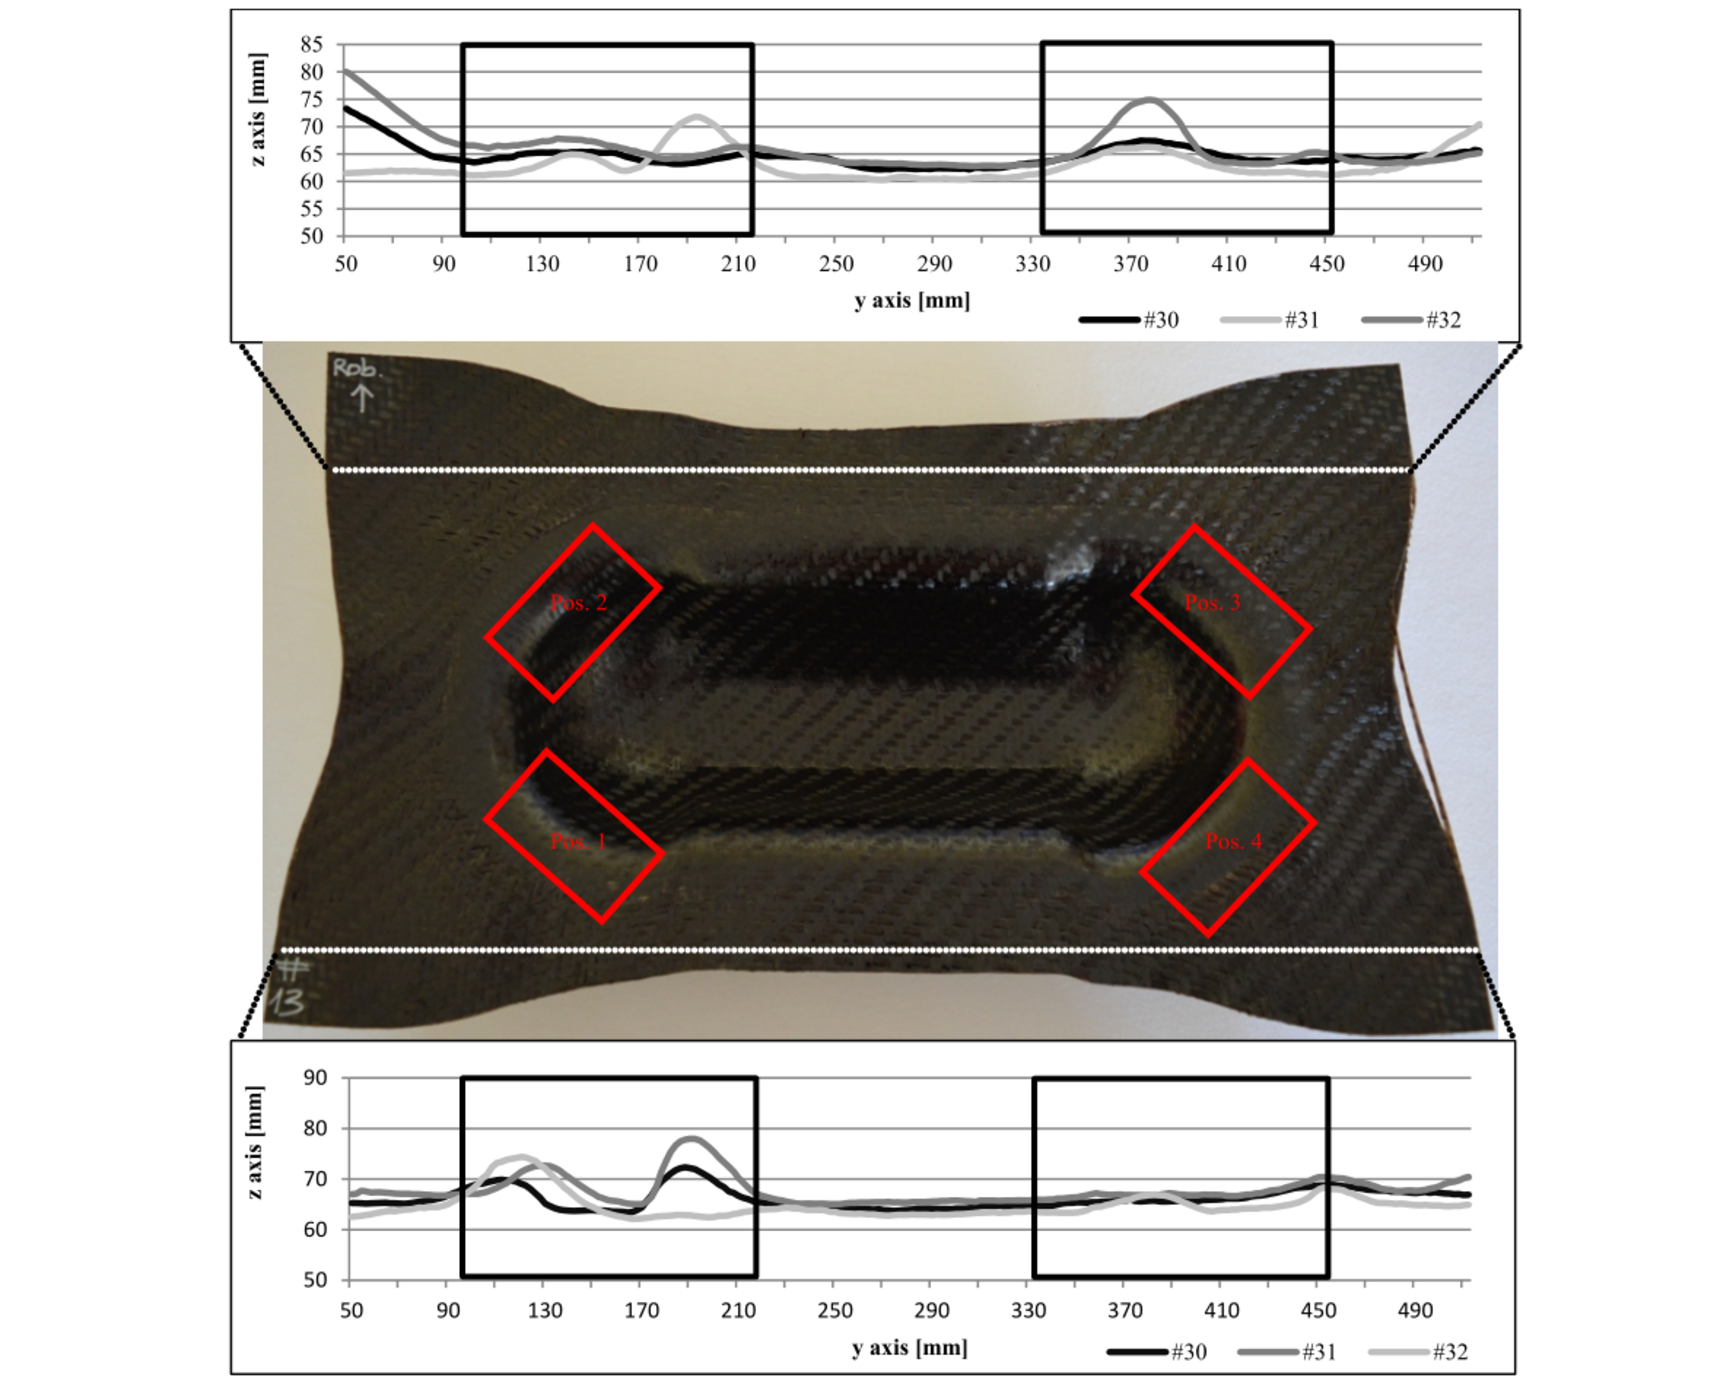
Fig. 12. Part with forming temperature 290 °C at position 4 (left) & position 3 (right).
5 Summary
This paper contains the results of several forming test series of a Double Dome part with regard to their wrinkling and shear angle distribution at different forming temperatures and fiber orientations of the raw part. The formation of wrinkles decreases with increasing temperature while the shear angle generally increases. In addition, the existence of positive and negative shear angles has been measured in the test series with the fiber directions of 0 °/90 ° as well as a difference in amount between these. When comparing the test series with different fiber directions of the raw part, differences in amount of the maximum shear angle could also be determined. Finally, the wrinkling in the area of the measured shear angle decreases when the shear angle increases.
Acknowledgements
The technical support of the Automotive Center Südwestfalen and LCC of TU München is gratefully acknowledged.
