1 Introduction
The future use of fiber reinforced polymers (FRP) for series production of lightweight structures primarily depends on availability of competitive, cost-efficient and reproducible manufacturing technologies. Liquid composite molding (LCM) represents a well-established production route, which nevertheless suffers from certain drawbacks associated with the complex FRP material behavior. Especially the interaction of fiber and matrix as well as the cure-dependent resin properties represent major challenges for part design and process control. As the thermo-mechanical behavior of the resin depends on a number of process parameters like time, temperature, degree of cure and pressure, material characterization and modelling require a comprehensive strategy.
Previously published work on cure-dependent resin behavior mainly focused on better understanding of conventional prepreg and RTM manufacturing processes [1–4]. Only few attempts were made to analyze the process-dependent properties of fast curing resins [5,6]. Furthermore, pressure dependence is often neglected, which is questionable when it comes to newly developed technologies with high impregnation speed like high pressure RTM (HP-RTM) or wet compression molding [7]. To fill this gap, an appropriate material model approach in combination with reliable material data are required. For this purpose, a visco-thermo- elastic simulation approach is selected [8] and calibrated. Cure-dependent properties were determined by shear rheological and dynamic-mechanical analyses (DMA) on partially cured neat resin specimens. A newly developed volumetric dilatometer is used to analyze pressure- und cure-dependent chemical shrinkage at process-related conditions [9]. The determined relationships between resin behavior and process parameters are transferred to the material model and used for simulations on micro-scale aiming at reproduction of surface waviness effects and residual stresses.
2 Methods
2.1 Experimental set up
The experimental program described here is complementary to a previously published work of the authors [10]. In this contribution, special attention is paid to pressure-dependent chemical shrinkage and cure-dependence of visco-thermo-elastic modulus of the fast curing resin system TRAC Epikote 06150, which is used for RTM processes in automotive industry. Isothermal (80, 90, 100 and 120 °C) measurements at different pressure loads (5, 10, 25 and 60 bar) are carried out using a dilatometer optimized for the characterization of fast curing resin systems [2,9]. Samples from the cured dilatometer specimens are prepared for the subsequent DSC measurement. The DSC analysis is conducted using the Q2000 device from TA Instruments Inc., Austin, USA, according to the specifications described in DIN 65467. A heating and cooling rate of 10 K/min is selected for all measurements and applied to a temperature range from -50 °C to 250 °C. The degree of cure (DOC) 𝜉 is determined from the value of remaining reaction enthalpy ∆𝐻𝑅 and the total reaction enthalpy ∆𝐻𝑅,𝑡𝑜𝑡𝑎𝑙 according to eq. 1 [11]:

The cure-dependent visco-thermo-elastic properties were determined using an Anton Paar MCR 502 rheometer device. A plateplate measurement system with a diameter of 25 mm and a gap of 1.5 mm was used to measure in the liquid stage as well as the liquid-solid transition during gelation, which was determined to occur at 𝜉 = 0.68. To allow continuous measurements, oscillation mode at a frequency of 1 Hz and a shear deformation amplitude of 1 % were chosen. Isothermal temperatures of 60 °C, 80 °C, 100 °C and 120 °C were used. The data are transferred from time scale to DOC scale by using the previously published reaction kinetics model of the resin system [10].
In order to cover the entire post-gelation area, a solid rectangular fixture (SRF) was used to analyze the influence of varying DOCs using specimens with a cross section of 2 mm x 4 mm and a length of 40 mm. In order to obtain time-dependent modulus data, relaxation experiments with an initial shear deformation of 0.1 % were performed at 5 K temperature intervals ranging from room temperature to a temperature 10 K below the actual glass transition. A relaxation time of 5 min was required to generate overlapping stiffness values between the selected temperature segments. Partial cure was realized by using a pre-cure schedule of 7 h at 60 °C within a molding tool; followed by progressive post-cure schedules according to Table 1 that were performed in a convection oven.
Table 1. Post-cure cycles for generation of SRF specimens with graded DOC.
|
Post-cure temperature (°C) |
Dwell time (min) |
Resulting 𝑇𝑔 (°C) |
Corresponding DOC (-) |
|
- |
- |
80 |
0.88 |
|
75 |
10 |
87 |
0.91 |
|
85 |
10 |
99 |
0.95 |
|
95 |
10 |
110 |
0.96 |
|
105 |
10 |
120 |
0.97 |
|
130 |
10 |
123 |
1 |
2.2 Material modelling approach
For simulating cure-dependent material behavior, a material model displaying the process-dependence is crucial. Based on the findings from Müller et al. [10] for fully cured resin, a material model is developed to model cure-dependent material behavior during the manufacturing process. In this study, the epoxy resin was modelled by a cure-dependent viscoelastic constitutive model developed and implemented as UMAT for ABAQUS based on the nonlinear viscoelastic constitutive model by Brandt and Rozo Lopez [8,12]. The cure-dependent viscoelastic behavior is modelled by a generalized MAXWELL model, taking into account temperature influence by a time/temperature shift function based on a modified WILLIAMS-LENDEL-FERRY (WLF)-approach [13]. The model presented allows to display effects of cure-dependent visco-thermo-elasticity, cure and pressure dependent volumetric shrinkage as well as thermal expansion. Thermal expansion and chemical shrinkage are implemented by using UEXPAN.
In order to calculate the cure state 𝜉, a nth-order and an autocatalytic type was selected (eq. 2 and 3):

with Ai, ni, m, Ei being material parameters and 𝑅 the universal gas constant defined in [10]

with 𝑇𝑔0 , 𝑇g∞, 𝜆 being material parameters determined by DSC scans on partially cured resin material and linear regression. Values are listed in Table 2.
Table 2. Parameter of DiBenedetto equation.

During curing of the resin, mechanical properties are steadily changing due to network growth, gelation and vitrification. To model the cure-dependent relaxation curves extracted from experiments, in a first step Prony series is fitted to generated master curves for ξ = 1 according to eq. 5 [10]. 𝑘 matches the 𝑘𝑡ℎ experimental master curve, while 𝑘 = 1 corresponds to the master curve at ξ = 1:

𝑛 is determined by fit with lowest residual mean square error (RMSE). Generally, 1 to 15 Prony elements are tested. According to O’Brien et al. [15] equilibrium shear modulus 𝐺∞ can be calculated by eq. 6:

where Cg∞, Dg∞ and Fg∞ are material parameters and 𝜉𝑔𝑒𝑙 represents the degree of cure at gelation.
For fitting the remaining master curves, following workflow is used:
-
Hence relaxation data at lower 𝜉 is unknown, data for high relaxation times is augmented following eq. 6 for 𝑡 > 1013 𝑠 - Prony series is fitted with 𝑛 equal to 𝑛 for 𝑘 = 1
-
Equilibrium shear stiffness is used for calculation of 𝐺(𝑡, 𝜉).
Based on these Prony fits, 𝐺(t) for ξk+1 ≤ ξ ≤ ξk is interpolated. For ξ < ξmax(𝑘) eq. 8 is used to calculate time-dependent shear modulus:

Temperature- and cure-dependence are considered by shift factor 𝑎𝑇 which is calculated by a modified WLF-approach [13]:

𝐶1, 𝐶2 are experimentally determined parameters. 𝑇0 is the selected reference temperature of 40 °C. 𝑡 is substituted by reduced time 𝑡𝑟𝑒𝑑 following eq. 10:

Due to the use of UEXPAN for thermal expansion and chemical shrinkage, providing thermal strain increment Δ𝜀𝑈𝐸𝑋𝑃𝐴𝑁𝑡ℎ within UEXPAN is necessary. Generally chemical volume change 𝑑𝑉𝑐ℎ is expressed by chemical strain increment Δ𝜀𝑐ℎ assuming a cube with side length 𝑙 as followed:

Assuming that the volumetric shrinkage is proportional to 𝜉 at a constant pressure 𝑝 leads to:

where 𝑓(𝑝) is an experimentally determined function (cf. eq. 17).
Following this, Δ𝜀𝑈𝐸𝑋𝑃𝐴𝑁𝑡ℎ is equal to the sum of actual thermal expansion increment Δ𝜀𝑡ℎ and chemical shrinkage increment 𝛥𝜀𝑐ℎ:

Δ𝜀𝑡ℎ is calculated as followed, where thermal expansion coefficient 𝛼𝑡ℎ is assumed as constant defined in [10]:

2.3 Simulation approach
The material model described above, was used in two different simulation models. The first model consists of a cube of unit length, which is subjected to pure shear in form of a unit jump within 0.5 sec. Afterwards the shear deformation is held constant for 300 𝑠 to reproduce the relaxation experiments. Throughout simulation time, the model is subjected to constant temperature. The unit length cube model is used to verify the above shown methodology for determining cure-dependent visco-thermo-elasticity.
The second simulation model represents a representative volume element (RVE) consisting of matrix material and randomly distributed glass fibers with a diameter of 7 𝜇𝑚 and a fiber volume fraction of 45 % according to [10]. The overall cross section in undeformed state has dimensions of 50 𝜇𝑚 𝑥 75 𝜇𝑚. The model thickness is 1 𝜇𝑚. Periodic boundary conditions are assigned to the lower surface, while the upper layer represents the component surface. The RVE is used for virtual parametric studies. These include the application of different material models (visco-thermo elastic and cure-dependent visco-thermo elastic) and the variation of the surface boundary conditions during the cooling phase (fix, free). In total 22,715 elements (C3D8 and C3D6) are used.
3 Results
3.1 Experimental Results
The results of volumetric dilatometer and DSC measurements are depicted in Figure 1. According to previous studies a linear approach was chosen to model the development of the chemical shrinkage after gelation [2,16]. For gelation time and corresponding DOC values the mean value of 𝜉 = 0.68 was used according to [10].
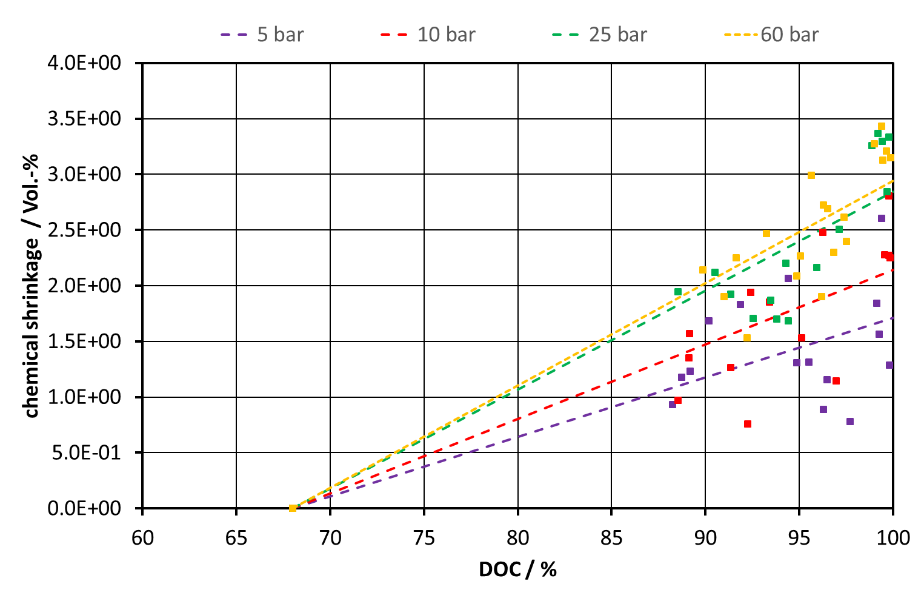
Figure 1:Pressure dependent chemical shrinkage and corresponding DOC values
Considering eq. 14 the pressure dependence of the chemical volume shrinkage can be fitted by eq. 17 and the data contained in Figure 1. For high pressure load eq. 17 approaches a limiting value.

With 𝑎1, 𝑎2, 𝑎3 representing fitting parameters and values listed in Table 3.
Table 3. Fitting parameters
|
𝑎1(−) |
𝑎2(𝑏𝑎𝑟−1) |
𝑎3(−) |
|
0.068 |
0.253 |
-0.009 |
Thus, elevated pressure loads result in increasing chemical volume shrinkage. Nawab et al. [17] have observed an effect of the hydrostatic pressure on the resulting chemical volumetric shrinkage of a neat resin sample. They justify the increase in chemical shrinkage by a decreasing free volume due to the high-pressure loads applied [17]. Li et al. [18] proved by means of molecular dynamic simulations that the free volume fraction increases during the curing process [18]. As the free volume fraction reduces with high pressure loads an increasing change of the volume can be expected with elevated curing pressures [19].
In order to provide experimental reference data for definition of the Prony parameters, cure-dependent data for the instantaneous modulus 𝐺0 and the equilibrium modulus 𝐺∞ as well as the relaxation behavior between glassy and rubbery regime are required. While the determination of 𝐺0 can be realized straightforward by evaluating the initial stress response of the relaxation experiments at low temperatures, the determination of 𝐺∞ is more challenging due to possible post-cure when using partially cross-linked specimens. For this reason, values for 𝐺∞ at 𝜉 < 1 are taken from the isothermal oscillating measurements in plate-plate mode. The evaluation of these experiments is limited to a DOC of 0.85, as in plate-plate-mode the increasing resin stiffness leads to residual stresses in combination with hindered lateral contraction. Consequently, a relaxation experiment on a fully cured specimen is used to generate an additional value for 𝐺∞ at 𝜉 = 1. The results are shown in Figure 2 together with the fit based on the work of [20] and according to eq. 6. Exact values for eq. 6 are listed in Table 4.
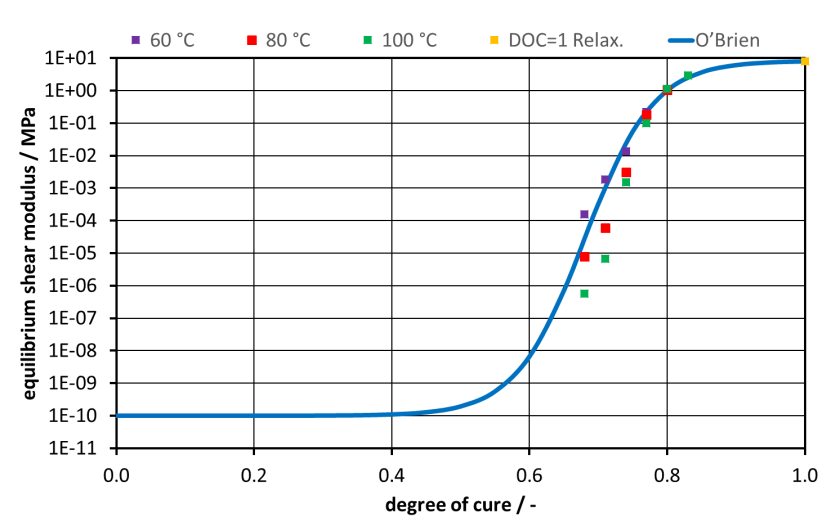
Figure 2: Comparison between experimental data and fit for equilibrium shear stiffness
Table 4. Parameters of O’Brien equation.
|
𝐶𝐺 (𝑙𝑜𝑔(𝑀𝑃𝑎)) |
𝐷𝐺 (𝑙𝑜𝑔(𝑀𝑃𝑎)) |
𝐹𝐺 (−) |
|
-10 |
10.92 |
0.05 |
The cure- and time-dependent relaxation behavior of the resin system is evaluated by using the time-temperature superposition principle. Individual master curves are constructed for the DOC from 0.88 to 1 at a reference temperature of 40 °C. The results with corresponding Prony series fit with 𝑛 = 13 following eq. 5 are shown in Figure 3. During fitting a RMSE of 0.001 was achieved. The derived Prony series are in good agreement with the experimental data. When plotting the master curves on the reduced time scale, it can be seen that the relaxation time increases with cure and the instantaneous modulus 𝐺0 decreases with cure, which can be attributed to reduced mobility during cooling at higher degrees of cure [21].
Figure 4 shows shift factors and the corresponding fits following eq. 9. Generally, the slope of time-temperature shift factors log (𝑎𝑇) decrease with cure. Furthermore, to obtain good fitting results the parameters 𝐶1 and 𝐶2 are fitted individually. The individual Parameters can be found in Table 5.
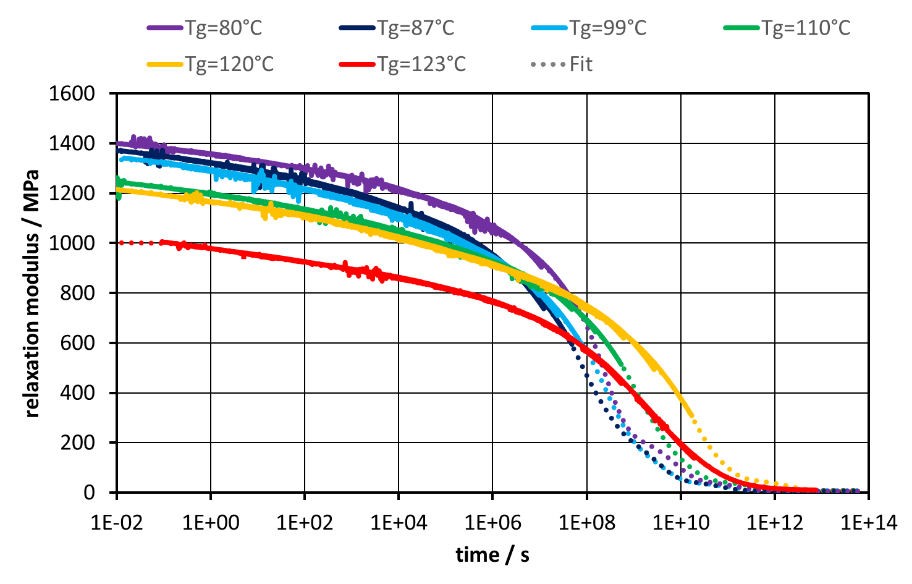
Figure 3 : Prony series fit with 𝑛 = 13
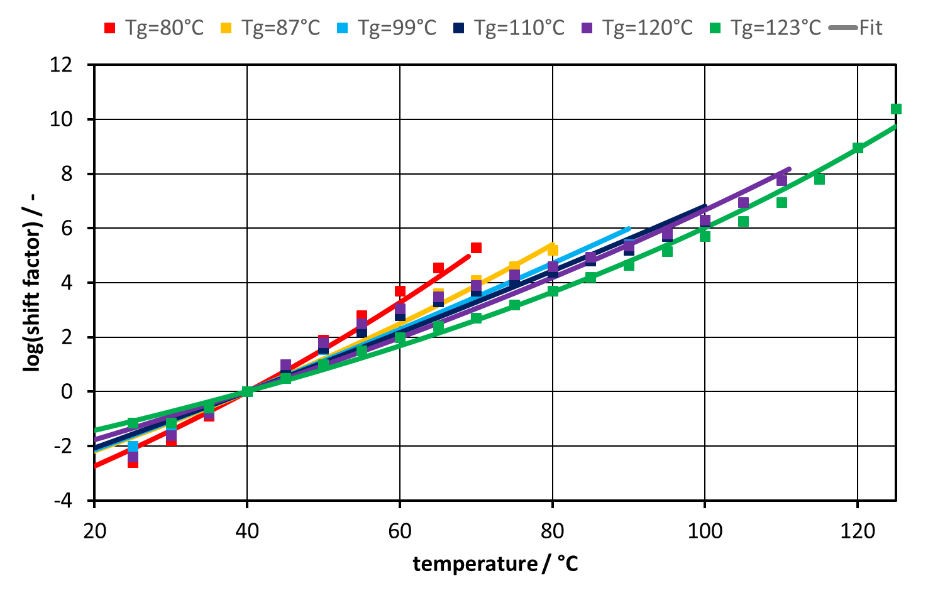
Figure 4: Comparison between shift factors from master curve generation and function fitted (cf. eq. 9)
Table 5. Parameters of eq. 9.
|
𝑇𝐺(°𝐶) |
80 |
87 |
99 |
110 |
120 |
123 |
|
𝐶1 (−) |
40.0 |
40.0 |
80 |
100.0 |
45.0 |
29.81 |
|
𝐶2 (°𝐶) |
180.0 |
240.0 |
600.0 |
800.0 |
300.0 |
175.33 |
3.2 Simulation results
In a first step, a verification of the suggested approach was performed by using the unit length cube model. A set of simulations were executed in order to simulate time dependence of shear modulus. Therefore, simulations at different temperatures between 20°C and 130°C in 5 K steps and varying 𝜉 = 𝜉𝑘 were performed. Figure 5 shows exemplarily depicted results for 𝜉 = 1.0 in comparison to input data of the experimental relaxation tests. It shows that simulation data is in good agreement with experimental data and the material behavior is reproduced correctly.
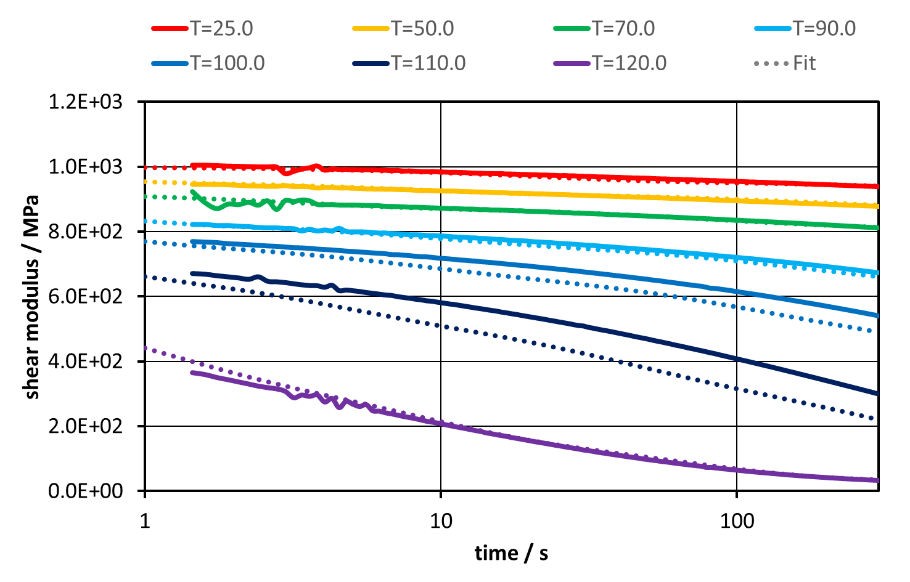
Figure 5: Comparison between input data and simulation data
In a second step, the material model presented was used to compute the displacement of the outer surface of a RVE after a generic cure cycle. The generic cure cycle consists of 4 phases (cf. Figure 6). First, the model is heated up from 60°C to 120°C with 20 K/min. In the second step, the model is subjected to a constant temperature of 120°C for 20 min in order to completely cure the resin. Afterwards, it is cooled down to 25 °C with - 20 K/min. For a fixed top layer of the RVE the boundary is deleted which represents demolding, and the model is subjected to another 2 min at 25 °C. For simulation in case of a free surface, surface is hindered in moving in positive 2-direction. Figure 6 shows the displacement of an exemplarily chosen node (1-coordinate = 25 𝜇𝑚) the upper surface over simulation time for an unconstrained surface. The evolution of displacement in thickness direction (U2) is mainly driven by chemical shrinkage during second stage and thermal expansion during cooling at third stage.
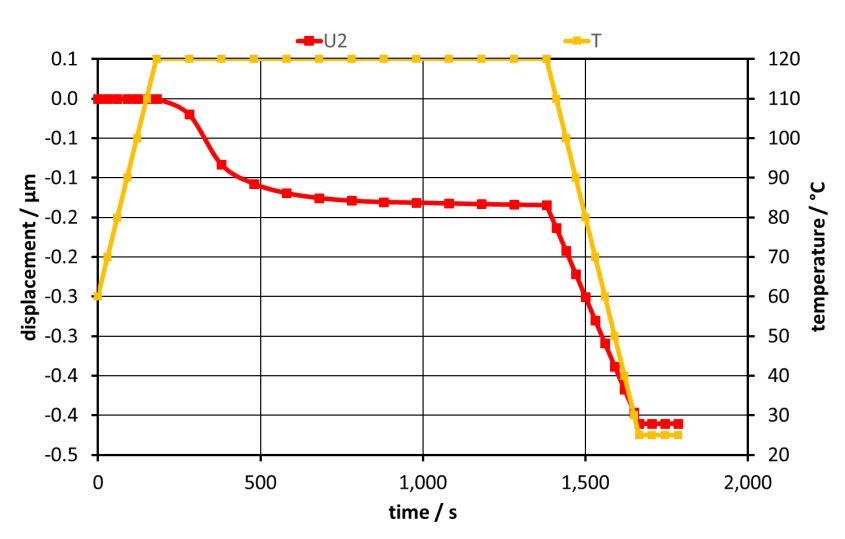
Figure 6: Displacement during cure of an exemplarily chosen node on the free surface
Figure 7 shows the deformation of the RVE using the cure-dependent visco-thermo-elastic material model. The results show that, regions with fewer fibers yield a higher deformation after completion of the cure cycle.
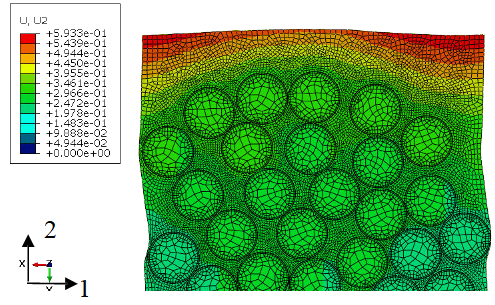
Figure 7: Deformed RVE (scale factor:10) calculated with cure-dependent visco-thermo-elastic matrix behavior and a free part surface during cooling
Figure 8 shows displacement in thickness direction of the top layer of the RVE for different material models and boundary conditions. The curves denoted with simple correspond to the visco-thermo-elastic material model from [10]. The model captures only time-dependent material behavior at fully cured stage during cool-down. In contrast, curves denoted with cure-dependent capture cure-dependent material behavior according to the suggested approach. This results mainly in additional contraction of the material due to chemical shrinkage and a different relaxation behavior at lower ξ.
The results for a fixed top layer differ only slightly, due to fixed surface and high relaxation at higher temperatures of residual stresses mainly induced by chemical shrinkage. Comparing the results to a free surface shows huge differences. This is based on chemical shrinkage due to unhindered deformation (cf. Figure 6).
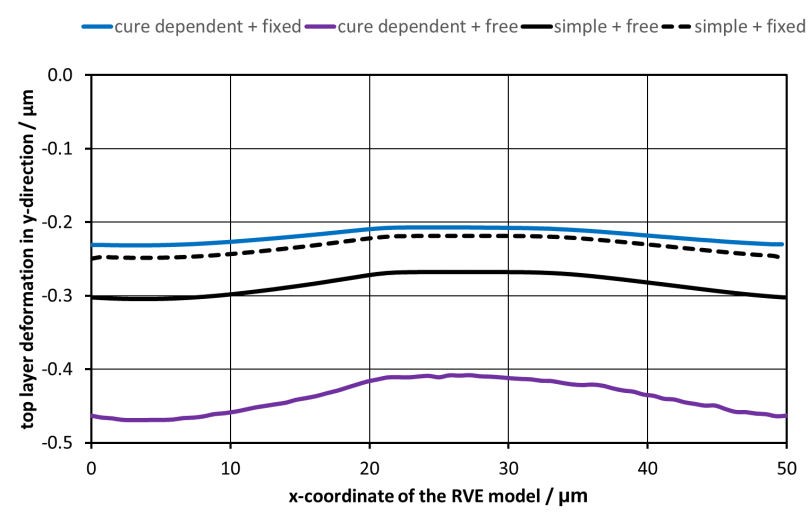
Figure 8: Displacement in thickness direction of top surface of RVE
4 Conclusion
The production of composite materials using fast curing resin systems has gained considerable interest in recent years. However, further advances in quality and reproducibility are required, especially for automotive applications. Component distortion and surface defects resulting from chemical shrinkage and thermal expansion pose major challenges that require costly quality control and process monitoring. The presented work aims at a comprehensive characterization and modeling of the underlying phenomena that lead to surface waviness and part distortions.
In this work, the material characterization of a fast curing epoxy resin based on [10] was extended by cure-dependent mechanical properties and pressure-dependent chemical shrinkage. The experimentally determined results were transferred into a material model to enable numerical studies of surface waviness and part distortion induced by manufacturing process. A RVE modeling method was proposed that allows sensitivity analysis.
In terms of verification, the developed cure-dependent viscoelastic material model shows good agreement with the relaxation test data. Regarding the selected RVE model, the visoc-elastic matrix behavior was shown to have only limited sensitivity to a change of surface the boundary condition. This does not apply to the cure-dependent visco-thermo-elastic matrix behavior. In this case, the boundary condition during processing has a considerable influence on the resulting surface waviness. The assumption of a perfectly fixed top layer during cooling results in a significantly lower surface deformation compared to a free surface since deformations resulting from chemical shrinkage where hindered by the fixed top layer. Overall, the cure-dependent visco-thermo- elastic matrix behavior yields a maximum of deformation for an unconstrained surface.
Future work will focus on verification of the made assumptions and on modelling a multi-scale approach in order to determine surface waviness and part distortion on part level during curing.
Acknowledgement
This research is funded by the German Research Foundation (DFG) within the Project 415849481
