1 Introduction
Mechanical joining technologies are becoming increasingly important for multi-material lightweight constructions, e.g. for car bodies in white. Clinching is a common joining technology without additional auxiliary joining elements. The joining process is characterized by two or more overlapping parts which are joined by forming. A punch and a die are used to create an inseparable form-fit and friction fit connection. The materials on the punch side and the die side are penetrated and radially expanded [1]. The resulting high plastic strains limit the joinability of the material-geometry combinations depending on the formability of the materials [2]. For quality aspects, three geometrical parameters (bottom thickness, neck thickness, interlock) are considered particularly relevant for the joint. For various metal constructions, such as body-in-white, components are usually deep-drawn in order to be pre-formed for the following processes. This pre-forming influences the joinability in relation to the formability of the materials and must be taken into account when designing joints. The influence of the forming history on clinch joints is described in [3] for steel and in [4] for aluminum. It was reported that the pre-forming of the parts has an influence on the joining result. The pre-forming of the punch-side material has more influence on the joining parameters than the die-side material. It has been shown that for both materials the energy absorption of a joint under shear stress is significantly reduced (approx. 70%) when the sheet on the punch side is strained to uniform elongation. In addition, the maximum bearable load decreases significantly (approx. 15%). The influence of pre-strain on the load-bearing behavior of clinched joints was also investigated in [5]. A significant decrease in the loading capacity of the joint (approx. 20%) at a pre-stretch of 5% (uniaxial plastic elongation in tension direction) was determined. The reasons were reported due to combined effect of hardening and pre-damage. Furthermore a study [6] investigated the development of a five-stage simulation process chain capable of numerically predicting the SPR joint geometry and strength under various loading conditions such as shear, transverse tensile and peel stress. The entire process chain considers a 2D axisymmetric model for process simulation and a 3D simulation model with solid-state shell interaction for joint failure simulation. In [7] the pre-stretching of aluminum by pressing or stamping to clinch joint quality is investigated. Three quality parameters (bottom thickness, neck thickness, interlock) and the joining strength were evaluated. The work hardening resulting from the predeformation reduced the ductility and caused some ductile damage to the clinched aluminum work pieces. In the study [8] the influence of forming steps before the joining process on the quality of the joint could be investigated. The influences of strain hardening and variation of sheet thickness on the joint properties were analyzed. In this context, a metamodel based analysis of the clinching process is performed to evaluate the robustness of the clinching process with respect to the different material pre-straining. In summary, the relationship between pre-deformation of the component and the characteristic joint properties, as simulated in study [8], is here extended by a subsequent shear load capacity simulation. This further development makes it possible to investigate the relationship between the presented characteristic parameters and the effective maximum shear force.
2 Methodical approach
The methodological approach used in this work is based on the study in [8]. This method was further developed to determine the influence of sheet pre-strain on the load bearing capacity, taking into account the change in the characteristic parameters. In principle, the method works via a condensation of individual calculation steps, in the middle of which is the FEM simulation. In total, three different FEM models (A B C) are connected in series to investigate the effect of pre-strain on the joining process and the load-bearing capacity. As a result, meta-models can be generated from this sensitivity analysis, which represent the influencing relationships as well as the limits of the joining process. In total, the approach consists of six different steps. Each individual model that differs in the level of pre-strain passes through all of these steps.
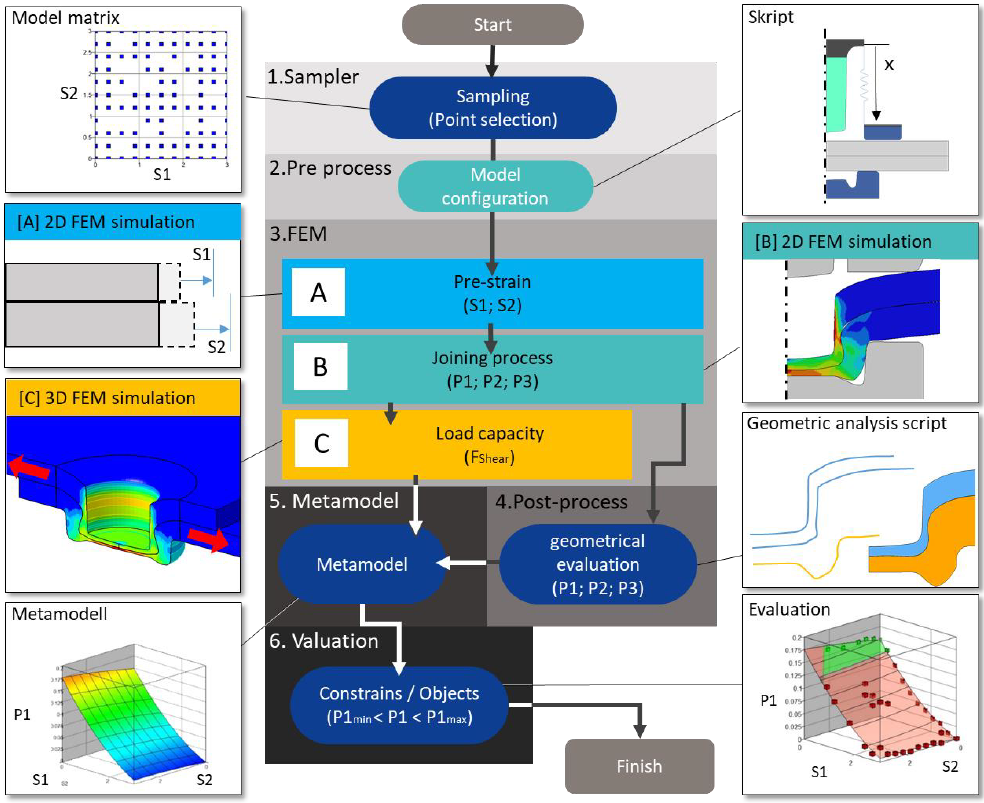
Figure 1 Further developed methodological approach.
Figure 1 shows a flow diagram of the multi-step process which was set up in the LS-OPT software and contains modules from LS-Dyna, LS-PrePost and Matlab. In the first step (1. Sampling), individual models with discrete pre-strain values for the top and base sheet are defined based on the specified parameter spaces. These are summarized in the model matrix. Minimum and maximum parameter constraints define the parameter space to be analyzed. A full factorial model with seven values for each parameter (in effect 49 models) is selected for point selection. In the next step (2. Pre-Process) the individual FEM models are built according to the parameters (S1; S2). The models do not differ except for the value of the pre-strain. Thus, all models considered in this study are calculated with the same tools and process parameters. The third stage (3. FEM simulation) is divided into three simulation substeps (A B C). In submodule A, the plates are pre-strained depending on S1 and S2 in a 2D symmetric simulation. In B, the actual 2D clinching process is calculated. In C, the 2D joint mesh calculated in the process model is tested with respect to maximum transmittable shear force. In the fourth step (4. post-process), the meshes calculated in process model B are evaluated with a MatLab script with regard to the three characteristic parameters for clinch joining (bottom thickness, interlock, neck thickness). The fifth stage (5. Metamodel) uses the three geometric parameters determined in the post process and the maximum possible shear force determined in the third stage (3. Fem Simulation) to create metamodels. The metamodels are then evaluated in the sixth step (6. valuation) with regard to various criteria.
3 FEM simulation
The presented methodic requires the numerical simulation steps (A B C). These steps build on each other and are evaluated in the pre-process by different Matlab and Ls-PrePost scripts.
3.1 [A] Pre-forming
Prior to the joining process, the sheets are simulated to be pre-strained to defined degrees of deformation. The pre-strain of the parts to be joined in the simulation is to represent the process-induced strain or forming as it is common in the production of components. The pre-deformation leads to an increased yield strength and to a thickness reduction of the parts. Figure 2 shows the relationship between the reduction in sheet thickness and the degree of deformation achieved by pre-strain for HCT590x in t= 1.5mm. On the left side, the degrees of deformation achieved are shown for elongations from 5% to 30%. On the right, the correlation between plastic strain and thinning is summarized.
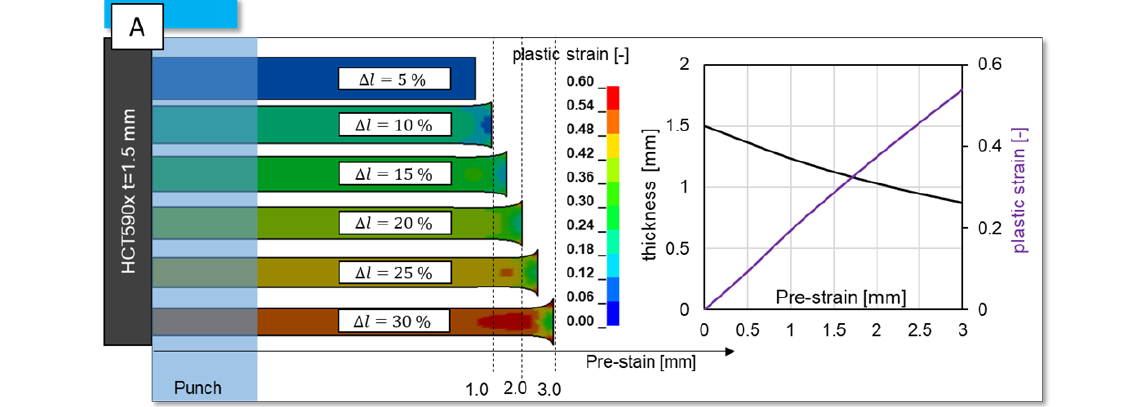
Figure 2 Correlation between the simulated pre-strain and the resulting sheet thickness and plastic strain hardening. [8]
3.2 [B] Joining process
After the sheet metal preforming in [A], the joining process will be calculated. The results (the formed mesh with pre-load) of Clinch joining process FEM simulation [B], are used in the next step [C], a loading simulation to investigate the influence of the pre-strain on the load capacity. The joining process as well as the pre-straining is calculated as 2D rotational symmetrical. Figure 3 illustrates the joining process model used. To enable a validation of the simulation model, the tool geometries and process parameters correspond to the experimental test setup. For the calculation of forming processes, a remeshing is essential. This means that the areas of strong deformation and resulting local element penetration or extreme element distortion are remeshed and the nodes and element data are mapped from the old mesh to the new one. During the calculation, the algorithm holds a previously selected characteristic element length of the mesh. It changes, the total number of elements from start to finish as the mesh is refined. The tools (punch, blank holder and die) are required for sheet metal forming.

Figure 3 Overview of the [B] 2D Clinch process model. [8]
The process is indicated by the displacement of the punch. The end position of the punch contributes significantly to the residual bottom thickness. Furthermore, a preload is applied to the blank holder. This results from a predefined preload and the tension of the spring element. All tools (punch, blank holder and die) are considered elastic in the simulation. The movable tools (punch, blank holder) are mounted on rigid auxiliary parts in order to achieve a homogeneous force distribution in the blank holder. The static friction coefficients (shown in Fig. 3) describing the contact of the corresponding parts were determined inversely by simulation, the values represent an average value of the complex friction condition, this is a simplification that leads to valid results and generally agrees with the literature data. Essential for the numerical calculation of forming processes is the flow curve of the materials, which describes the flow stress versus the equivalent plastic strain. Tensile tests under quasi-static loading were carried out to determine the plastic material behavior. The flow curve implemented in the process model for the steel used (HCT590x) is shown in Figure 3. The curve was extrapolated using the Ludwik-Hollomon approach.
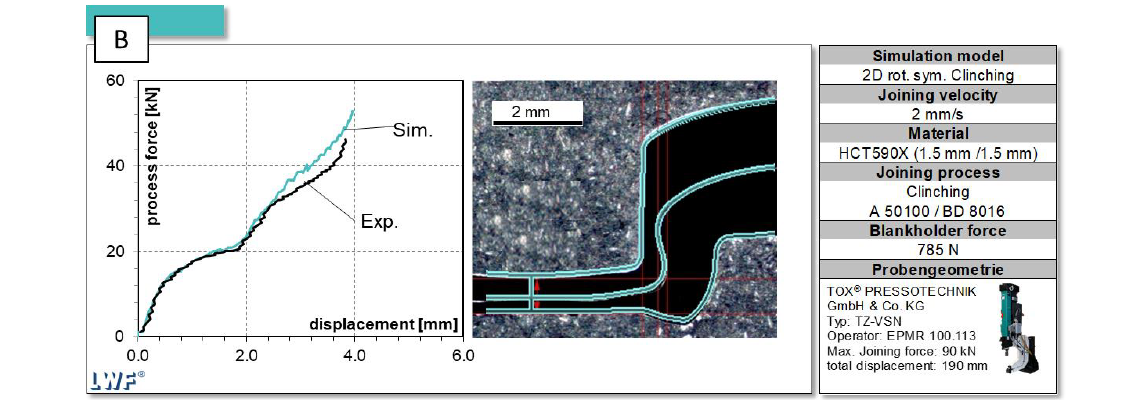
Figure 4 Comparison [B] process simulation and experiment.
The 2D process model is validated by comparing the simulated results with experimental data. In this paper, validation is only briefly presented, since the 2D process model has already been presented in [8]. The experimental sampling was set on a TOXPressotechnik system type TZ-VSN. Tools with the designations A50100 and BD 8016 were used to set a joint valid according to DVS/EFB 3420. The joining speed for forming the clinch joint was set to 2 mm/s in order to minimize possible strain rate hardening. For validation, two characteristics were compared between the 2D process simulation and experiment. First, the simulative determined force-displacement curve is compared with the experiment. The qualitative comparison is shown in Figure 4 on the left. The general experimental curve is reproduced correctly; at higher forces (from approx. 30kN), the process force is slightly overestimated by the simulation. Furthermore, the simulated joint contour is compared with an micrograph. The simulated clinch joint corresponds geometrically to the micrograph. The validation was carried out on a joint using sheets that had not been prestrained. Based on the comparison with the experimental investigations, it is assumed that the FEM model is valid.
3.3 [C] Load capacity test
Starting from the output file of the 2D process model [B] (a formed mesh with internal stress and strain), a 3D model is generated by a 180 ° rotation around the symmetry axis. A Matlab script evaluates the sheet thickness of the top and base sheet. These values are needed to adjust the height of the 3D shear test specimen. A script for each different sheet pre-strain to be examined automatically performs a height adjustment (h1; h2). In a final step, the 2D to 3D mapped clinch joint and the adjusted 3D specimen are connected via a TIED_CONNTACT, to form a final 3D simulation model of a shear test specimen. The contact setting between the sheets is defined by a static friction coefficient. Figure 5 shows the mapping procedure and an overview of the 3D shear load model. This procedure is similarly described in [6] and had a good accordance between the simulated and experimentally determined force curves.

Figure 5 Mapping from 2D to 3D to generate a 3D shear stress test model.
The assembled shear load test model is tested with regard to the maximum transmittable shear force. For this purpose, the model is constraint on one side and loaded on the opposite side, exactly as in the experiment. In order to achieve faster calculations and thus a higher simulative practicability, only half of the real specimen is calculated due to the symmetry. All nodes on the symmetry surface are set to a global constraint to achieve a real symmetry condition. To measure the force transmitted through the displacement, a CROSS_SECTION is defined, which measures the force transmittable in the direction of displacement. The specimens geometry as well as the simulated test procedure correspond to the shear load test according to DVS/EFB 3480-1. The experimental shear load tests were carried out on a universal tensile testing machine of the type Zwick Z100. The testing velocity is 10 mm/min in order to prevent strain rate effects. The displacement of the specimen was measured locally using a tactile extensometer. The shear load force was determined by means of a system integrated load cell. Figure 6 shows the comparison between the result of the shear stress simulation for non-strained sheets and the experimental generated data.
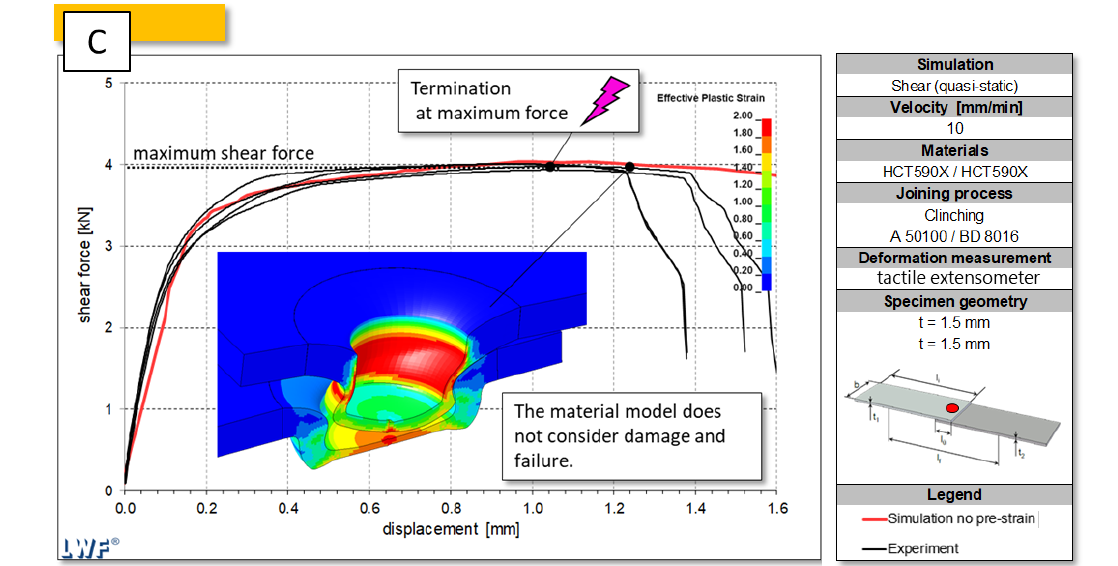
Figure 6 Comparison of the simulated and experimental shear force curves.
The simulation model is valuated with regard to the maximum force occurring under shear load. The simulation model does not consider a material damage or failure, so that a prediction of the failure behavior is not possible. Consequently, there is no decrease of the shear load force in the simulated curve (red), which was indicated by a neck crack in the experimental investigations (black). The experimentally tested specimens fail in mixed fracture mode, i.e., a combination of neck cracking and button separation. The illustration in the center of the diagram shows the 3D model under shear load at the experimentally determined failure time. The following shear load models tested were interrupted at the time of maximum force in order to ensure an efficient calculation. Due to the close fit of the force-displacement curves, the simulative approach can be considered as valid.
4 Results
The results calculated by the presented methodology are first evaluated with respect to the influence of the pre-strain of the individual sheets (S1; S2) on the shear force curve determined in the model. Based on the shear force curve determined in the model without pre-deformation, which was taken for model validation in figure 6, the influence on this curve with regard to pre-strain is shown in figure 7. In total, three diagrams are shown, which are based on the same simulative generated results. Different influences can be recognized by the different colored curves and the type of presentation. In diagram 7a, the force-displacement curves are colored taking into account the pre-strain of the top-sheet S1. The pre-strain of the top-sheet (S1) leads to a lower transmittable force and results in a reduction of the maximum force. A pre-strain of 0.0 mm of the S1 sheet metal is indicated by coloring in blue, the maximum pre-stretch of 3.0 mm can be detected by the red coloring. The transmittable shear force is reduced from 4.0 kN without pre-straining to 2.0 kN with pre-straining of 3.0 mm or forming degree 0.53 by straining the top-sheet S1. The curves with a low level of pre-strain S1 show that the shear force increases slightly, which results from the strain hardening of the base sheet S2. The color distribution shows the proportional relationship between pre-straining S1 and the reduction of shear force. This behavior can be explained by the pre-strain of the base sheet. In diagram 7b, the curves are colored in relation to the pre-strain level of the base sheet S2 similar to the previous diagram (the curves with 0 mm strain are colored blue). Significant force drops are only noticeable from a pre-strain S2 of more than 1.2 mm of the base-sheet. These rapid force drops in the curve progression are the result of the failure caused by the button separation of the joint. In this case, the force level is not reduced as in the case of prestraining via S1, but an early disengagement of the connection occurs. Consequently, as in [3], the same finding was made, the prestrain of the top sheet has a more significant influence the maximum transmittable shear force of the connection than the strain of the base sheet. The pre-strain of the base sheet leads to earlier failure by button separation and, consequently, in a rapid drop in the force-displacement curve calculated in the simulation. The diagram c) of figure 7 shows all simulative determined shear-force curves in a 3D view.
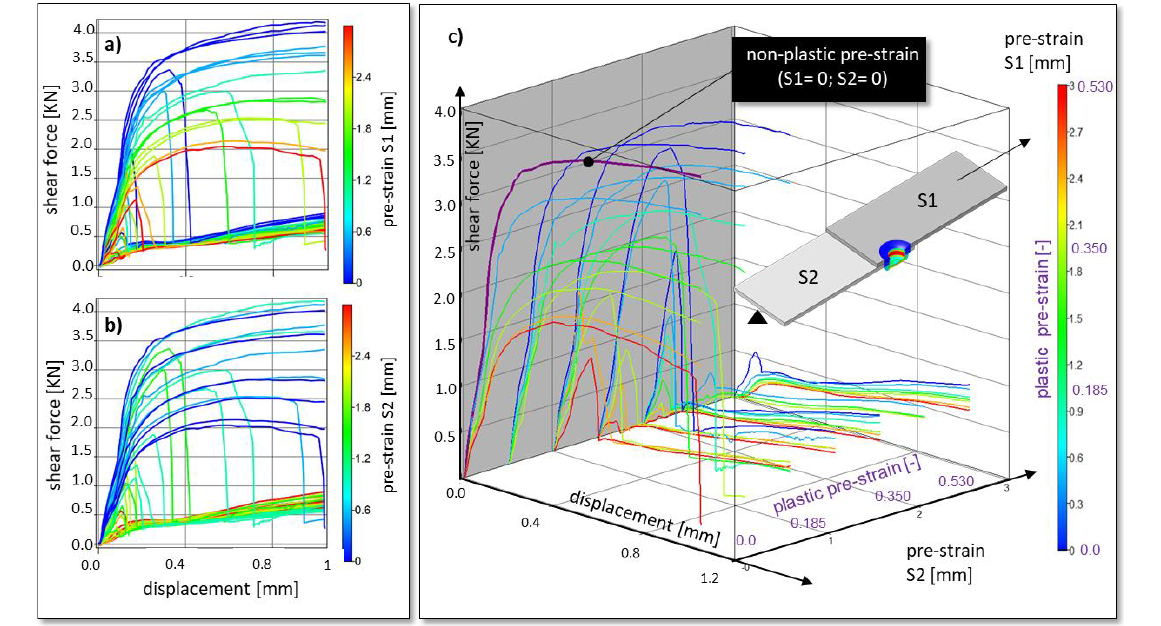
Figure 7 Influence of pre-strain on the shear force curve. a) Top-sheet pre-strain influence (S1) b) Base-sheet pre-strain influence (S2) c) 3D diagram of pre-strain influence
The influence of the pre-strain of the base-sheet (S2) is visualized via the third space direction on the shear force curve. The influence of the pre-strain of the top-sheet (S1) is shown by the coloring. The pre-straining of the top-sheet and the base-sheet via the parameters S1 and S2 leads to a direct influence on the shear force curve, as it is shown in the views 7a and 7b. View 7c shows that the significant rapid drop in force occurs from a pre-strain of the base sheet greater than 2 mm (forming degree 0.35) for all force-displacement curves. In addition, this results in a significantly reduced transmittable shear force (less than 1 kN) by the joint. The influence on the maximum transmittable shear force is evaluated and compared with the geometric values the characteristic geometrical values P1, P2, P3 of the clinch joint. Figure 8 shows the influence of pre-strain on the characteristic geometric values as well as on the maximum shear force. Each value P1, P2, P3 and Fshear has its own individual influence diagram. These show the results calculated by the simulation model and are represented as points dependent on S1 and S2. The metamodel shows the relationship between pre-strain and influencing as a surface plane. The points are classified as feasible or infeasible. This evaluation is done by defining a limit value in advance. If the residual neck thickness P2 or the interlock P3 falls below a minimum limit value, the calculated point is declared as infeasible. In addition, a limit was selected for Fshear. This limit is selected as the minimum shear force. The limits are shown on the metamodel surface as a dark blue line for the interlock and as a red line for the neck thickness. The yellow line on the metamodel for the maximum shear force describes the minimum load limit. The green surface shows in which areas of the pre-strain of the top sheet S1 and base sheet S2 the clinch joint is valid. The exemplary limits chosen in this paper are primarily intended to be demonstrative. In principle, the limits are always defined with regard to the application of the joining process. The bottom thickness is the value that is especially relevant for the non-destructive quality control of the joint. The bottom thickness changes slightly under the variation of S1 and S2. It does not fall below the minimum thickness even with higher pre-deformation of the sheets. The variation can be explained by the hardening of the material under plastic deformation and consequently by a changed elastic spring back. The neck thickness P2 is influenced by the pre-deformation S1 and S2. The neck thickness P2 increases due to pre-strain of the base sheet S2. If the top sheet is pre-formed above S1, the neck thickness P2 is reduced until it falls below the defined minimum value (red line). This limit value is not reached. The dark blue line is not defined by the neck thickness but is transferred by interlock P3 as a limit value into this diagram. The pre-deformation S1 and S2 also has an influence on the interlock P3. The influences are not only opposed to each other as in neck thickness P2, but also have a significantly different weighting. S2 has a significantly stronger influence on the formation of the interlock. In case of pre-straining the base sheet, the interlock decreases rapidly and falls below the selected minimum value (dark blue line) quickly. The last diagram shows the influence of the pre-straining of the sheets via S1 and S2 on the resulting maximum shear force. Here it can be seen, that the form of the feasible area changes. Derived from the quality relevant parameters the feasible area is limited by a preforming of the base sheet S2 until a value of 1.0 mm and not limited to the preforming of the top sheet S1 until a value of 3.0 mm (rectangular form). Depending on a estimated required load bearing capacity the feasible area shows a triangular form.
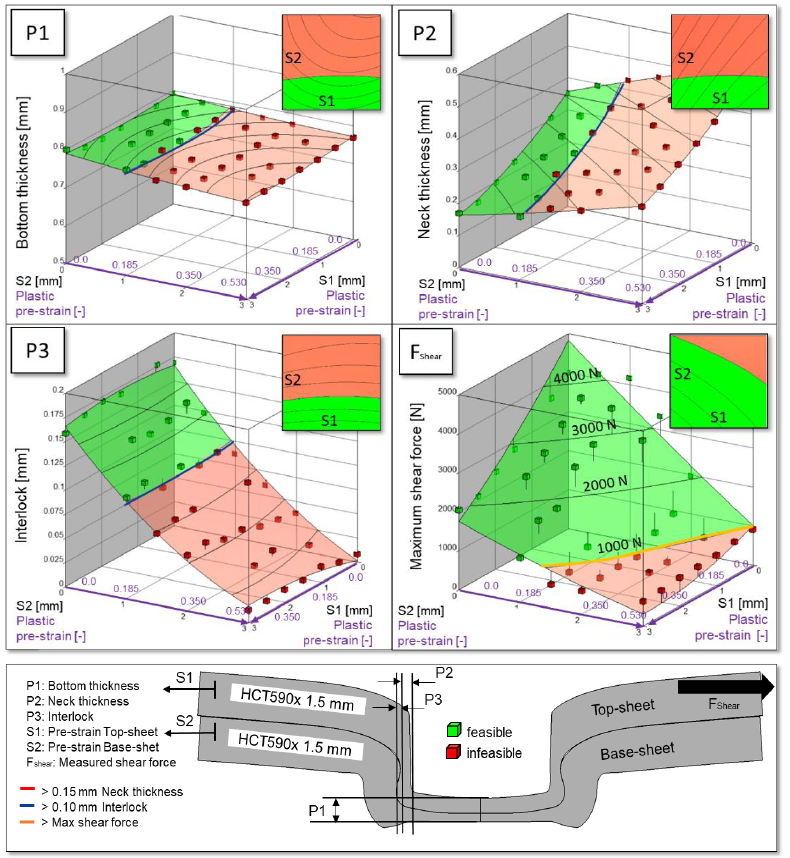
Figure 8 Influence of pre-strain on the characteristic geometric quantities of the clinch joint and the maximum transmittable shear force
Figure 9 shows the determined metamodels and the described limits as area diagrams. For an estimated required max. load capacity, eg. 1.0, 2.0 and 3.0 kN the feasible area for the shear loading is fully or partially covered by the area derived from the quality relevant parameters. For 1.0 kN required maximum load the area is completely covered (lower left), in this case the consideration of the quality relevant parameters leads to secure reaching of the load bearing capacity. This changes for required load bearing capacitys of 2.0 kN (lower centre) and even more for 3.0 kN (lower left). Here the reached max. force falls under the limit especially when the forming of the base sheet S2 increases. There for we conclude, that in the construction of preformed parts an exhaustive use of the joints load bearing capacity has to be secured not only be quality relevant aspects but also on the measured or simulated load bearing capacity of the joint.
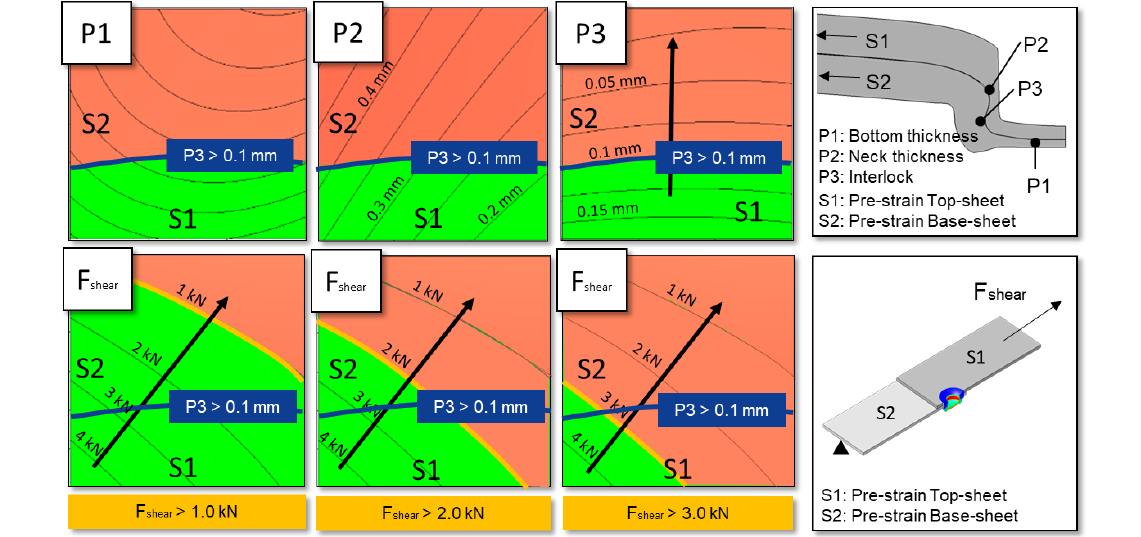
Figure 9 Correlation of the limits of joinability from geometric characteristic values with the limit of the maximum transmittable shear force.
5 Summary
In this study, a numerical method presented in [8] is further developed to analyze the influence of forming processes (forming history of the parts to be joined) prior to clinching processes. This method now makes it possible to find correlations between the occurring preforming effects (pre-strain leads to joint part thickness reduction and material hardening) with regard to the joining point quality and load-bearing capacity. The setup of the required FEM simulations is presented and validated by experimental investigations on the joining process as well as shear loading the sequential calculation of the prepared models allows an automatic calculation of a number of coupled FEM models. Quality-relevant parameters of the clinched joint as well as the maximum transmittable force under shear load are automatically determined. It could be shown that these methods provide reliable and valid results for the analysis of the clinching process. A sensitivity analysis is presented which shows the influence of preforming on the joining ability of the investigated material-geometry combination. First, the influence on the maximum transmittable shear force was investigated. The similar effects on the force-displacement curve were found as in the investigations in [3]. Then, correlations between the pre-strain and quality-related parameters were compared with the maximum shear force, using the metamodels developed from the FEM calculations. In a final step, the metamodels were evaluated using minimum limits to determine areas. These areas describe feasible and infeasible joints, depending on the pre-strain of the top and base sheet. In an area diagram, the areas determined from the quality parameters are compared with the area calculated from the shear test simulation. In summary, it can be concluded that, in addition to the quality-relevant parameters, the measured or simulated load-bearing capacity of the clinch point must also be taken into account.
Acknowledgements
Funded by the Deutsche Forschungsgemeinschaft (DFG, German Research Foundation) – TRR 285 – Project-ID 418701707.
