1 Introduction
DAMRC have, for 10 years, worked with chatter avoidance [1]-[3] and machining stability [4]-[6] to improve productivity within the industry. Through this work, DAMRC have discovered that increasing tool stickout in milling processes can allow higher productivity. This contradicts with the logic that shorter is better. However, other researchers have reported similar findings [7]-[10]. Initial results showing as much as +20-60% additional MRR, compared to the reference stickout can be achieved. This paper focuses on this phenomenon, referred to as “tool-tuning”. To the knowledge of the author, no application-oriented methods for applying this knowledge exist. Only a research-stage method, called RCSA [9]-[12].
Based on experimental results, this research presents an application-oriented method, less complex and computational demanding than the RCSA method, to provide a rough approximation for the dynamic response for a given tool stickout length, to aid tool tuning.
Scientific papers have been qualitatively reviewed, extracting relevant theories. Experimental measurements on the behaviour of the dynamics when amending tool stickout and simulations on the impact of modal parameters on the SLD has been conducted and analysed. The experiments were done via “TapTesting”, from which modal parameters of the response have been extracted and qualitatively analysed for tendencies – as for the simulations.
Having a static milling setup, productivity, Q is defined by four variable process parameters, axial- and radial depth-of-cut (Ap & Ae), feed per tooth (Fz), and spindle speed (Ω), as the number of teeth on cutter (Z), see (1).

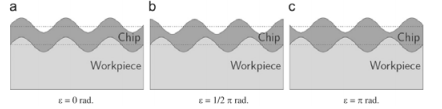
Fig. 1. Vibration patterns for teeth passing being in-/out-of-phase[16]
(a)In-phase process (0rad shift), (b)Partly out-of-phase process (½πrad shift) and (c)Out-of-phase process (πrad shift)
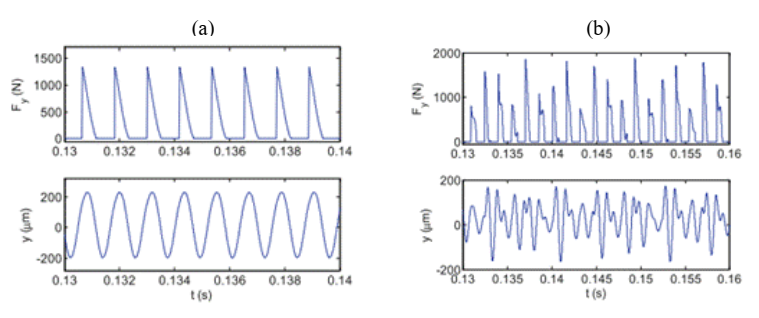 Fig. 2. Cutting force- and displacement plots[13]
(a)Stable cutting conditions. (b)Unstable cutting conditions
Tobias and Fishwick [5] proposed the regenerative chatter theory, leading to the Stability-Lobe-Diagram, which utilizes that only the variable chip thickness is needed to define the stability limit [5][13][18].
Various methods can be used to calculate the SLD –from simple analytical frequency domain algorithms [1][13][18]-[21] to discrete- and semi-discrete as frequency and time domain algorithms- and simulation [13][14][22][23].
One of the methods applied in industry is Tlusty’s refinement of Fishwick’s original work, to accommodate the milling process [13][20][24][25]. This method assumes an average angle of the tooth in the cut, and thus an average force direction, making the system time-invariant [13][20][24]. It is referred to as the Average-Tooth-Angle-approach.
The chatter-free stability limit for the Average-Tooth-Angle-approach is captured by Equation (2) and (3). Equation (2) captures the critical depth of cut limit (mm) (y-axis of the SLD) while (3) captures the spindle speeds (rpm) for milling (x-axis), at which (2) repeats itself. Equation (4) captures the phase-angle based on the system dynamics, and (5) defines the average tooth in the cut, (the tooth averaging Tlusty proposed to handle milling operations) [13][20][24]. Combined the equations constitute the analytical Average-Tooth-Angle-approach Stability Lobe algorithm.
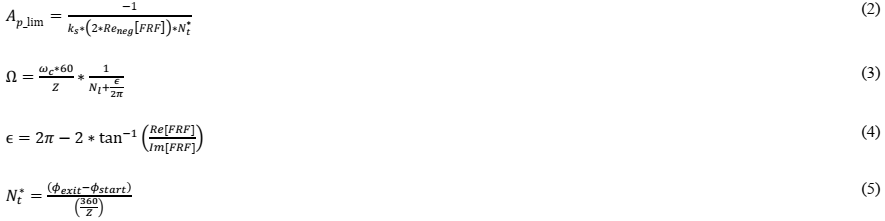
Where ks is the Specific Cutting Force[ N/mm2 ], Nt* the Average Number of Teeth in Cut, Nl the Lobe Number, ɛ the Phase Angle and ф the Engagement Angle. The implementation of the algorithm is presented in [13].
An important input parameter in the SLD algorithm is the frequency response. Continuous FRF can be obtained via modal “TapTesting”, or it can be generated via modal parameters and a modal fitting equation. Andrews [26] presents the peak-picking method from which modal parameters from continuous FRF data can be obtained. These parameters are used in (6) to estimate the FRF.

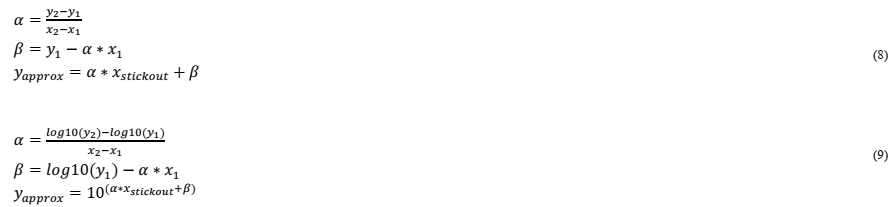
where kn and ϛ is the stiffness and damping ratio for the nth modal mode of the FRF, and rn the ratio between a given frequency, ω, and the natural frequency for the nth modal mode, ωn, giving rn =ω/ωn . kn is given in N/m, ϛ is a unitless ratio, ω and ωn in Hz, and the FRF receptance in m/N.
1.1 Tool-Tuning: State-of-the-art
The first studies on the stability impact of the tool stickout length are made by Tlusty, Smith and Davies et al. [7][8][27] in the ’90s, followed by Schmitz, Budak and Ahmadi et al. [9]-[11][28]-[31]. Papers reveal two strategies for tool-tuning. The first strategy is based on “tuning the tool length such that its natural frequency matches with an integer multiple of the tooth passing frequency” [7][31]. This strategy utilizes limitations in the machining system, e.g. spindle speed, and can be expressed in (7), where α is an integer greater than 0, Ωmax the maximum spindle speed of the milling machine and Z the number of teeth on the tool. If the natural frequency of the most flexible mode is equal to one of the frequencies defined by (7), a stability lobe should be located at maximum spindle speed representing a potential optimal tool stickout.

The second tool-tuning strategy was uncovered by Schmitz et al. [9]-[11] – “a dynamic absorber effect caused by modal interaction between substructures of the machine and the tool” [11][31]. The concept of the dynamic absorber effect is that individual modes of the machining system can interact by varying the length of the tool (or other machine components). At this interaction, an absorber effect is seen resulting in a generally stiffer system, which consequently increases the chatter-free stability limit [31]. This is illustrated by Fig. 3 & Fig. 4, where the longer stickout (10:1) has a higher critical stability limit just above 0,1mm compared to the 9:1 stickout with a limit of ≈0,05mm.
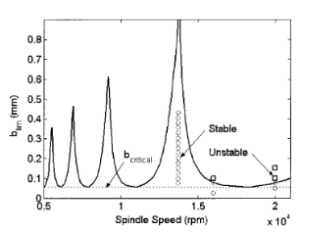 Fig. 3. SLD for 9:1 L:D ratio stickout [10]
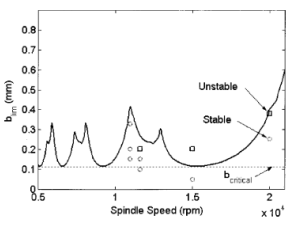 Fig. 4. SLD for 10:1 L:D ratio stickout [10]
1.2 RCSA prediction
The only technique presented in the literature to predict tool point FRF is a technique called Receptance Coupling Substructure Analysis (RCSA). Academic studies have shown that RCSA can predict tool point FRF’s for a given tool stickout with a reasonable precision [9]-[11][29][31].
The basic idea of RCSA is a) Experimentally measuring the machine-spindle-holder and the machine-spindle-holder-tool dynamics via modal testing, and b) Numerically analysing/simulating the dynamic characteristics of the same tool. Using Inverse RCSA on the data, it should be possible to capture “connection coefficients” which represents the effect of the machine-spindle-holder and tool interaction. By knowing the machine-spindle-holder dynamics and the connection coefficients, it should be possible to estimate tool point dynamics for a random stickout or/and tool[10][12][30][31].
2 Studying the Dynamic Behaviour over Tool Stickout
The tool point dynamics (FRF) for multiple tools- and stickouts are measured to understand the behaviour of the dynamics when amending stickout length. The modal parameters (natural frequency, stiffness & damping ratio) of the milling systems are extracted from the obtained FRF data and presented for visual tendency interpretation.
2.1 Test setup & procedure
The experimental data used for the analysis of the dynamic behaviour as the effect of the tool stickout are collected for multiple Vertical Milling Centers, multiple hydraulic tool holders, and multiple endmills.
The equipment used for the experimental measurements includes the following (Fig. 5):
- 352A21(Medium 0,6g) accelerometer, (PCB Piezotronics)
- 8206-001(4448 N) impact hammer, (Brüel&Kjær)(Delrin/POM impact tip)
- Photon+ Data Acquisition
- MetalMax® TXF Software
- Digital calliper (TESA-TWIN-CAL)
- 10Nm torque wrench for tool mounting.
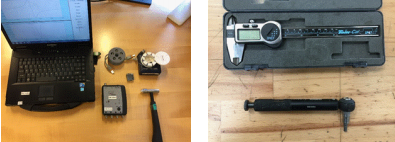
Fig. 5. Test equipment for the experimental study
The tool is mounted in the hydraulic holder with an appropriate tool bushing at a specific tool stickout (Fig. 6) and tightened using 10Nm torque wrench. The tool stickout is defined as the length from tooltip to the neck of the tool-bushing. An accelerometer is attached to one of the tooltips (Fig. 7), using the wax supplied with the TapTest equipment.
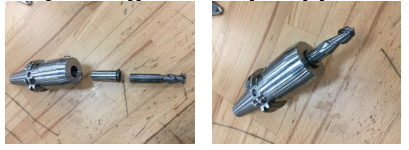 Fig. 6. An unassembled- (left) and an assembled (right) tool-bushing-holder.
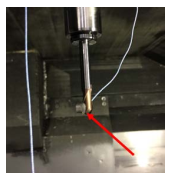 Fig. 7. Mounting of accelerometer
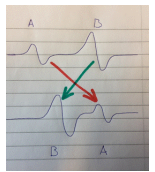
Fig. 8. Illustration of two modes changing the order.
The tool is struck multiple times in the X- and Y-direction (90 degrees to each other), and the averaged FRF is generated. It is sought to achieve coherence between the measurements of at least 83,3%, preferably above 95%. These measurements are taken for every tool stickout in test-scope.
Measurements are made for two vertical milling machines (Variaxis630-X5 & DMU60eVo), three hydraulic CoroChunk930 tool holders (I40-P-12-103, I40-HD-20-097, HA06-HD-20-104) and six different solid end-/ballmills. See the measurement overview in Table 1. ”Increments” in Table 1 defines the stickout increments for at which modal measurements are taken.
Table 1. Overview of experimental measurements
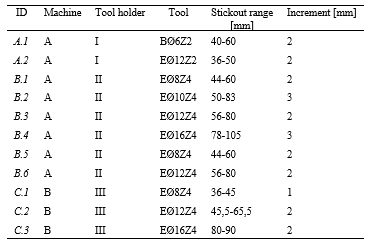 A:Variaxis630-X5, B:DMU60eVo.
I:I40-P-12–103, II:I40-HD-20–097, III:HA06-HD-20–104
B:Ballmill, E:Endmill, Ø:Tool diameter, Z:Number of teeth
The obtained FRF data characterizes the multi-degree-of-freedom system. To analyse for tendencies, the modal parameters related to the respective “modes” of the system are extracted for each tool stickout. Extraction is done using the modal fitting methodology presented in [13], for the 3-5 most dominant modes of each FRF measurement (depending on the degree-of-freedom of a given system). The most dominant modes i.e., the least stiff modes are found for the shortest measured tool stickout. The stickout measurement for the shorter tool stickout is used as a reference to the subsequent data extraction and “mode coupling”. A governing assumption for data processing is that the order of the modes can change as tool stickout increases, as illustrated by Fig. 8).
2.2 Results
Analysing the stickout measurements, some generalizable tendencies are identified on the behaviour of the modal parameters. Fig. 9 to Fig. 11 visualizes the change in the modal parameters for four sets of measurements.
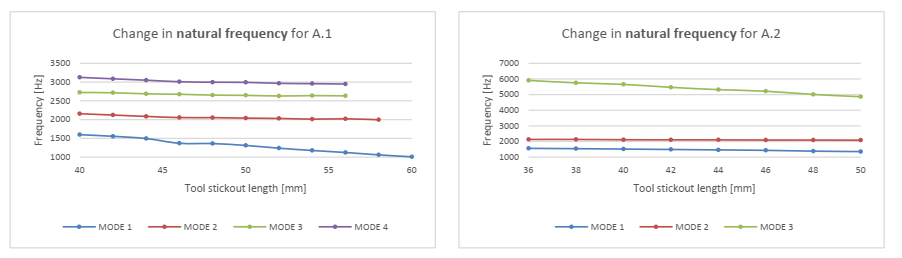
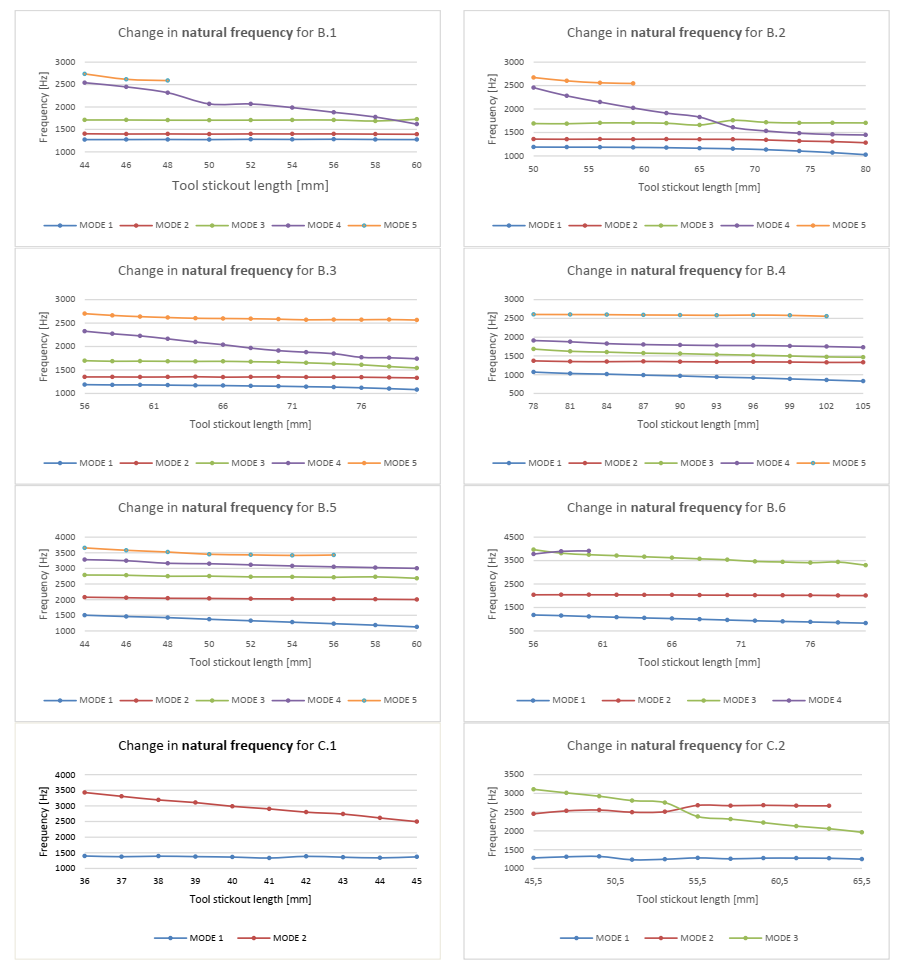
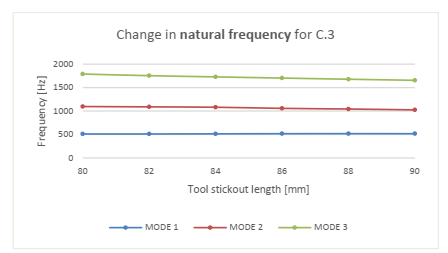
Fig. 9. The change in the Natural Frequencies as function of tool stickout.
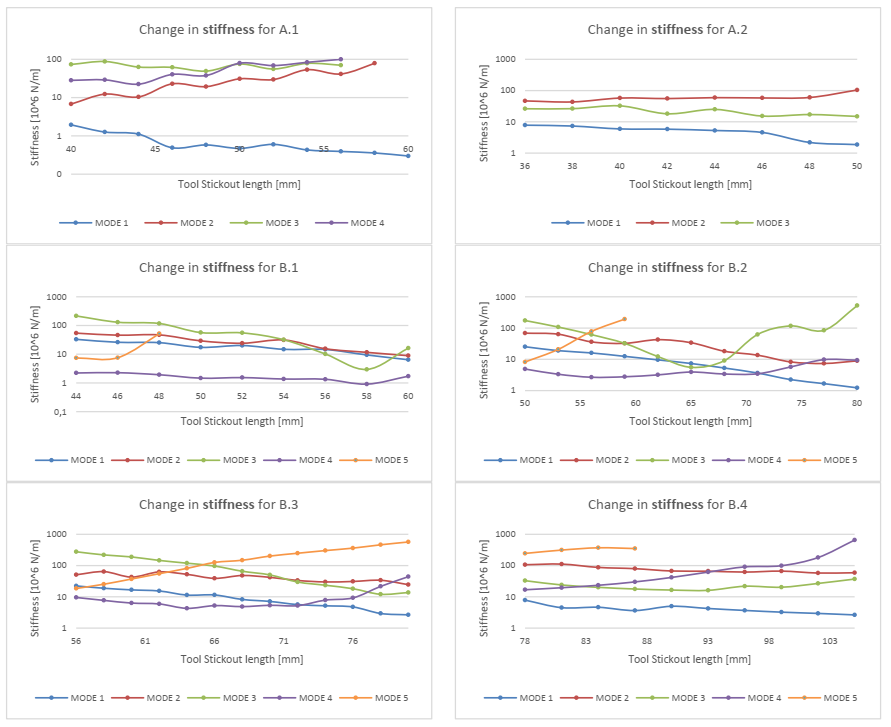
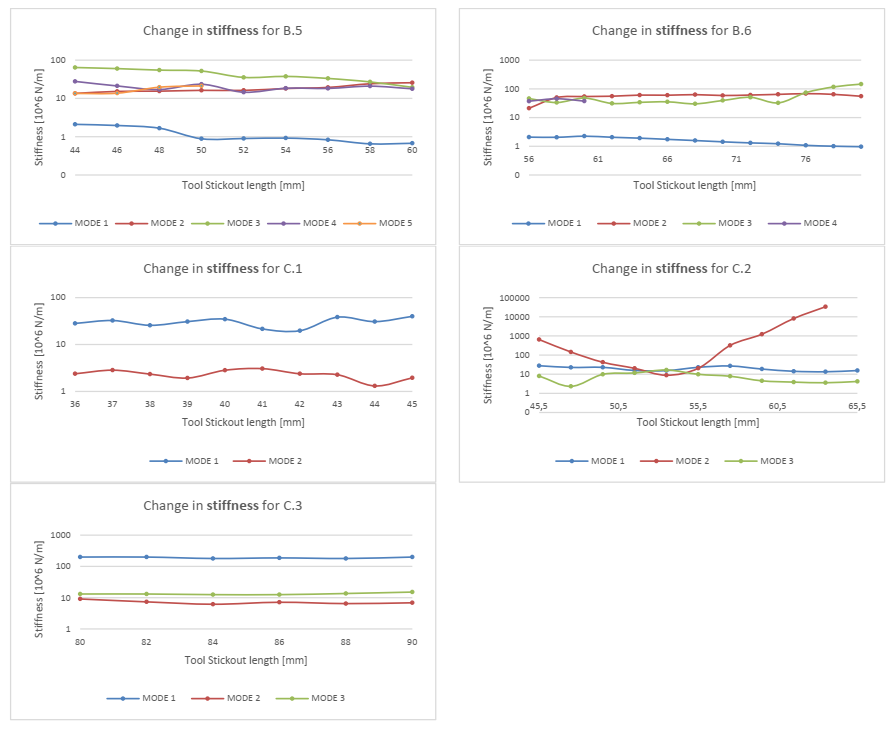
Fig. 10. The change in the Stiffness as function of tool stickout.
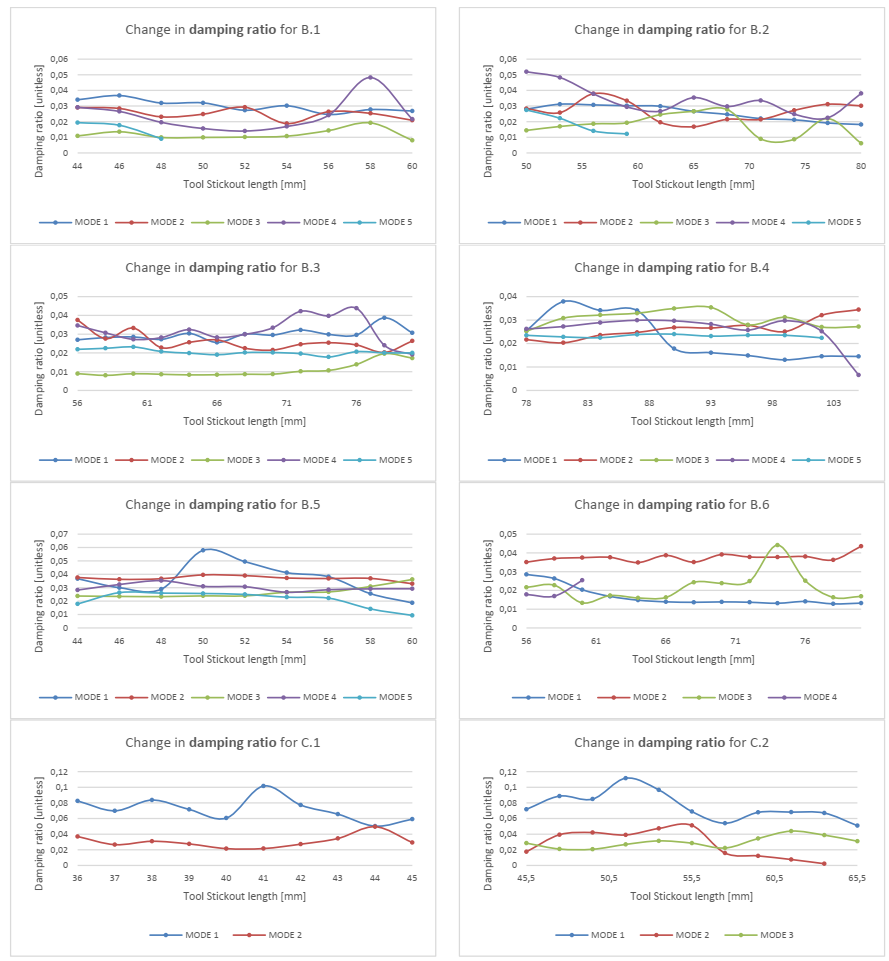
 Fig. 11. The change in the damping ratio as function of tool stickout.
Interpreting the graphs from Fig. 9, a tendency is found that the natural frequencies is dropping almost linearly with increased tool stickout length - with minor variation. This is especially evident in the datasets A1, A2, B1, B3 – B6, C1 and C3. For B2 and C2 less linearity is found – however, linearity can be found even though it is with a larger error. For this to be true, it must be accepted that modes can change the order (as described as a governing assumption for the data processing). This indicates that the natural frequency behaviour can be approximated by simple linear relationships – and thus be used to approximate how position of the stability lobes will change, according to equation (3) & (4).
At the tool stickout lengths where two modes change the order (e.g., between stickout 65-68 for B.2), it has been found that both the natural frequency and the stiffness values will behave differently compared with the “normal” linear situation. Using the linear connection of the natural frequencies for the minimum- and maximum tool stickout, it should be possible to predict the tool stickout at which the irregular modal behaviour onsets. However, it will not be able to predict the specific outcome of this absorption effect – neither for natural frequency nor stiffness.
For the behaviour of stiffness exponential behaviour can be observed. By log10-linearizing the data, it becomes reasonable to expect linearity for cases where no modes change the order. Reliability tests have shown that the stiffness value is the least reproducible, from a measurement point-of-view, which might explain the variation observed in the measurements of stiffness.
For cases where two modes change the order, a significant shift in stiffness is observed for the implied modes. This is especially the case for the stiffer mode, which seems to absorb some of the flexibility of the less stiff mode (See Fig. 10, measurement B.2, mode 3- and 4).
For the damping ratio, there is no tendency of how it behaves. Furthermore, high variation is seen from measured increment to measured increment, which makes it impossible set general tendencies for how it will change.
3 Conceptual Solution
A novel method to approximate favourable tool stickouts is presented below. The method builds on the findings, that the natural frequencies are the main driver for the location of the stability peaks, that stiffness primary controls the appearance of the chatter stability, and that both of these, with some error, can be linearly approximated.
The proposed method uses the FRF response from two tap test measurements. One measurement for a reference tool stickout, and one measurement for a longer tool stickout. The response is compared the modes are “coupled” to represent modal conditions for max and min tool stickout (see example in Fig. 12), and the modal parameters are extracted. The extracted data are used in a linear prediction model, which approximates the modal response as a function of tool stickout length. Equation (8) represents the prediction model for the natural frequency and damping ratio, while (9) is the model for stiffness prediction.
 The method has some pre-known limitations, just as its boundary conditions have not been explored jet:
- The accuracy is best for cases with no change in the order of the modes. The accuracy is expected to drop in cases where two (or more) modes change the order.
- If two (or more) modes change the order, the predicted SLD is not valid for any of the approximations – here only the natural frequency approximation might be “valid”.
- If the two FRF measurements cannot be visually coupled, the method does not work.
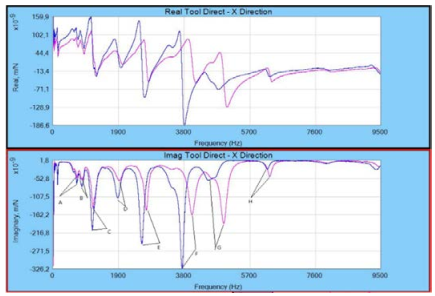
Fig. 12. Example of “mode-coupling” of FRF for the maximum and minimum tool stickout measurements.
The “coupling-lines-” and “letters” show how the modes have been assumed to be coupled.
3.1 Validation Tests
Taking modal measurements using the proposed methodology, the prediction model is sought experimentally validated.
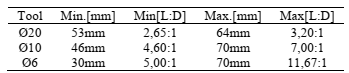
Validation tests are performed using two solid endmills(Ø20&Ø10mm) and one solid ballmill(Ø6), with stickouts as in Table 2.
Table 2. Stickouts for prediction validation tests
To validate the prediction model additional modal measurements were taken for several stickouts within the max- and min. stickout range, to compare prediction with measurements. Fig. 13-Fig. 16 shows some of the validation comparisons for the Ø20- and Ø6 tool. The FRF approximations for the Ø20 tool show acceptable conformance, while the Ø6 approximations are completely invalid. This calls for further investigations to understand when and why the model predicts as expected.
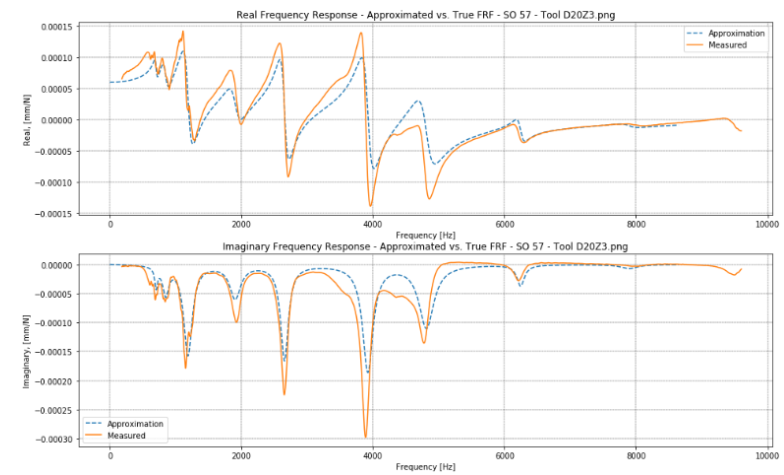 Fig. 13. FRF comparison for Ø20Z3 tool, 57mm stickout
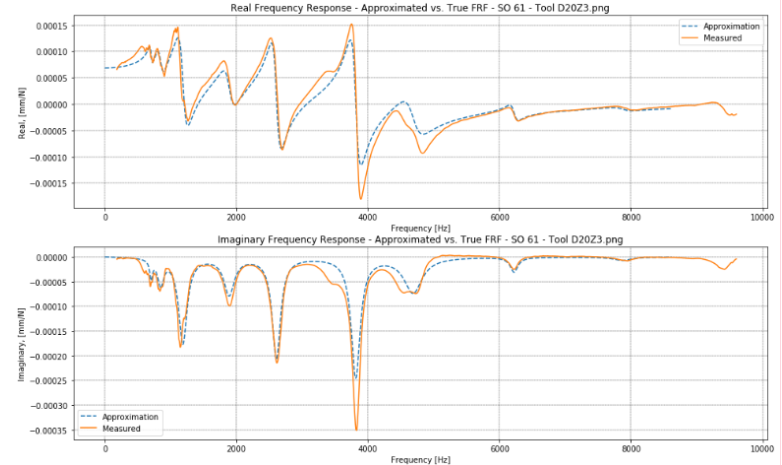 Fig. 14. FRF comparison for Ø20Z3 tool, 61 mm stickout.
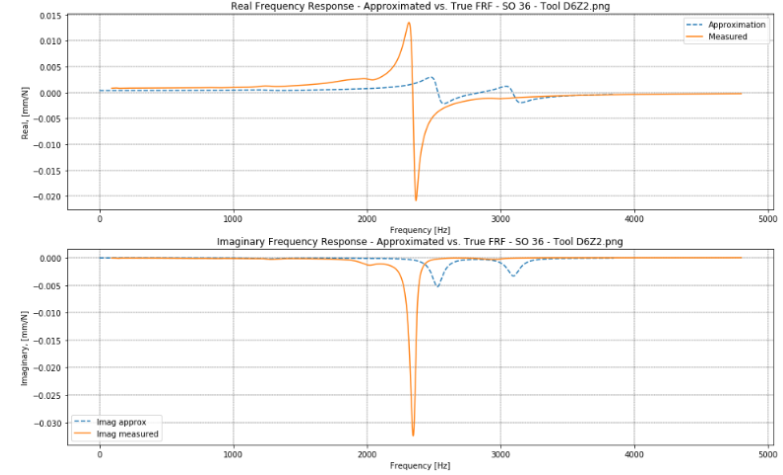 Fig. 15. FRF comparison for Ø6Z2 tool, 36mm stickout
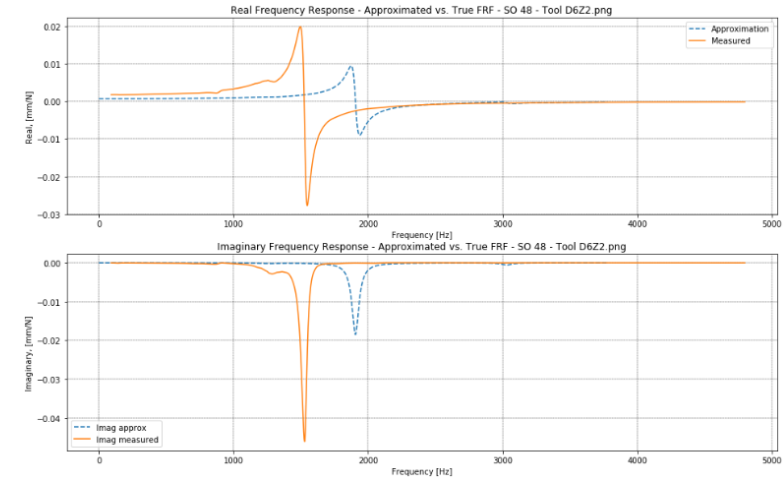 Fig. 16. FRF comparison for Ø6Z2 tool, 48mm stickout
Conclusion
It has been studied throughout this research how amending the tool stickout in a milling system affects the system dynamics and the chatter stability limit, and an experimental tool tuning method has been presented in this paper.
Two methods for “tuning the tool stickout” have been identified; a) tuning the tool length such that its natural frequency matches with integer multiple of the tooth passing frequency and b) a dynamic absorber effect caused by modal interaction between substructures of the machine and the tool. Both strategies can be used to optimize tool stickout with respect to stability and productivity.
Study on the behavior of the modal parameters, which affects the appearance and the position of the stability lobes, has found that by increasing the tool stickout length, the parameters typically change as follows:
- The natural frequencies will decrease for most modes, with varying rate.
- The stiffness of each vibrational mode will increase- or decrease – with tendency to linear behavior if log-10 linearized.
- The damping ratio is unpredictable and shows no tendencies in how it will change.
Furthermore, by testing and validating the experimental tool tuning method, varying results have been achieved. This calls for further investigations on the boundary conditions for which the method can be expected to be valid – and thus operational in an industry context.
