1 Introduction
Machining involves any process where a workpiece is cut into a desired size and shape, by a sequence of processes. This material removal is a consequence of the existent relative motion between the tool and the workpiece, where a given amount of the workpiece’s material will be separated in the form of chip. In machining, the challenge of achieving the highest productivity, is threatened by chatter as it can worsen the surface quality, decrease the productivity, increase both tool wear and noise, and so forth [1][2].
Chatter was first identified by Taylor F. W. [3], who carried out numerous research on metal cutting processes in the 1800s with the aim of improving their efficiency. In the mid-20th century Arnold R. N. (1946) [3][4] explained the chatter generating mechanism and proposed cutting forces as a function of the spindle speed. During the following years, two papers by Tobias S.A. and Fishwick W. (1958) [5], and Tlusty J. and Polacek M. (1963) [6], concluded: “modulated chip thickness due to vibration affects cutting forces dynamically, which in turn, increases vibration amplitudes yielding a process known as regenerative chatter” [3].
Chatter is defined as a self-excited vibration that occurs due to the regeneration of waviness of the workpiece surface. The system will be continuously receiving an amount of energy that is not able to dissipate itself, leading to a destabilization of the system [7]. Fig. 1 shows a two degrees of freedom model of a milling operation presented by Yue C. et al. (2019) [8] where regeneration of waviness occurs.

Fig. 1: Tool and workpiece interaction model by Yue C. et al. (2019) [7]
When the tooth j-1 gets in contact with the workpiece, a wavy surface will be left. Afterwards, the tool will move along Xc axis certain distance, which depends on the feed, until the tooth j starts machining the wavy surface obtained before. This process will be repeated during the whole machining operation, where chips with variable thicknesses will be created due to those wavy surfaces. The variation of the thickness will be determined by the phase between those waves caused by a tooth and its consecutive, as shown in Fig. 2.

Fig. 2: Effect of phase on chip, Quintana G. and Ciurana J. (2011) [1]
Having a variable chip thickness (h) implies a variable cutting force (Fc), which will be the source of energy that the system is not able to dissipate. Varying forces will feed the already existing vibrations of the tool, and this cycle will continue if the previous vibration pattern does not comply with the current vibration pattern [1]. Hence, case a of Fig. 2 would be the ideal situation where the cutting force remains constant as both waves are periodic, consequently avoiding chatter. The cutting force can be described by the next equation (1):

Therefore, chatter will occur when the cutting force is non-periodic. Fig. 3 compares the difference between a stable (top) and unstable cut (bottom), amplitude- and force-wise. As portrayed, both force and vibration amplitude have a periodic behaviour when the cut is stable; and non-periodic when chatter occurs.
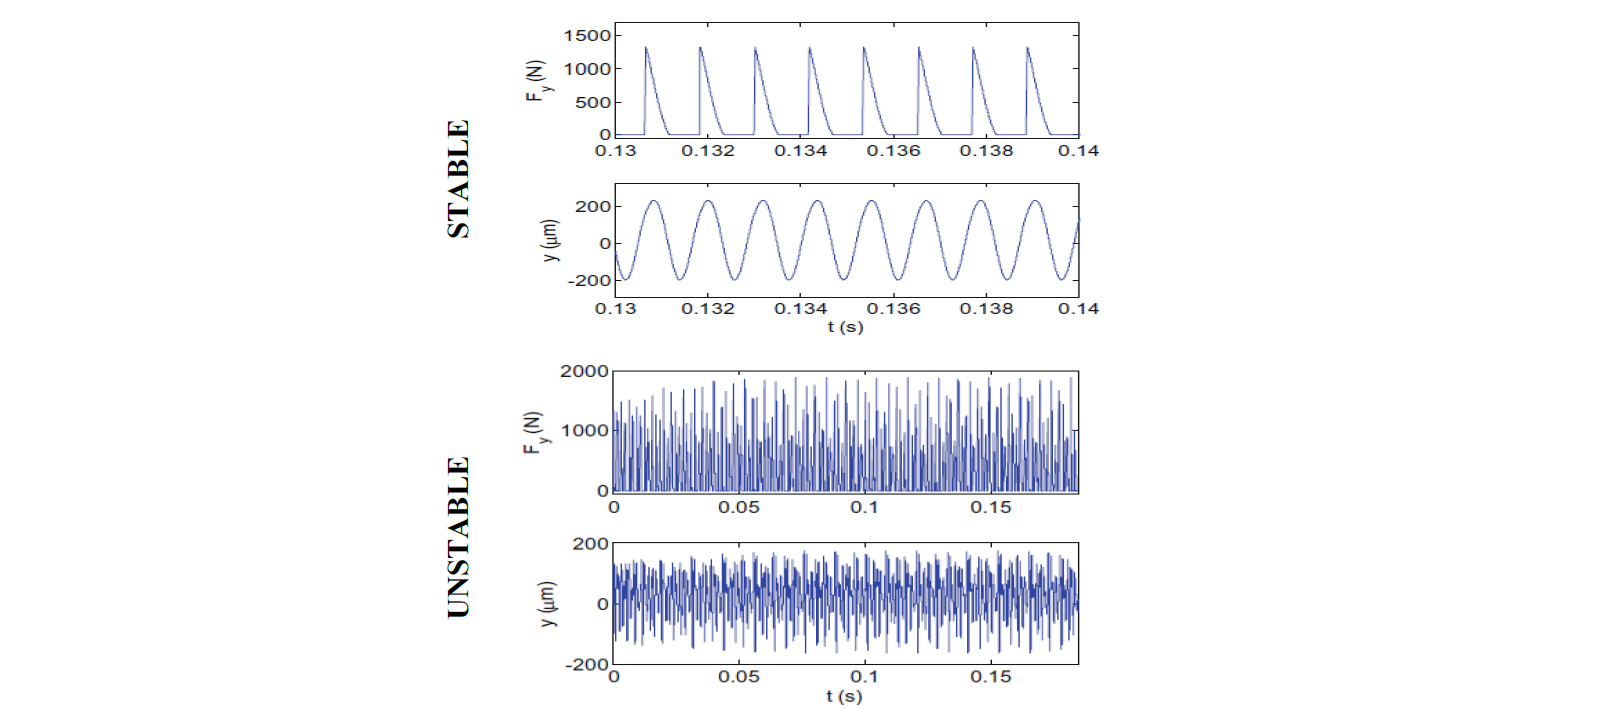
Fig. 3: Forces and amplitudes of a stable (top) and unstable (bottom) cut [11]
Different chatter prediction or suppression techniques have been developed during the years. These techniques were gathered by Munoa J. et al. (2016) [9]: Stability Lobe Diagram (SLD), special tool geometries, increase of stiffness, passive and active damping techniques, and spindle speed variation techniques.
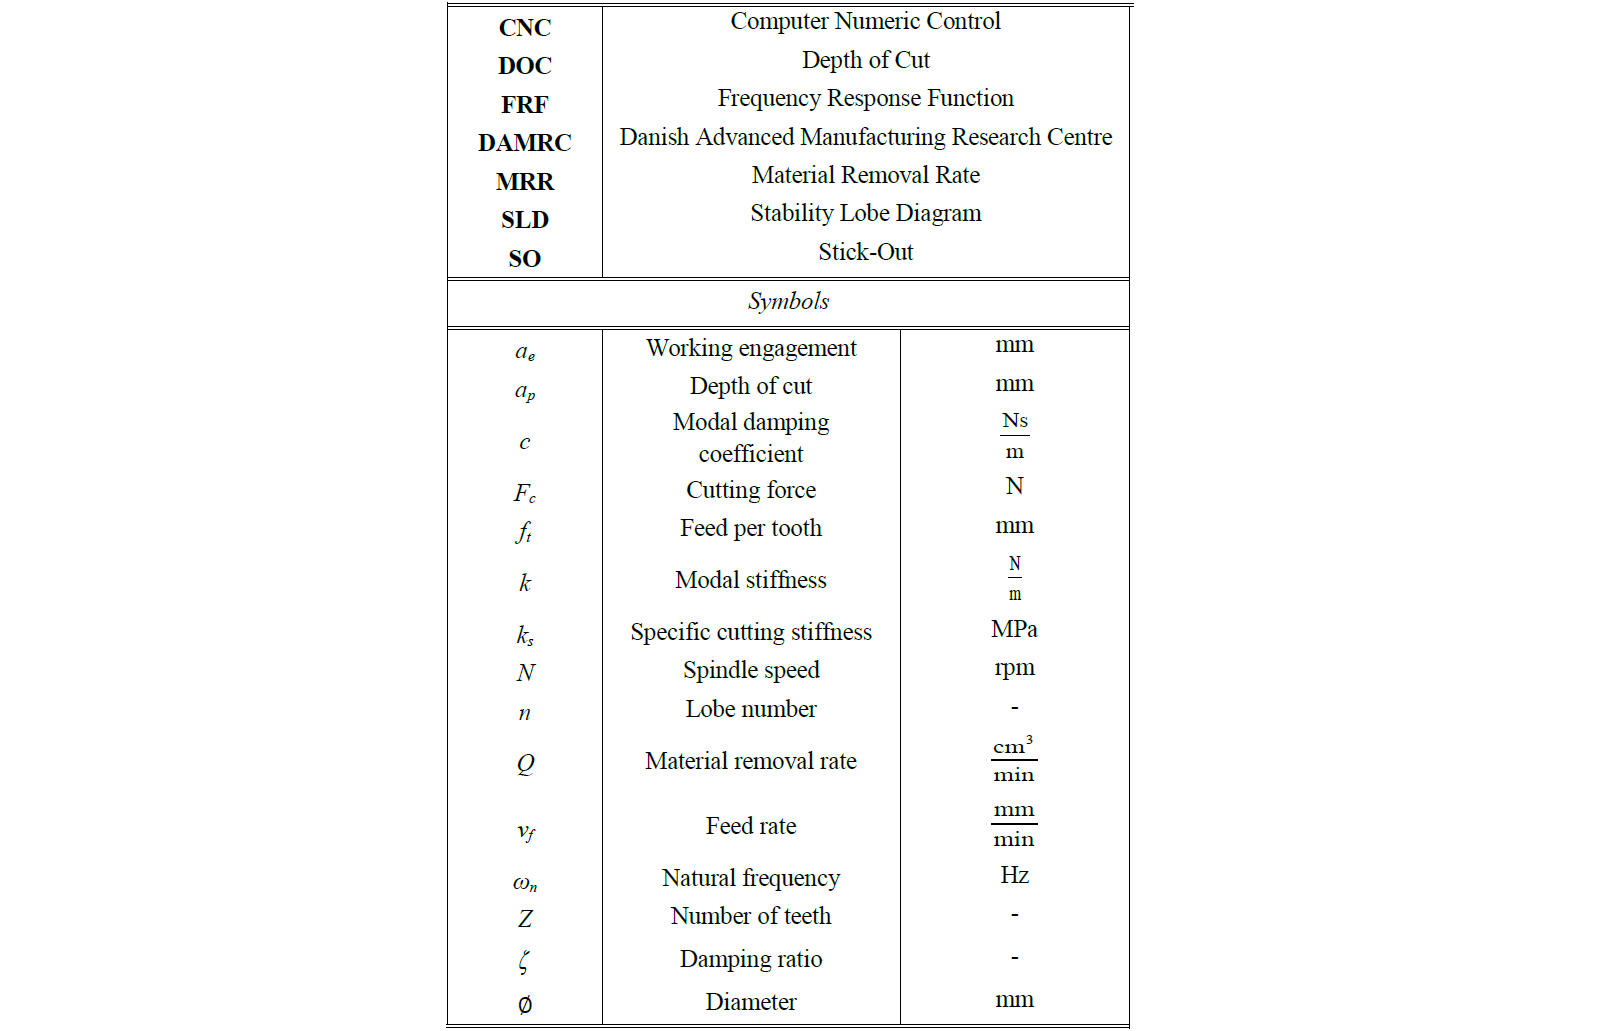
Table 1. Nomenclature
Nevertheless, this paper will focus on the chatter prediction tool known as SLD, which is a graphical representation of the stable and unstable boundaries on a machining process [10], Fig. 4. Apart from being a chatter prediction tool, SLDs are useful to improve the productivity of the machining processes too. The most optimal stable cutting conditions – depth of cut and spindle speed – can be obtained from the SLDs where the highest material removal rates (MRR) will be achieved for a certain tool stick-out.

Fig. 4: Stability Lobe Diagram. The limit stable depths of cut in terms of the spindle speed, obtained by means of Tap-Tests [1]
The goal of utmost productivity is achieved by measuring the material removal rate (Q), a parameter that represents the volume of material removed per unit of time [9]:

Besides, it is well known that the dynamics of the system vary when the tool stick-out is changed, therefore, affecting the stability and productivity of the process. Currently, operators choose the shortest possible tool stick-out by default, but literature has proven that longer stick-outs may be more optimal regarding productivity. Aiming to prove this theory, this paper will discuss the influence of the tool stick-out on machining chatter occurrence during milling operations, from a modal parameters and productivity point of view.
2 Methodology
As prior said, the basis of the oncoming analysis stands on the Stability Lobe Diagrams. The SLD is composed using a stability model fed with four different sets of inputs listed in Fig. 5.

Fig. 5: Input data for composing a SLD [2]
Methods such as the Average Tooth Angle Approach, developed by Tlusty J. (1986) [13] are applied to combine the input parameters that compose the SLD. This technique assumes an average angle of the cutting tooth, thus assuming an average force direction. Therefore, a system which is non-dependent on time that limits the stability boundaries will be obtained from [11]:

The presented algorithm must be fed with the system dynamics, an input that is also known as the frequency response function of the system. The FRF is defined as the relationship between the input and the output data of the system, which on this project are the force and the amplitude of the vibrations, respectively [14]; obtained via Tap-Tests.
These tests gather information about the dynamics of the system by exciting the tool tip [15]. An impact hammer will exert a force to the tool tip, measuring the input force signal, whilst an accelerometer located at the tool tip will measure the response, the output acceleration amplitude. Then, the MetalMax® TXF software will compute and plot the corresponding FRF and SLD to the tested system.

Fig. 6: Tap-Test equipment: impact hammer (1), accelerometer (2), DAQ (3) and computer equipped with Metal Max TXF software (4)
The Tap-Test execution has been done as follows: firstly, the tool geometry, workpiece properties, stick-out and so on, will be introduced in the software. These data has been obtained from the previously performed sensitivity analysis on the workpieces by the DAMRC. Secondly, each tested tool will be excited in the X and Y directions, as shown in Fig. 6, at least 5 taps for axis, as high coherence of the signals is crucial.

Fig. 7: Tested endmills (left), from left to right: ∅16Z4, ∅12Z4, ∅10Z4 and ∅8Z4. Tested tool holders (right), from left to right: Tool holder I and Tool holder II
The analysis of the stick-out has been divided into two sub-analysis that study the influence of the tool stick-out on: the modal parameters and productivity. To that end, numerous Tap-Test have been performed for different tool holder/tool/stick-out combinations, Fig. 7 and Table 2, in order to identify qualitative general behaviours. The CNC milling machine where the Tap-Tests have been conducted is a Mazak Variaxis 630-5X.
Table 2. Experimental plan

2.1 Influence of the tool stick-out on the modal parameters
The modal parameters characterising the system will be calculated by means of the Peak-Picking method presented on numerous studies: Naderpour H. and Fakharian P. (2016) [18], Schmitz T. L. and Smith K. S. (2019) [11]… The main objective is to determine general behaviours on the modal parameters when the tool stick-out is lengthen, and their effect on the SLD.
The Peak-Picking method will calculate: natural frequencies (ωn), modal damping ratio (ζ), modal damping coefficient (c) and modal stiffness (k), based on the FRFs obtained from the Tap-Tests.
Knowing that the peaks at the imaginary relative response, Fig. 8, represent the natural frequencies of a mode shape of the system [7], the other modal parameters can be calculated following the next equations (7)-(10):

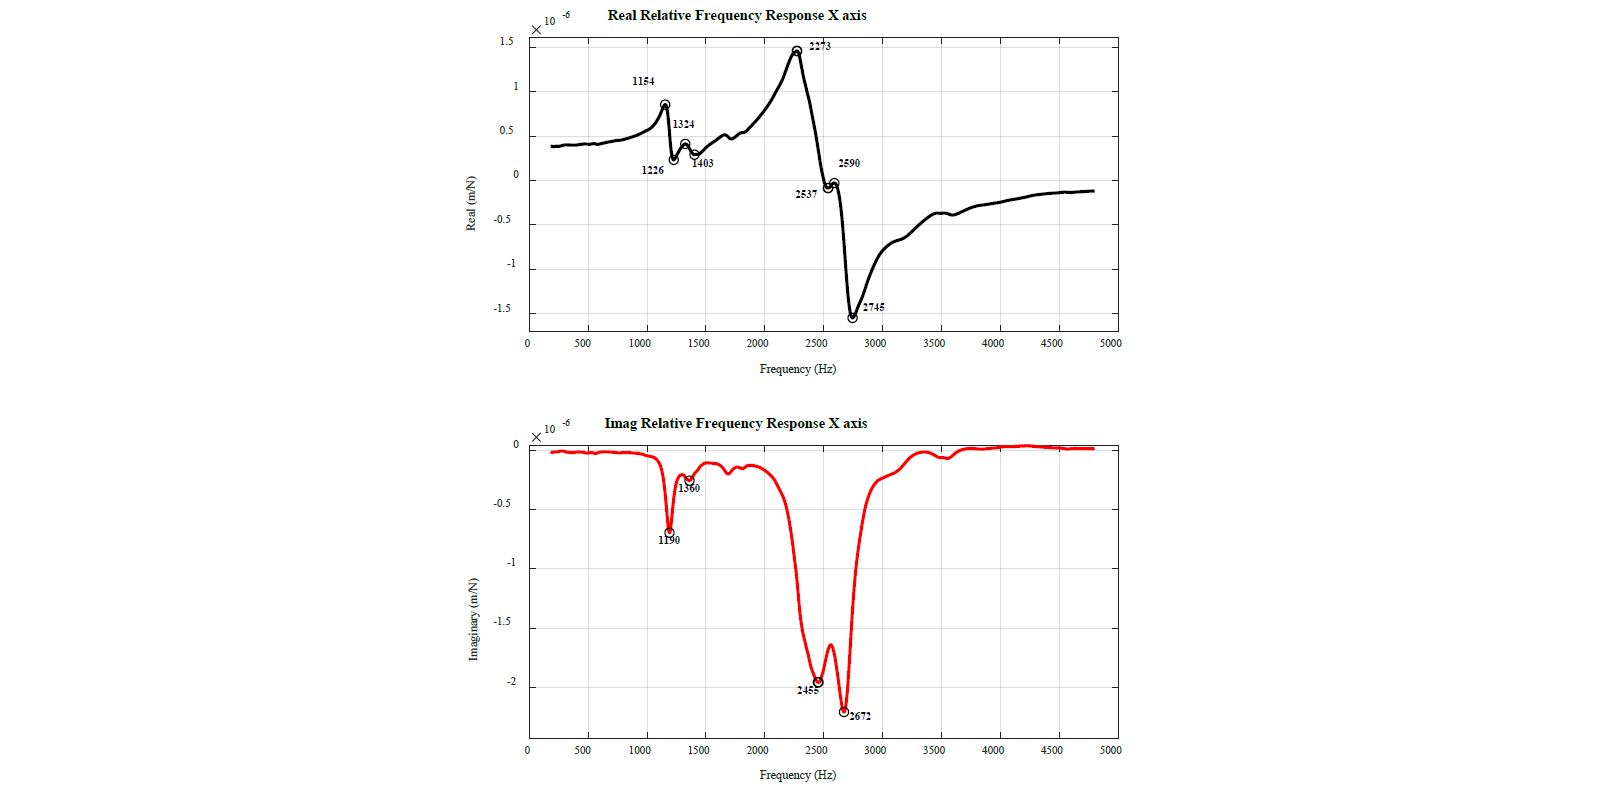
Fig. 8: FRF for the experiment C.1 on Table 2: Real response (top) and Imaginary response (bottom)
The included numerical data corresponds to the detected 4th mode of the system.
2.2 Influence of the tool stick-out on productivity
Previous research at the DAMRC have concluded that some stick-outs can be more productive than others. Therefore, this section of the paper intends to analyse the behaviour of the MRR while the tool stick-out is lengthen. For that, the maximum MRRs will be analysed.
Finally, the reliability of the obtained limit chatter depths of cut via the MetalMax® TXF Software will be tested. For that, some machining tests have been planned aiming to provoke chatter with two endmills under different spindle speeds, Fig. 9. These machining tests have been conducted in a DMG DMU 75 mono Block CNC milling machine. Here, two cast milled Al5083 (200x176x30) workpieces have been machined.

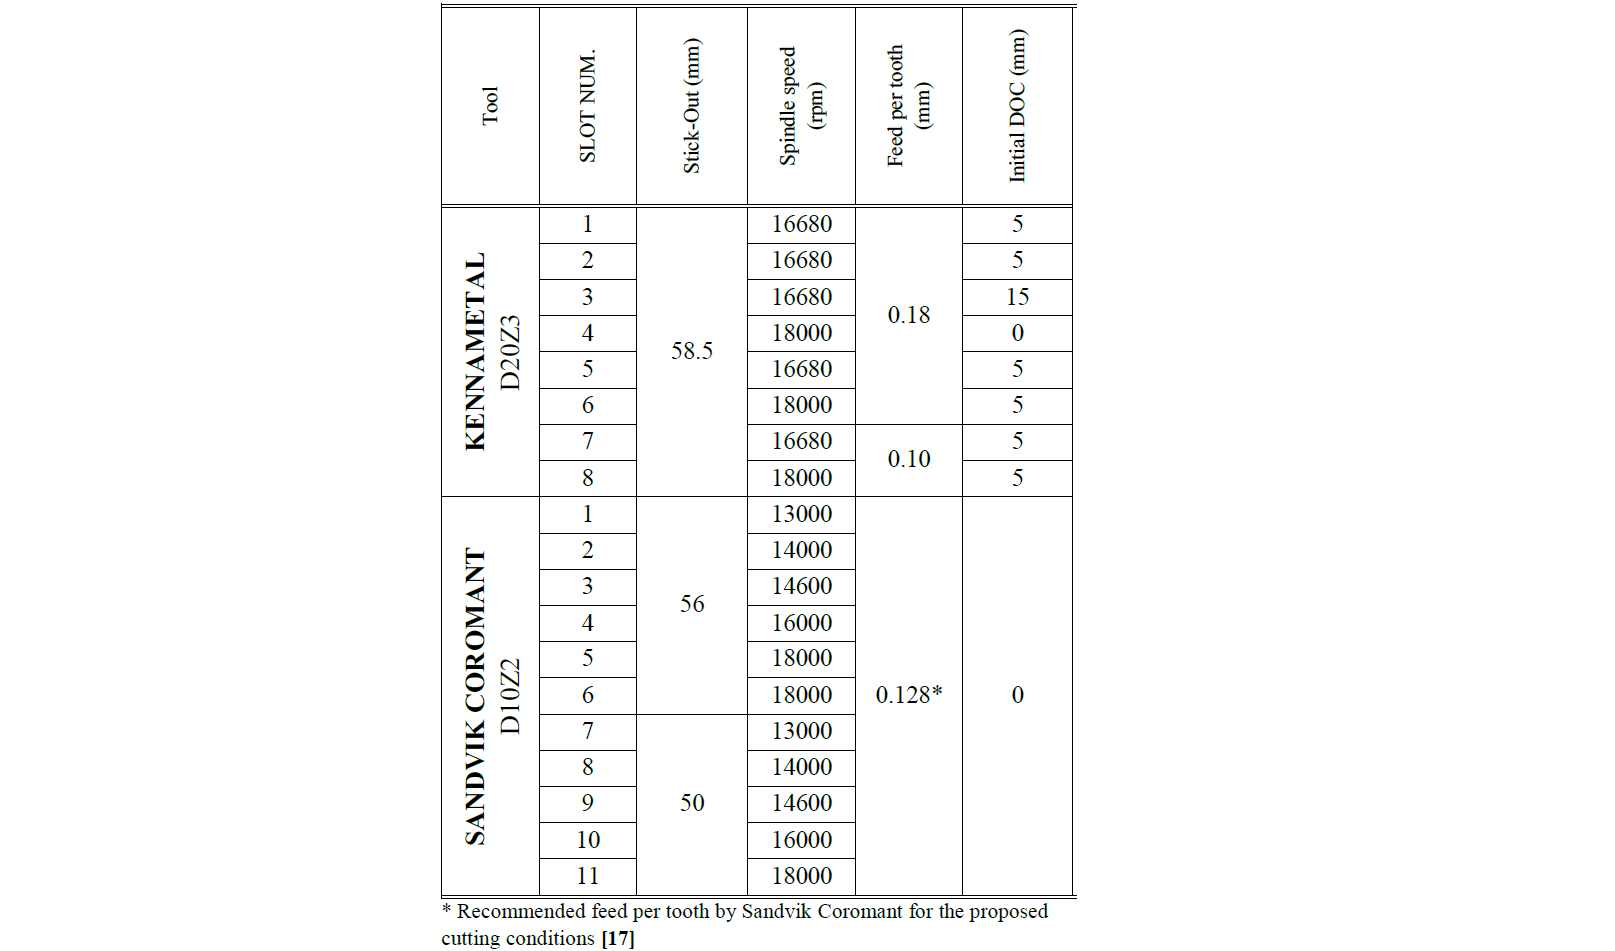
Fig. 9: Endmills for machining tests: Sandvik Coromant D10Z2 [17] and Kennametal D20Z3 [19] and set-up of the workpiece in fixtures
The basis of these experiments stands on machining slots to the workpiece at different spindle speeds, intending to analyse two facts: the peak-valley behaviour of the SLDs [11] and the correlation between the theoretical and experimental chatter occurrence depths of cut. In order to obtain a time increasing depth of cut, the table of the CNC was set at a 2º angle as shown in Fig. 9.
Table 3. Experimental plan for the machining tests
3 Result discussion
3.1 Influence of the tool stick-out on the modal parameters
On the one hand, it has been seen that the behaviour of the modes of the system is independent with each other; while some modes are highly affected for a stick-out change others barely vary. This independent behaviour can be appreciated in the Fig. 10, where the imaginary responses for all the conducted experiments, Table 2, have been gathered. On the other hand, the natural frequencies have a decreasing tendency when the tool stick-out is lengthen, Fig. 11a, some natural frequencies will drop more abruptly than others though. Less stiff tool holders like Tool Holder II (due to its slenderness) will provide higher natural frequencies to the system than Tool Holder I. The damping ratio, which shows an unpredictable behaviour, is barely affected by a tool stick-out change, Fig. 11b. When the tool stick-out is lengthen, the modal stiffness of some modes decrease while others increase, depending on the element they belong to. Mode 1, Fig. 11c, decreases linearly therefore, it might be one of the tool’s modes.
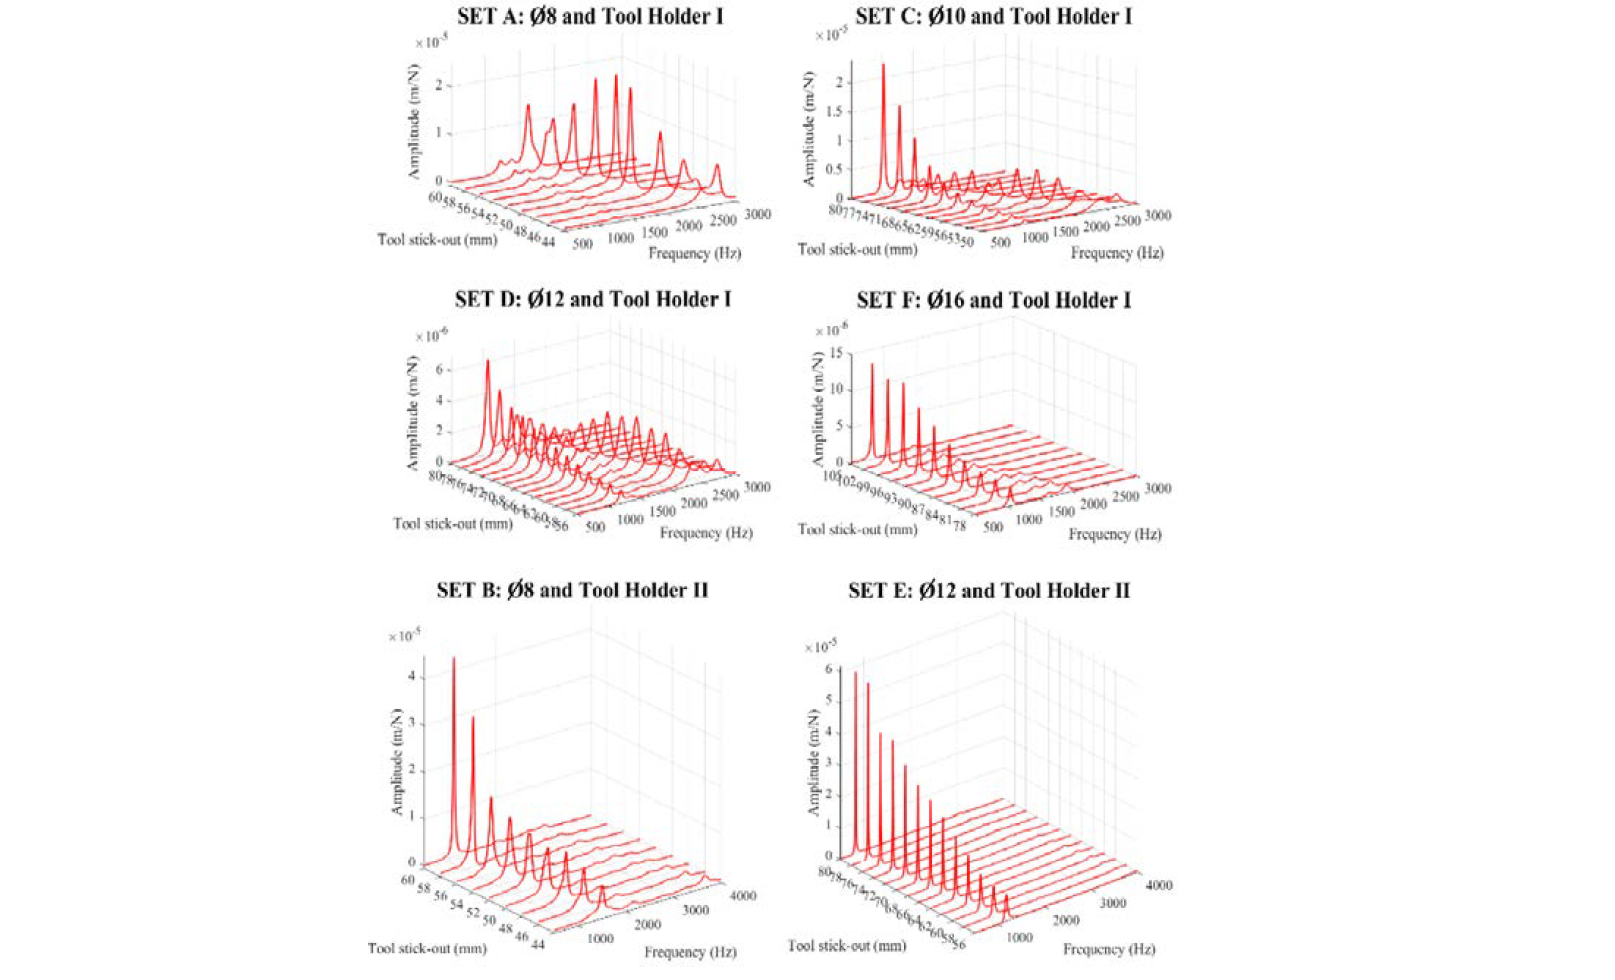
Fig. 10: Imaginary part of the FRFs for the experiments, the peaks represent natural frequencies of the modes
Finally, the amplitudes of the system have been analysed in order to study the predominance of the modes, Fig. 11d. Smith S. et al (1998) [20] concluded that the spindle-holder modes predominate for very short tool stick-outs, tool modes dominate on longer tool stick-outs and for extremely long stick-outs the effect of the spindle-holder modes becomes insignificant. This predominance switch from spindle to tool has been detected for sets C and D; where the amplitude of the vibrations were bigger for the spindle’s mode (mode 4) and at certain stick-out the amplitude of the tool’s mode (mode 1) surpasses the spindle’s vibrations amplitude. When testing set C, this switch was given at 66 mm stick-out, whilst in set D was given at 71 mm stick-out. If wider ranges of stick-outs were tested for the other tools, predominance switches would have been detected too.
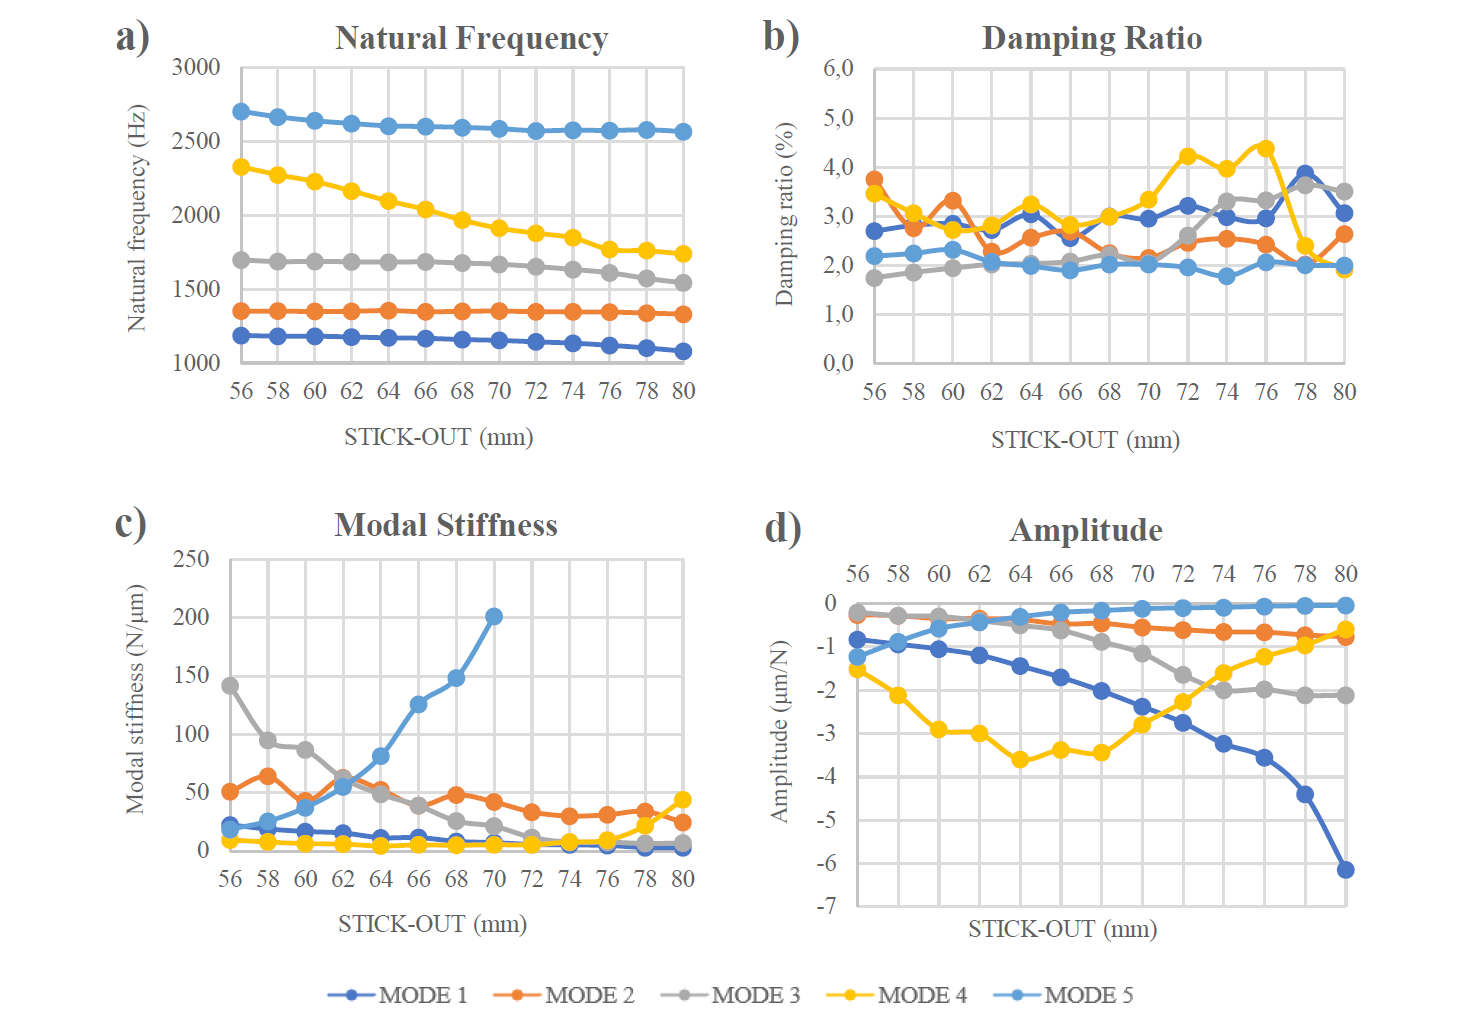
Fig. 11: Modal parameters vs. tool stick-out (SET D on Table 2)
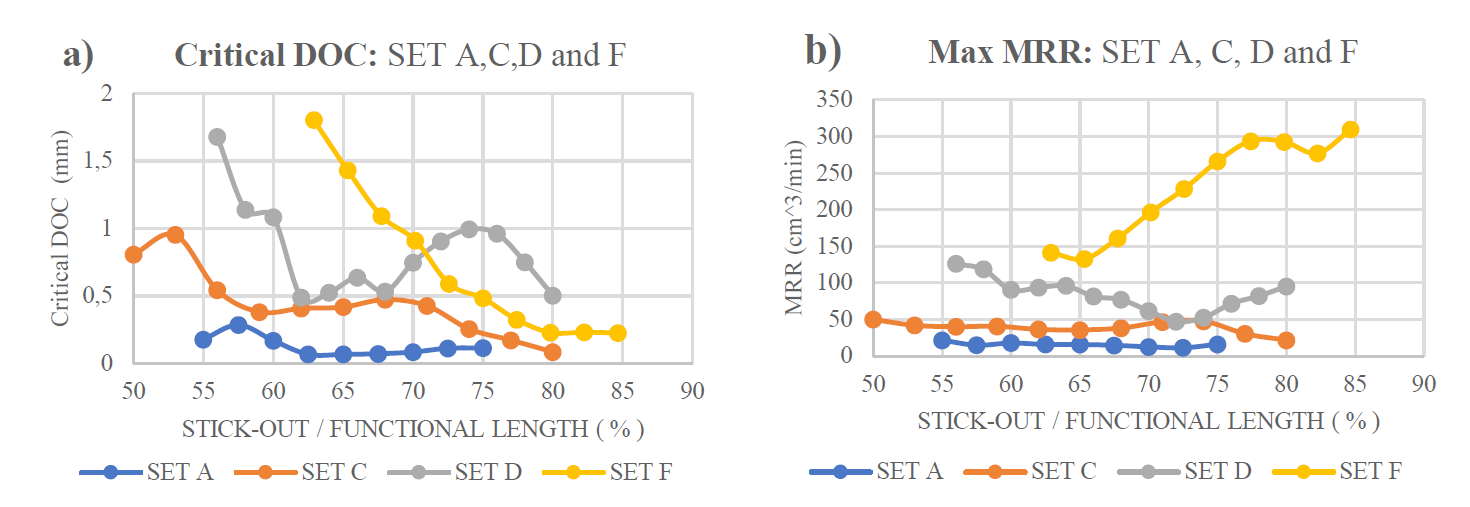
Fig. 12: Critical depths of cut (left) and maximum MRR (right) for combinations tested: SET A, C, D and F. Combinations on Table 2
For bigger diameter tools the predominance switch is given at higher stick-outs. Moreover, a stiffer tool holder will suppose a later predominance switch. Therefore, the theory developed by Smith S. et al. (1998) [20] has been proved. All this parameters will directly affect the critical depth of cut, which is the depth of cut where stable cutting conditions are achieved for every spindle speed.
In general, the shorter the stick-out the higher the critical depth of cut will be, Fig 12a. This is related to the predominance of the spindle and tool modes; the less predominant the tool’s mode is the higher the critical DOC will be. When the spindle’s mode is the predominant the system is stiffer, vibrates less and higher critical depths of cut will be obtained. Nonetheless, some small increases on the critical depths of cut have been detected. This occurs at the stick-outs where the predominance switch is given on set C (at around 66 mm stick-out) and (at around 71 mm stick-out). This phenomena is known as dynamic absorber effect, and is a consequence of the interaction of two modes [21]. This interaction turns the system dynamically stiffer not only for the stick-outs where the switch occurs but for the ones close to that value too, shifting the SLDs upwards.
3.2 Influence of the tool stick-out on productivity
The achievable maximum material removal rates will be calculated for each combination as shown in Fig. 12b.
Table 4. Most optimal stick-out per SET

Small diameter tools tend to provide higher material removal rates at the shortest tool stick-outs, Table 4. This will be the case of sets A, B, C and D. However, sets E and D provide the highest MRR at the longest stick-outs. This proves that the current tendency of using the shortest tool stick-outs can negatively affect the productivity of the machining process. Next, the possible improvement from the least to the most optimal stick-outs for each set, from Fig. 12b, have been calculated:
Table 5. Productivity improvement with stick-out

Consequently, it is unarguable that the tool stick-out can increase the productivity of a machining process, Table 5. The obtained results at this section suggest that the highest MRRs are obtained either at the longest or shortest stick-outs, but not at in-between values.
Moreover, in a milling system which is a multi -mode system there is a risk of cut peaks on the SLD, which would decrease the achievable maximum MRR. The peaks and valleys of the dominant mode and the non-dominant modes interact with each other [12], and a lack of coherence would mean a cut peak. An example would be the peak located between 1000 -1200 rpm on Fig. 13, where the peak was cut at around 11 mm depth of cut.
3.3 Machining tests
The experimental plan exposed in Table 3 has been followed, where some spindle speeds corresponding to the peaks and valleys of the previously calculated SLDs for those combinations have been chosen.
Provoking chatter with the ∅20Z3 Kennametal tool was difficult for these tool/holder/stick-out combination, succeeding only in 2 slots out of 8. As it can be seen, the obtained result did not show neither the expected peak-valley behaviour nor enough data to reach to a conclusion. Thus, it was decided to choose a smaller diameter tool easing the chatter provocation.

Fig. 13: Results for the Kennametal ∅20Z3: comparison of the theoretical (black SLD) and experimental (red dots) results
The second set of machining tests was conducted with a Sandvik Coromant 10Z2 tool. Firstly, 6 slots where machined with the tool fixed at 56 mm stick-out and chatter was provoked in all of them as shown in the top graph of Fig. 14. Furthermore, slots 5 and 6 where machined with the same cutting conditions, but the chatter occurrence depth of cut differ from each other.. Secondly, the same tool was fixed at 50 mm and the same spindle speeds were used when machining the 5 slots.
It is visible that the experimental depths also show a peak-valley behaviour, like the theoretical SLDs do, Fig. 14. Nevertheless, the location of the experimental peaks and valleys is shifted and does not match with the theoretical ones (black lobes). This occurs due to the dependence of the modal parameters on the dynamics of the spindle; actually, modal damping and natural frequencies of the system obtained from the Tap-Tests will differ from those resulting from the cutting [16]. That is to say, the ability of the system to absorb energy or damp forces will increase when the spindle is turning (cutting).
Besides, an incorrect characterisation of the workpiece material can lead to a lack of correlation between the experimental and theoretical results. Based on the experience of the DAMRC, Al5083 has a specific cutting coefficient of 450 N/mm2, a value that must be introduced manually in the software. This parameter can shift upwards and downwards the SLDs; higher coefficient turns it downwards while lower ones upwards.
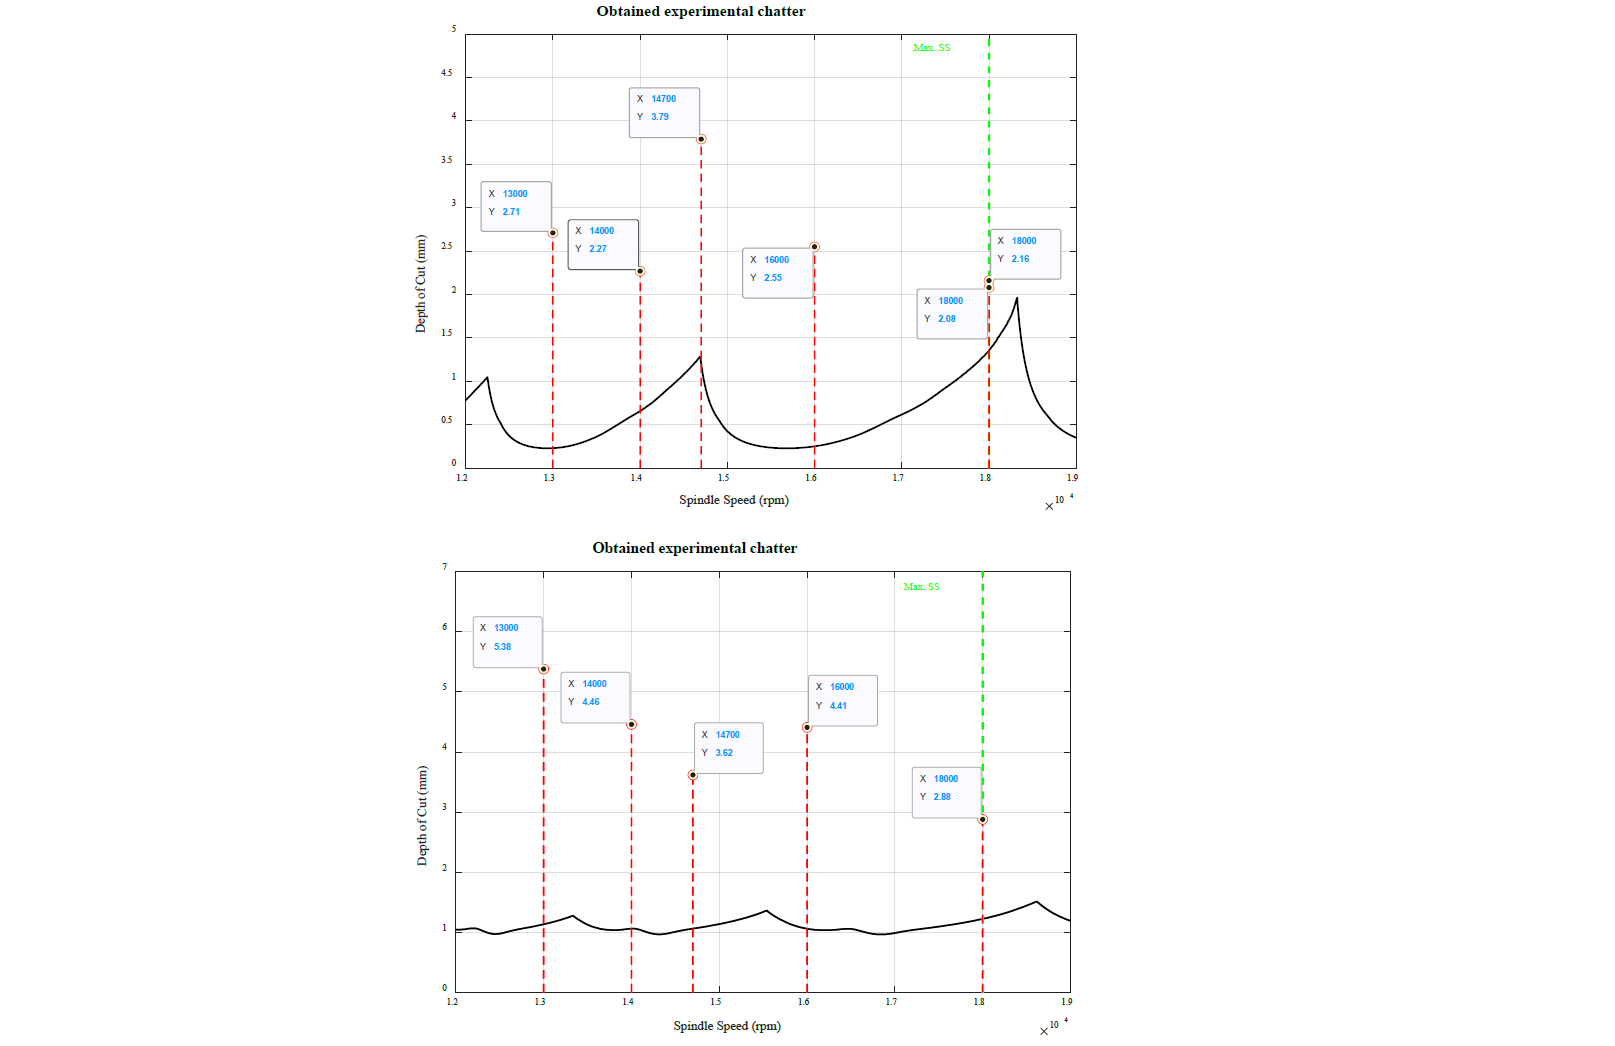
Fig. 14: Comparison of the theoretical, black SLD, and experimental, red dots, results on the SLD: SO56 (top) and SO50 (bottom)
4 Conclusions
Regarding the modal parameters, the next tendencies have been identified:
-
The natural frequencies of the system decrease either when the tool stick-out is lengthen or when the diameter of the tool is increased. Each mode will suffer a different fall in the natural frequency for the same tool stick-out change.
-
Damping ratios are not highly dependent on the stick-out, showing an unpredictable behaviour.
-
Modal stiffness is highly dependent on the tool stick-out. Some modes become stiffer (spindle) and other less stiff (tool) when the stick-out is lengthen.
-
The spindle mode will predominate at the shortest stick-outs showing the biggest vibration amplitudes. When the tool stick-out is lengthen a switch on the predominance is given and the mode of the tool becomes dominant.
Later, their effect on the Stability Lobe Diagrams was analysed and the next was concluded:
-
High stiffness and damping ratios increase the critical depth of cut. The natural frequencies affect the SLD spindle-speed-wise.
-
The shorter the tool stick-out is the higher the critical depth of cut will be.
When it comes to the influence of the tool stick-out on the productivity, these tendencies have been detected:
-
The productivity can be optimised by choosing the most optimal stick-outs, spindle speed and depths of cut.
-
The lack of coherence between the dominant and non-dominant modes could lead to a productivity decrease.
-
The highest MRRs are obtained when the natural frequencies shift the peak of the dominant mode close to the maximum spindle speed of the milling machine. There, the highest stable depths of cut and spindle speed will be achieved obtaining higher MRRs if there is coherence between modes.
-
For smaller diameters, the shortest stick-outs provide higher productivity rates, while tools with bigger diameters provide higher MRR at the longest tool stick-outs. Yet, this affirmation cannot be extrapolated to every system before doing some Tap-Tests.
Finally, after the machining tests were carried out, the next concluded:
-
Provoking chatter is not possible in every system.
-
The occurrence of chatter can be defined as uncertain because it cannot be affirmed that the same cutting parameters (spindle speed and feed per tooth) will always provoke chatter at the same depth of cut.
-
The experimental chatter occurrence depths of cut are higher than the theoretically calculated ones. The system can absorb more energy than what theory (SLDs) predict.
-
The experimental peaks and valleys does not match with the computed ones. This occurs due to the dependence of the modal parameters on the dynamics of the spindle.
-
The tool goes to instability earlier with long tool stick-outs.
